Remodeled Mixed-Use Duplex
For Sale
Contact for pricing
1412 Dauphin Lane, Orlando, FL 32803
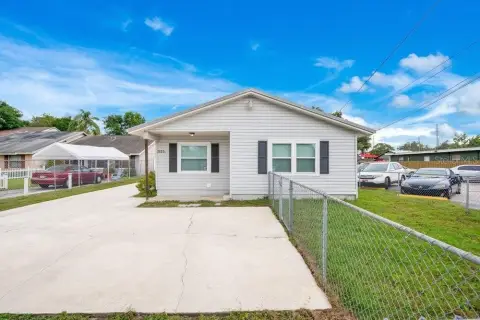
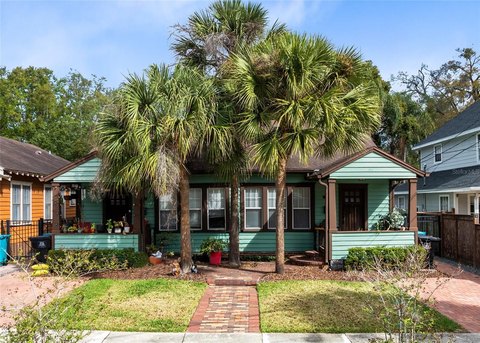
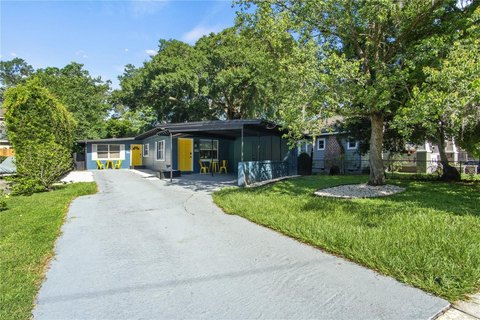
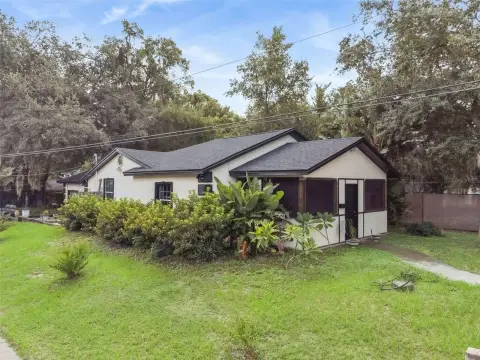
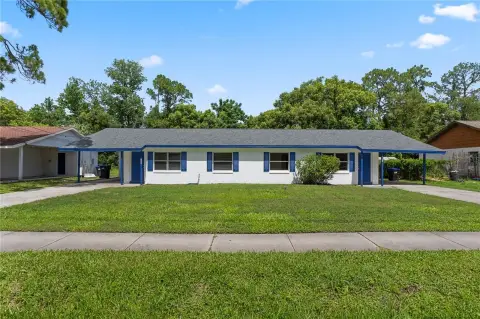
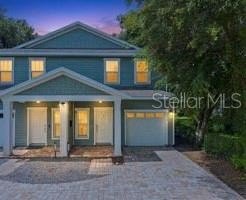
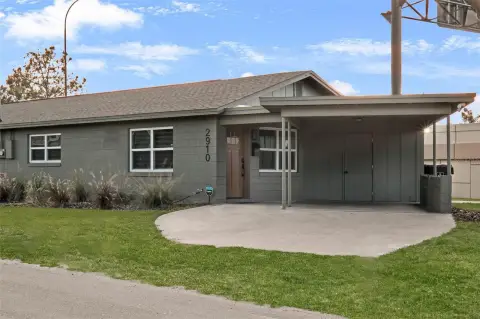
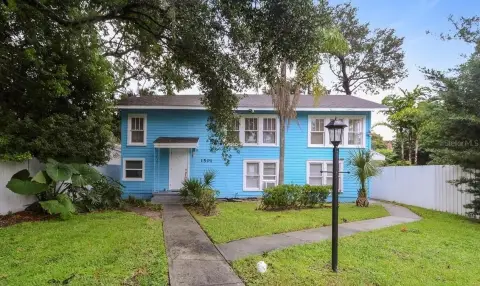
Two-story duplex with flexible mixed-use zoning and remodeled units for residential and commercial use.
Property Size1,816 SF
Price / SF$327.64
Days on Market97
Property Features for 1412 Dauphin Lane
General Information
Standard status
Active
Size
1,816 SF
Class
C
Total Parking Spaces
8
Property subtype
Retail, Office, Mixed Use
Zoning
ORL-MU-1/T/SP
Lease Type
Modified Gross
Investment Type
Owner/User
Additional Details
Multifamily Units
2
Building Details
Year Built
1946
Year Renovated
2024
Buildings
1
Stories
2
Units
2
Tenancy
Multi
Listing Agency:
Pacific Ventures Realty Company
Listed By:
Michael Montgomery · License #FL BK
Source:
Crexi
Added: Jul 9
Changed: Sep 14
Last Checked: Oct 12 at 7:54PM
Displayed information is deemed reliable but is not guaranteed and should be independently verified. All listing content including descriptions, pricing, images are the copyrighted material of Pacific Ventures Realty Company
Investment Insights
Based on property information with market context.
This unique two-story duplex offers flexible mixed-use zoning that allows both residential and commercial uses. The property is configured as two units, with both units reported as remodeled, supporting multiple occupancy and operating options such as living in one unit while running a business in the other, or renting the second unit for additional income.
Located at 1412 Dauphin Lane in Orlando’s Lake Formosa District, the property is described as being in a quiet neighborhood and within walking distance to several local dining and beverage options, including Santiago’s Bodega, First Watch, Pig Floyds, Hawkers, and nearby establishments such as Matador, Ten10 Brewery, and the Guesthouse. The remarks also note proximity to the Orlando Urban Trail and Fresh Market, along with nearby destinations including Lake Formosa Park, the Orlando Science Center, and Ivanhoe Village.
For buyers seeking a mixed-use property with renovated in-place units and dual-use flexibility, this duplex is positioned for easy leasing and practical owner-occupant scenarios.
Located at 1412 Dauphin Lane in Orlando’s Lake Formosa District, the property is described as being in a quiet neighborhood and within walking distance to several local dining and beverage options, including Santiago’s Bodega, First Watch, Pig Floyds, Hawkers, and nearby establishments such as Matador, Ten10 Brewery, and the Guesthouse. The remarks also note proximity to the Orlando Urban Trail and Fresh Market, along with nearby destinations including Lake Formosa Park, the Orlando Science Center, and Ivanhoe Village.
For buyers seeking a mixed-use property with renovated in-place units and dual-use flexibility, this duplex is positioned for easy leasing and practical owner-occupant scenarios.
Key Highlights
- Two‑story mixed‑use duplex built in 1946 with flexible mixed‑use zoning for residential and commercial uses
- Both units have been remodeled
- Live in one unit while using/renting the other for added income potential
Financial Insights
Estimated NOI and Cap Rate
NOI / Yr
$33,914
Cap Rate
5.70%
Suggested Prices Based on Cap Rates
Cap Rate 5%
$678,280
$678.3K
Cap Rate 7%
$484,486
$484.5K
Cap Rate 9%
$376,822
$376.8K
Market Conditions
NOI Build-Up for 1,816 SF
Gross rent
$54.5K $30.00/SF
− Vacancy
−$9.3K −$5.10/SF
EGI
$45.2K $24.90/SF
− OpEx
−$11.3K −$6.23/SF
NOI
$33.9K $18.67/SF
Area
Orlando, FL
Vacancy
17.00%
Lease Rate
$30.00 /SF/Yr
Expense Ratio
25.00%
Simulate Cap Rate and NOI
Suggested Prices Based on Cap Rates
Cap Rate 5%
$678,280
Cap Rate 7%
$484,486
Cap Rate 9%
$376,822
Alternative Uses
Best Use
Office B
$484.5K
$423.9K – $565.2K
NOI $33,914 @ 7.0% cap · market cap 5.70%
Second Best
Multifamily LT 5
$368.1K
$322.1K – $429.4K
NOI $25,764 @ 7.0% cap · market cap 4.33%
Theoretical Best
Office A
$585.0K
$511.9K – $682.5K
NOI $40,950 @ 7.0% cap · market cap 6.88%
Zoning and permitted uses should be independently verified with authorities.
How Realmo checks its estimates
Property Analytics
Unlock full access to Insights
Subscribe to Realmo Intelligence
Open Analytics
Current Use
Lease Details
2
Residential units
Location Intelligence
Trade Area within ½ mile
2,071
Businesses Nearby
Explore this area
Business Placement
Demographics for 32803, FL
21,003
Population
12,225
Households
1.7
Avg Household Size
38
Median Age
59%
College-Educated
96%
High-School Grad
6.8 sq mi
ZIP Area
3,089
Density / Sq Mi
$101,401
Median Household Income
$61,439
Median Earnings
$1,823
Median Rent
$421,300
Median Home Value
Check the figures for this property
Cap Rate, Value Estimation, Potential NOI and more
View Realmo Analytics
Market
Vacancy Rate% for Office in Orlando, FL

Questions? Ask Rey
Realmo’s AI knows this listing — price, zoning, demand, history. Ask anything.




Frequently Asked Questions
What type of property is this?
Live-work space - Two-story duplex with flexible mixed-use zoning and remodeled units for residential and commercial use.
Where is this live-work space located?
The property is located at 1412 Dauphin Lane Orlando, FL.
What is the asking price?
The asking price for this property is $595,000.
What are key features of this property?
This property features: Two‑story mixed‑use duplex built in 1946 with flexible mixed‑use zoning for residential and commercial uses; Both units have been remodeled; Live in one unit while using/renting the other for added income potential


