Auto Shop with Service
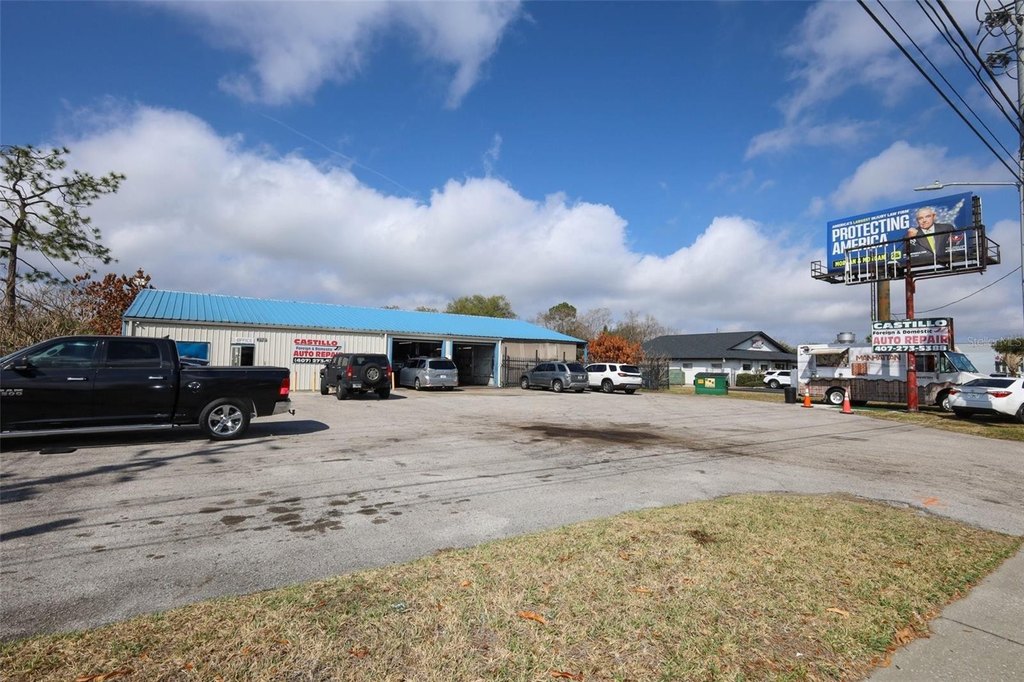
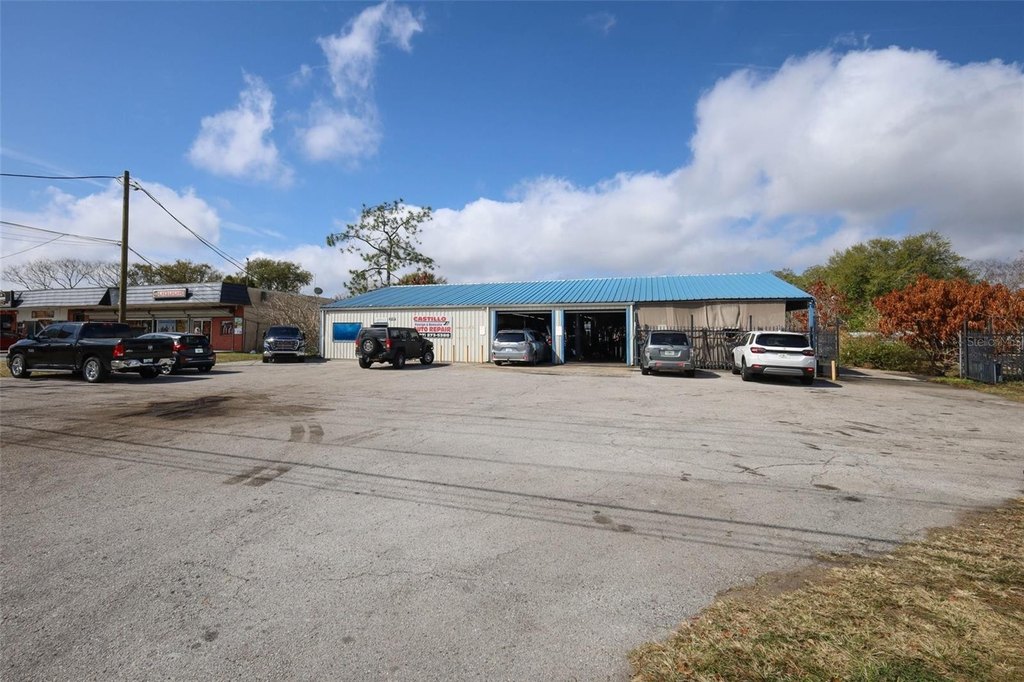
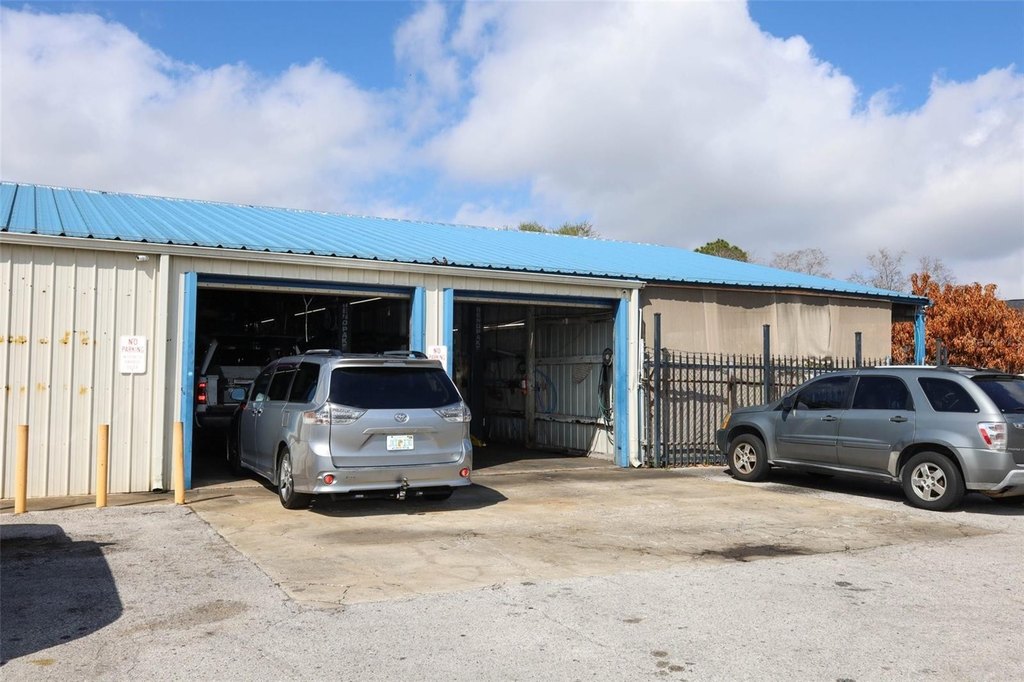
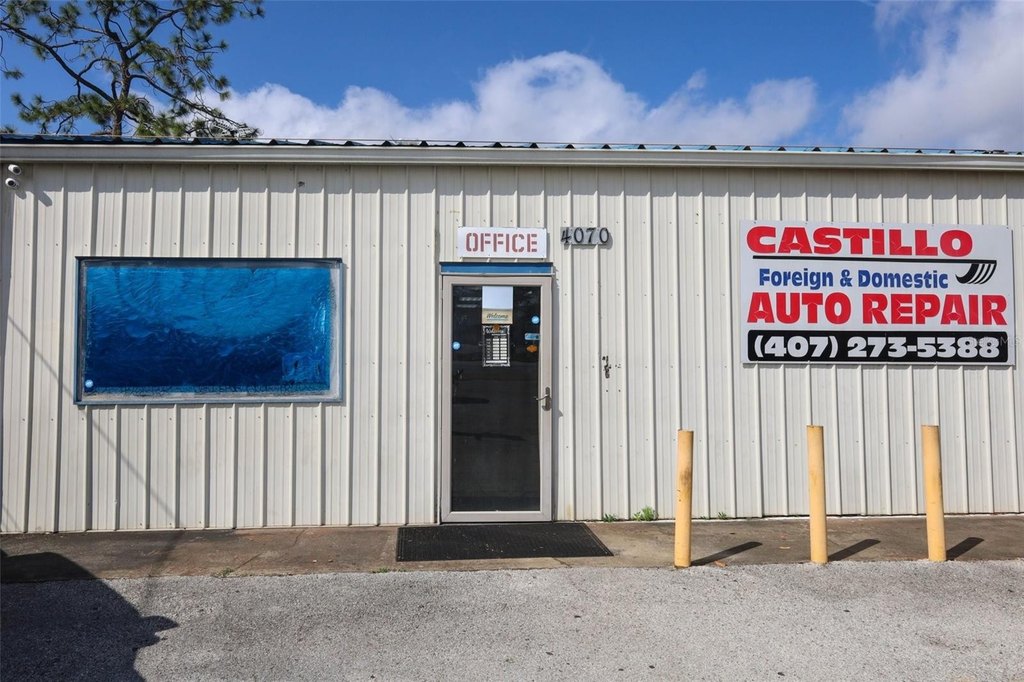

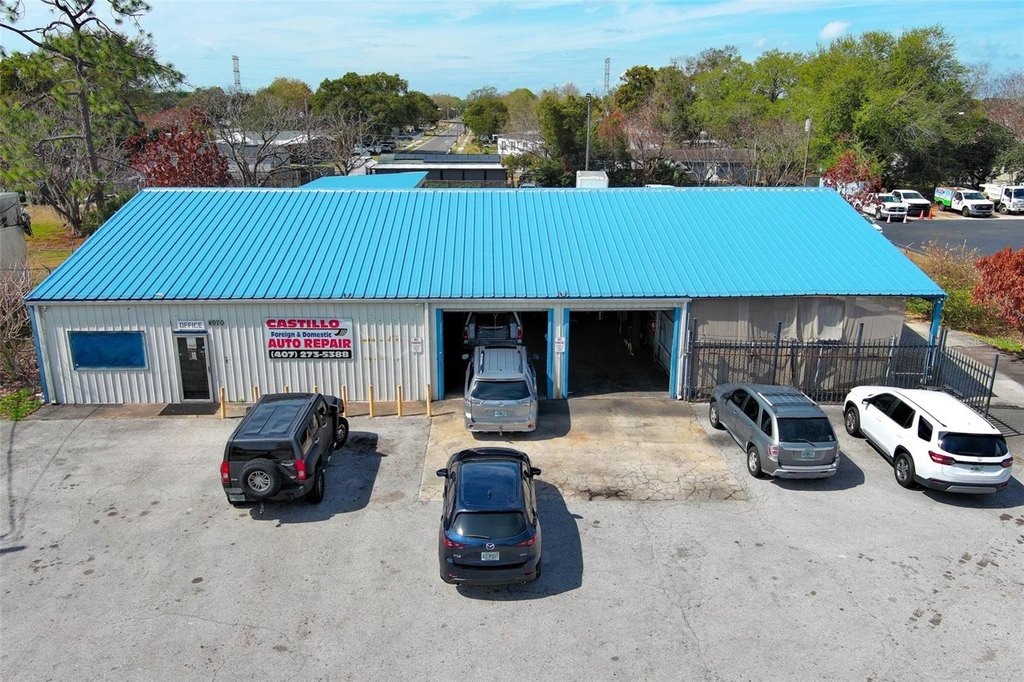
For Sale
$1,900,000
4070 S GOLDENROD Road, Orlando, FL 32822
Commercial Sale, ORLANDO, FL
Property Size3,996 SF
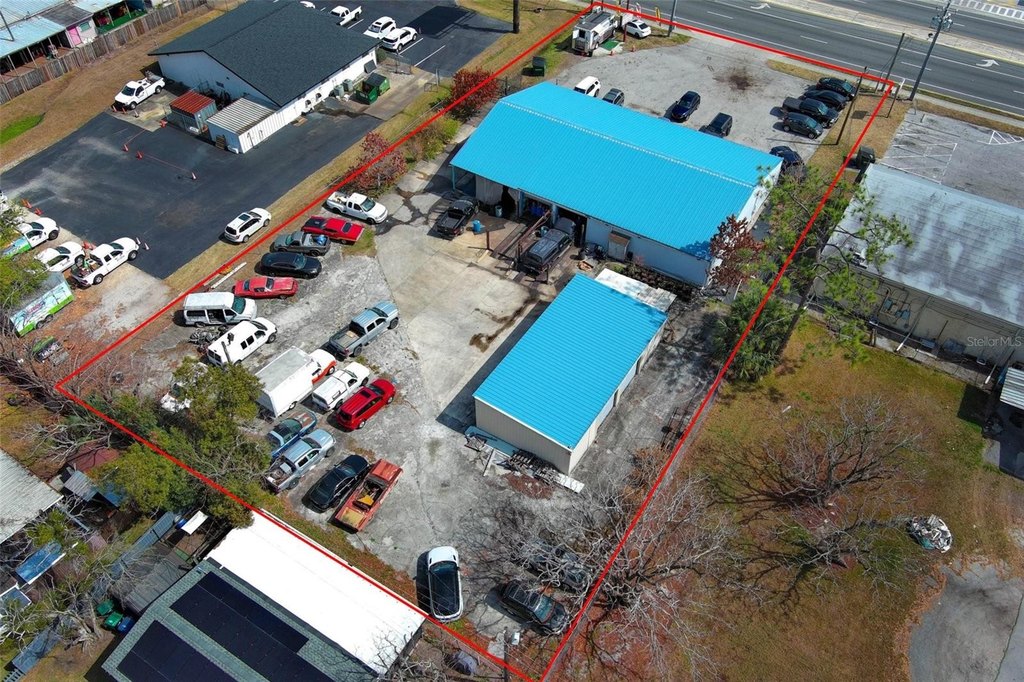
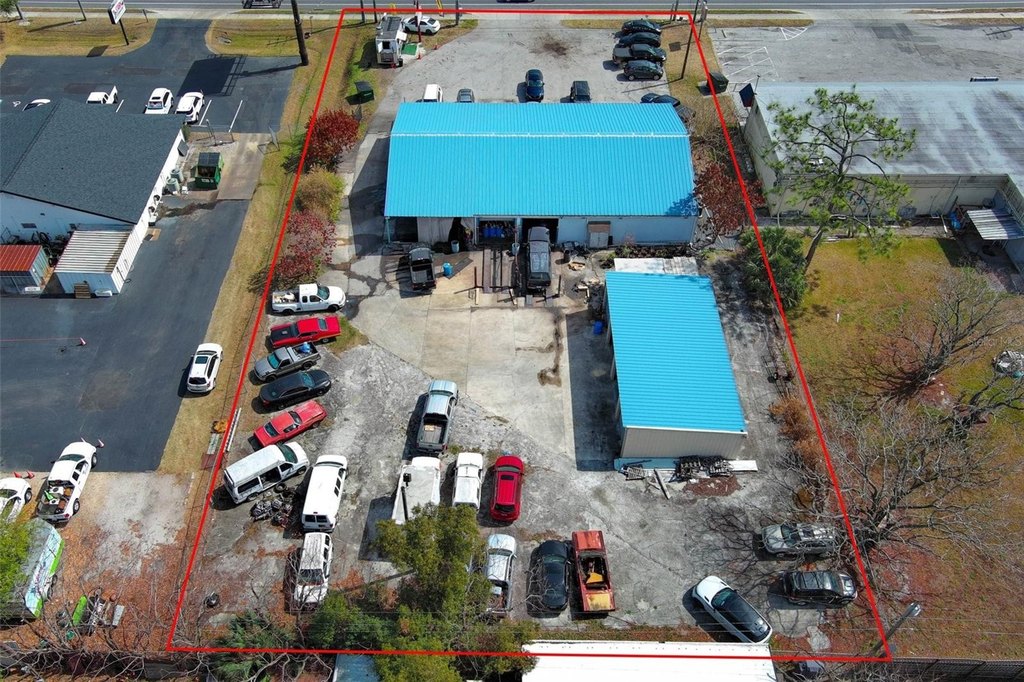
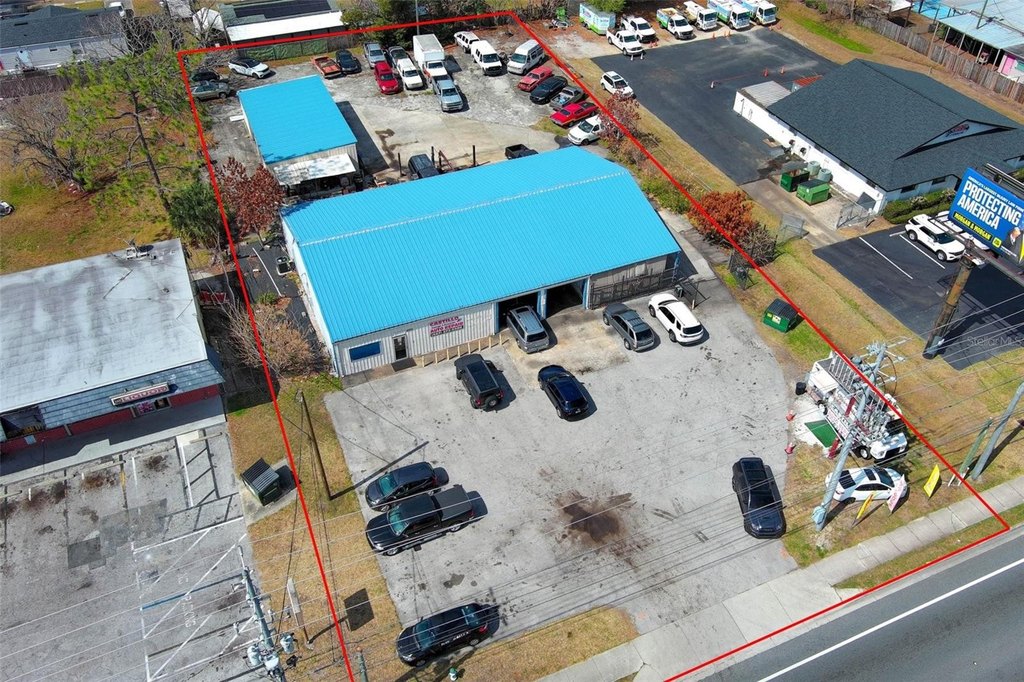
Lot Size0.75 Acres
Price / SF$475.48
Days on Market222
Property Features for 4070 S GOLDENROD Road
General Information
Property type
Commercial Sale
Property subtype
Retail
Zoning
C-2
Security features
Security System
Directions
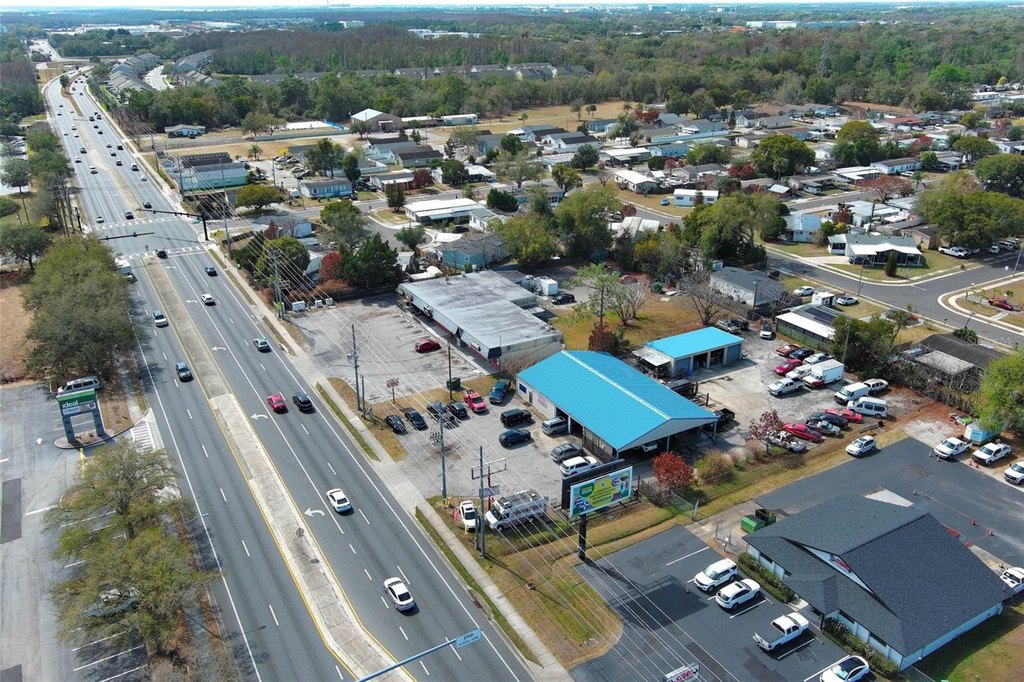
Exit at Goldenrod Rd (Exit 16). Turn right (south) onto S Goldenrod Rd. Continue approximately 2 miles. The property will be on your right-hand side.
Subdivision
32822 - Orlando/Ventura
Standard status
Active
APN
14-23-30-0000-00-010
Size
3,996 SF
Lot size
0.75 Acres
Taxes and HOA fees
Tax Year
2024
Tax Description
FROM SE COR OF NW1/4 RUN N 510 FT W 50 FT FOR A POB TH N 131.5 FT W 250 FT S 131.5 FT E 250 FT TO POB IN SEC 14-23-30 SEE 3368/1084
Tax Annual Amount
7540
Legal Description
FROM SE COR OF NW1/4 RUN N 510 FT W 50 FT FOR A POB TH N 131.5 FT W 250 FT S 131.5 FT E 250 FT TO POB IN SEC 14-23-30 SEE 3368/1084
Utilities
Heating system
Natural Gas
Cooling system
Central Air
Amenities
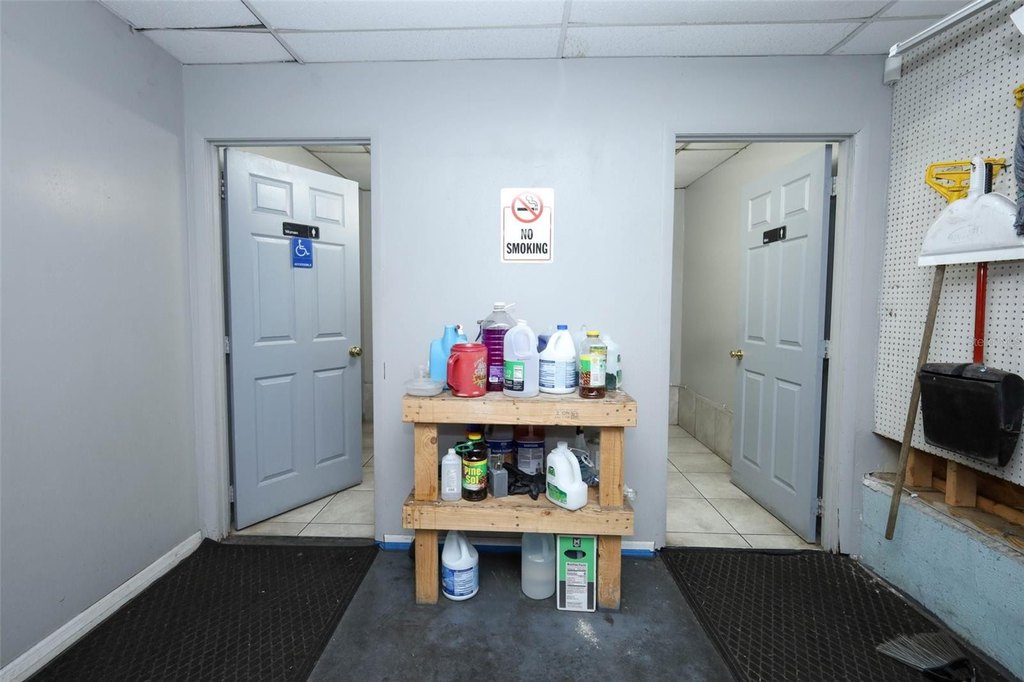
bathrooms
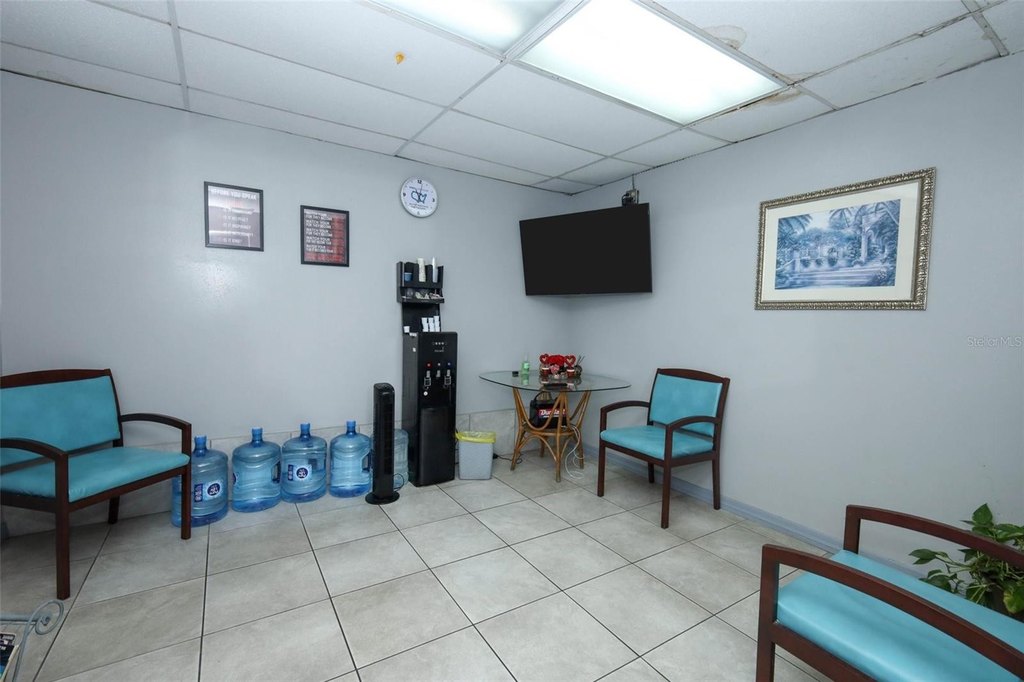
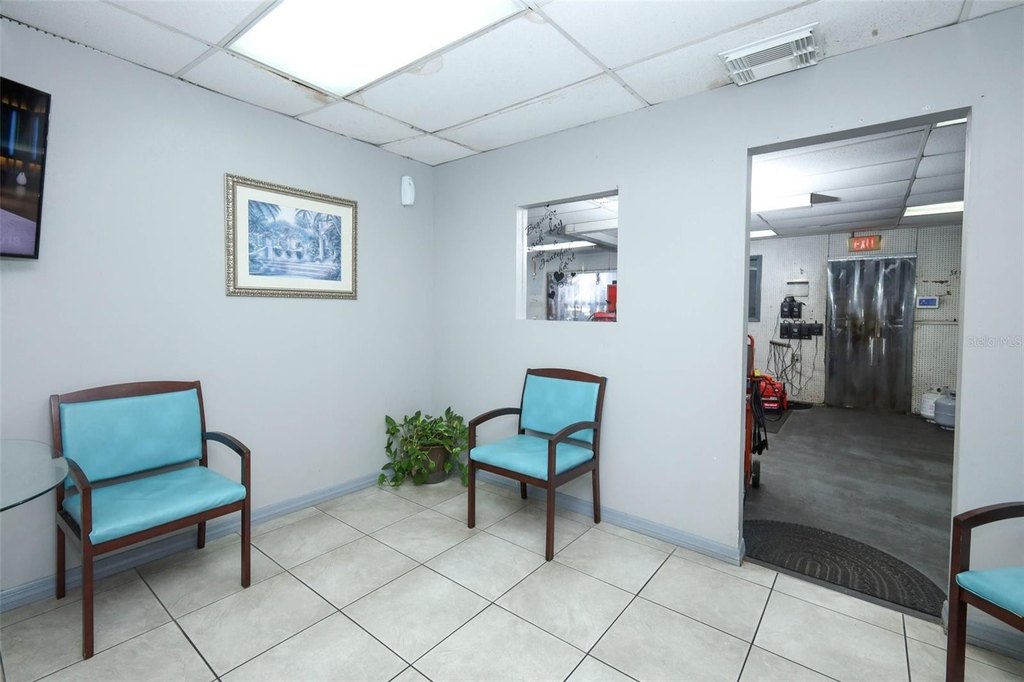
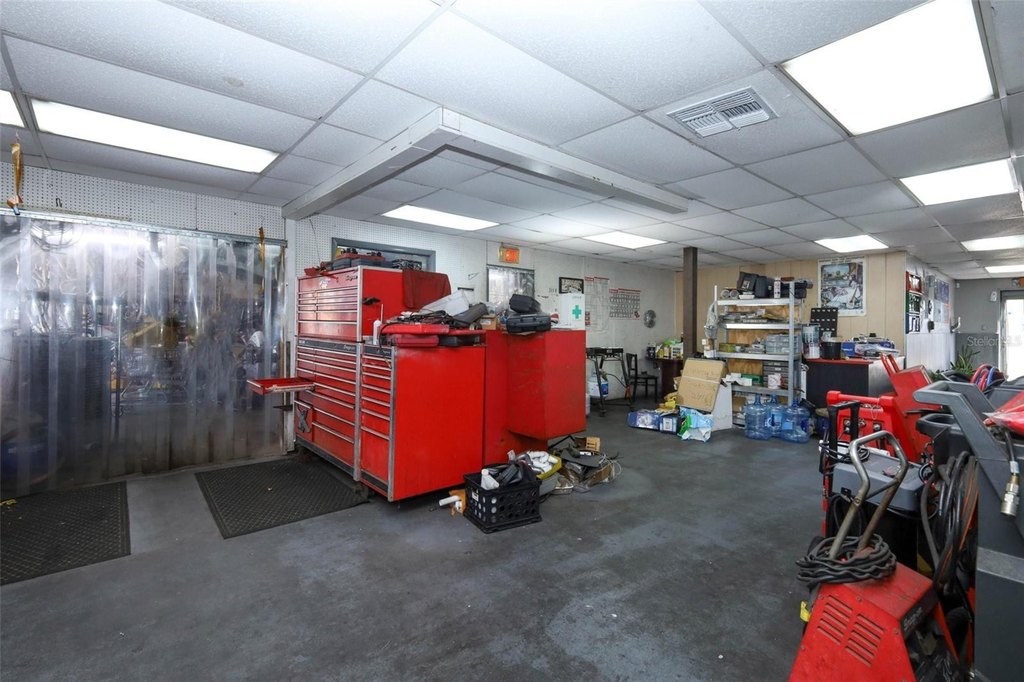
customer waiting room
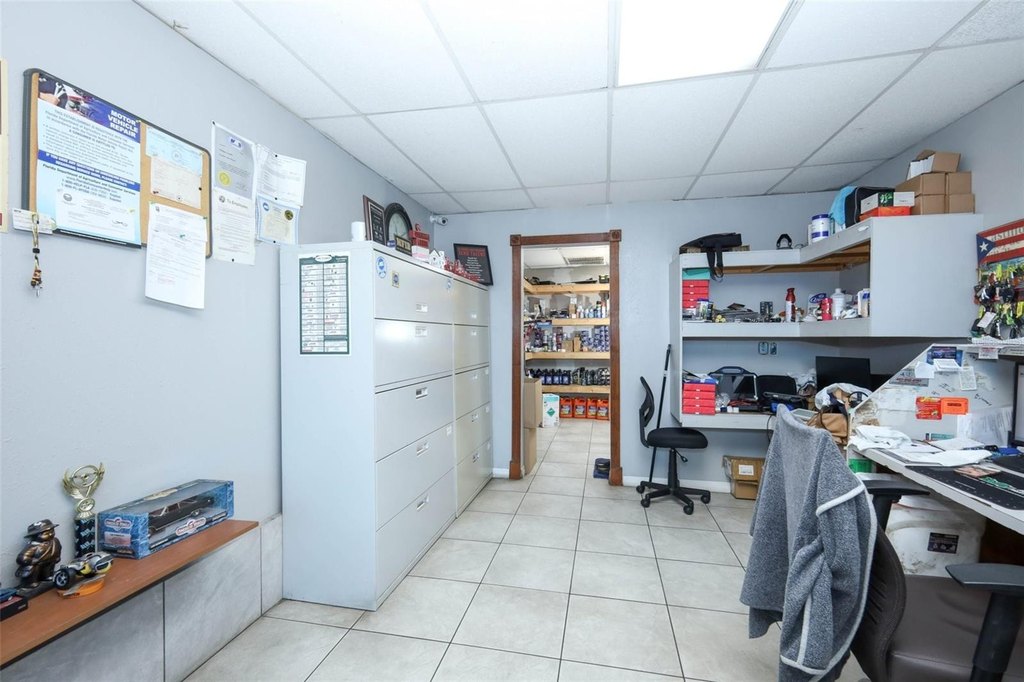
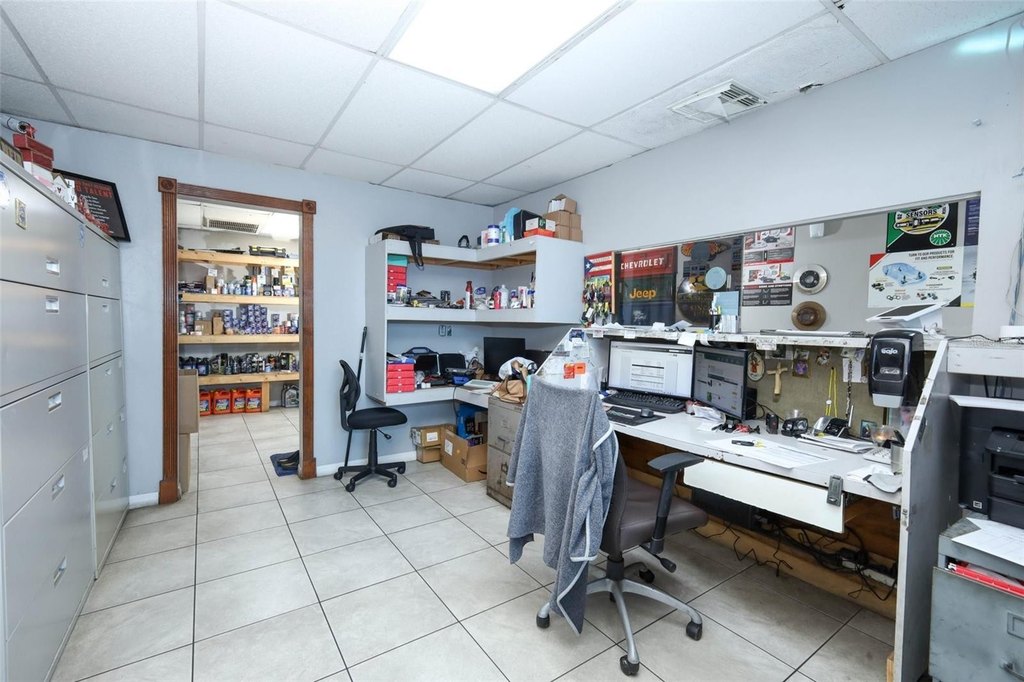
reception office area
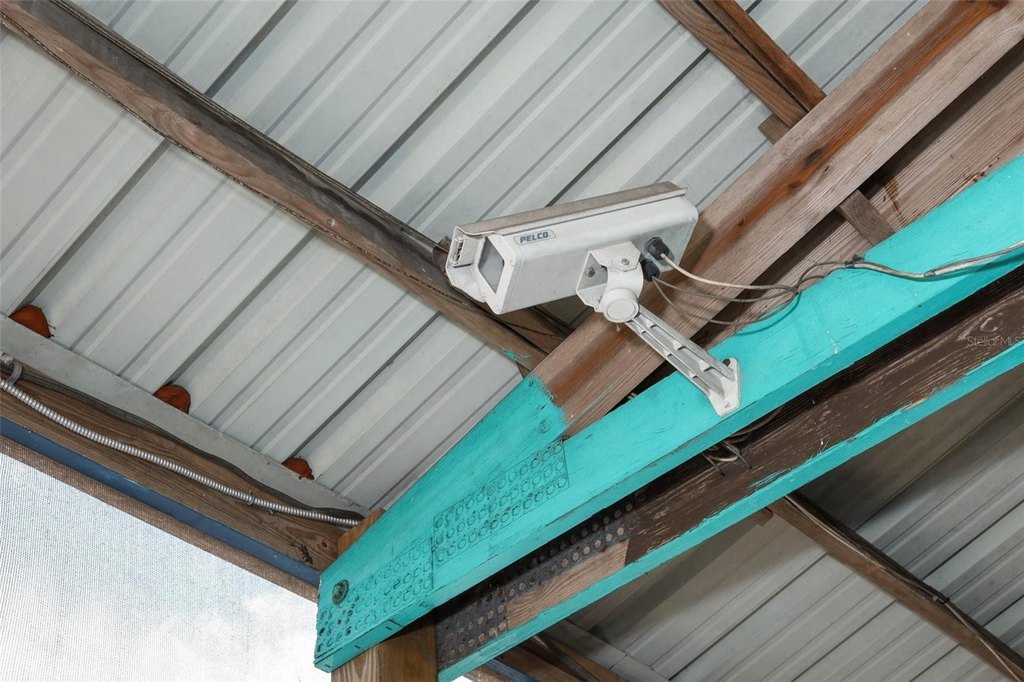
security camera system
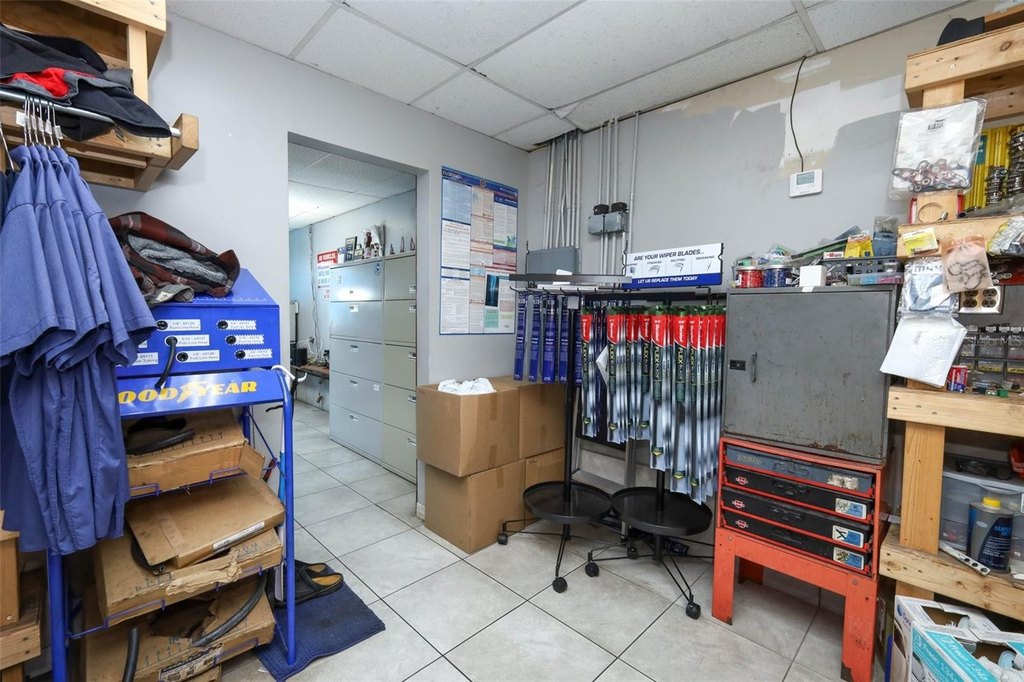
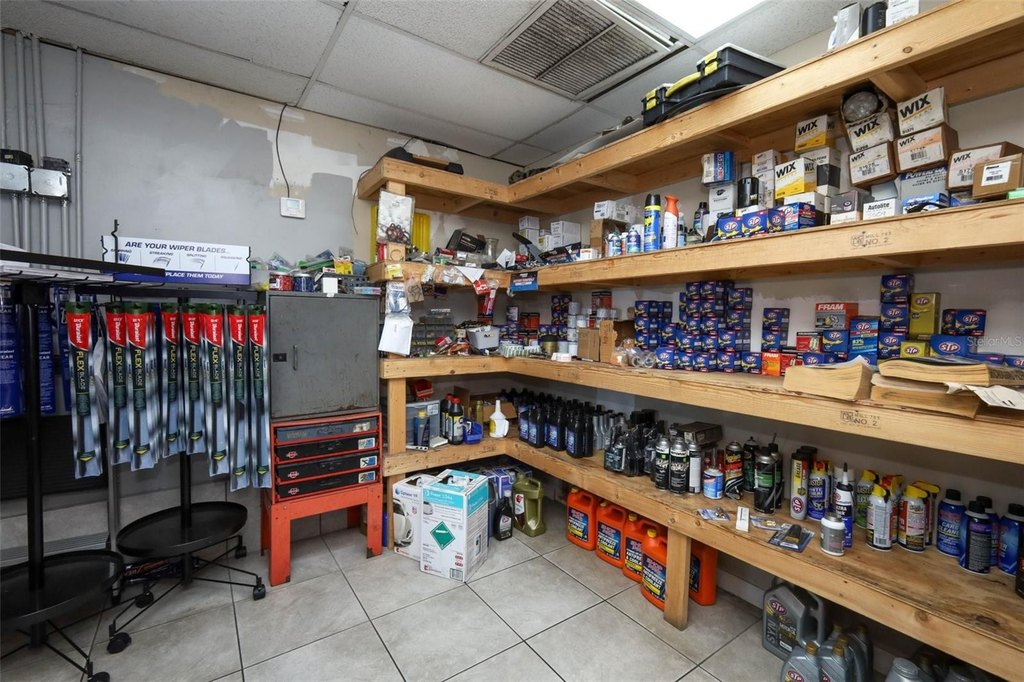
storage shed
Building Details
Year built
1978
Floors in Building
1
Flooring type
Concrete
Building materials
Metal Frame
Roof type
Tile
Listing Agency:
KELLER WILLIAMS ADVANTAGE REALTY · Keller Williams Realty
(407) 977-7600
Listed By:
Christopher Groomes · License #3299893
(352) 223-3710
Added: Mar 2
Changed: Oct 7
Last Checked: Oct 10 at 4:06AM
MLS# O6386916
Copyright © 2026 Stellar MLS. All rights reserved. All information provided by the listing agent/broker is deemed reliable but is not guaranteed and should be independently verified.
Investment Insights
Based on property information with market context.
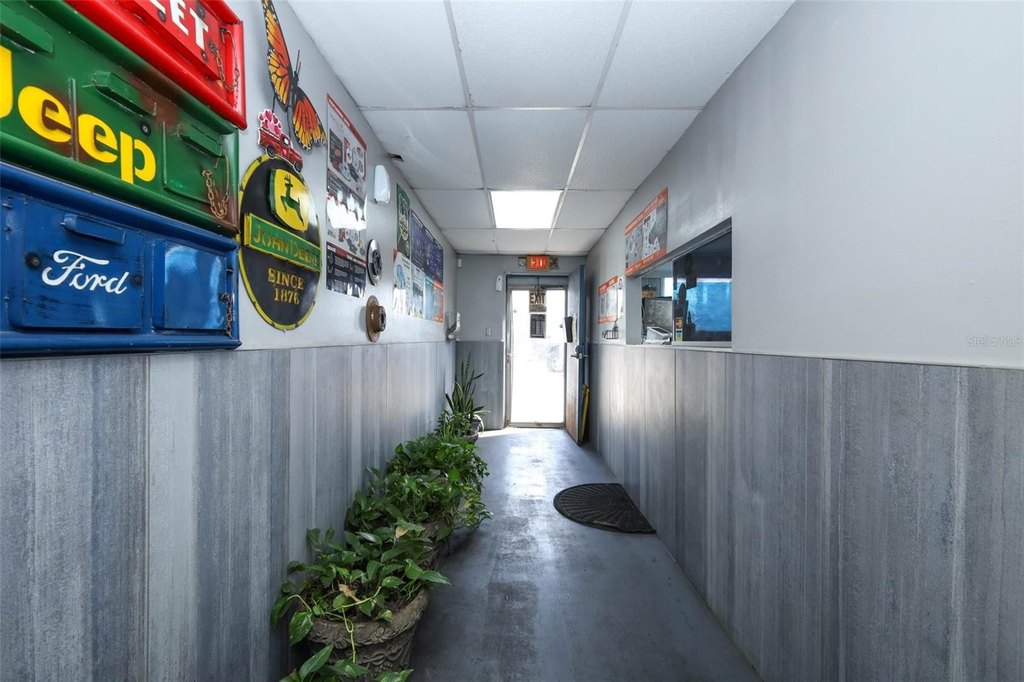
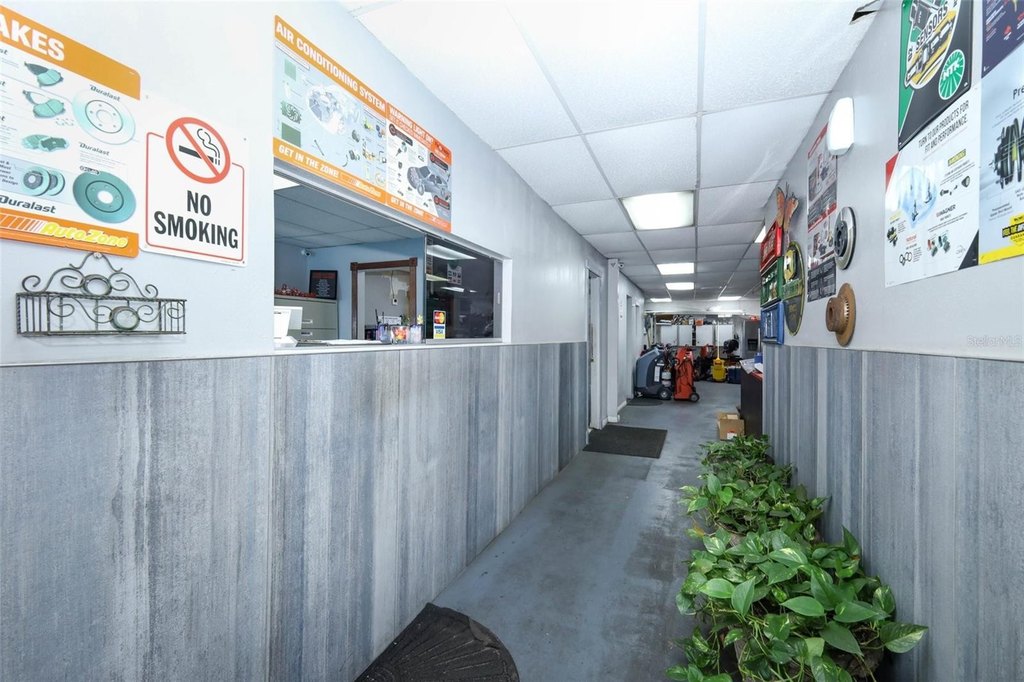
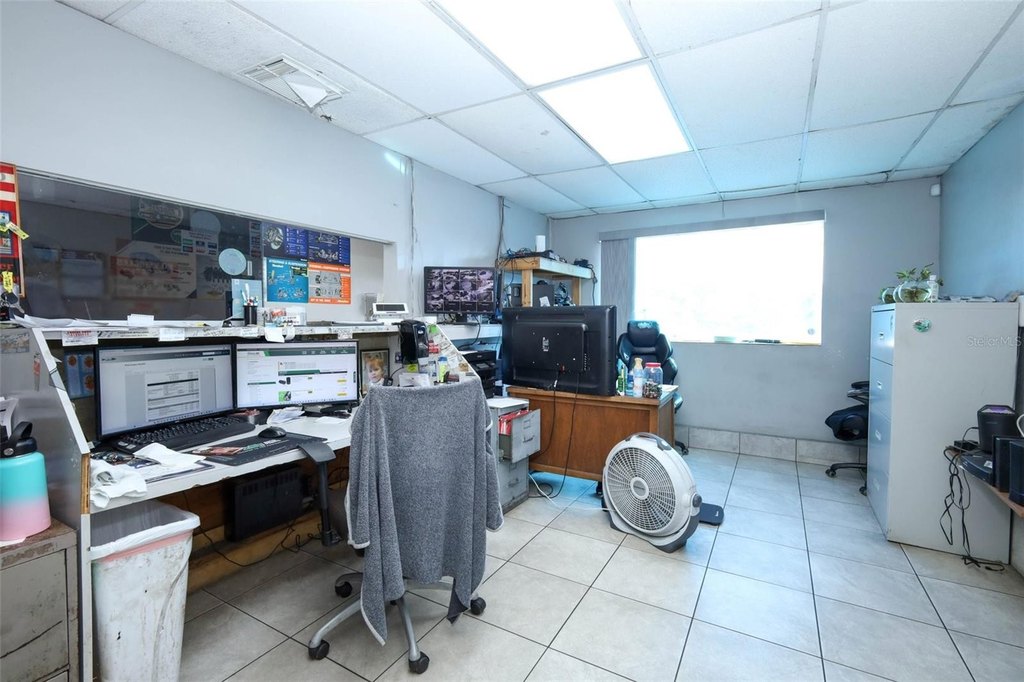
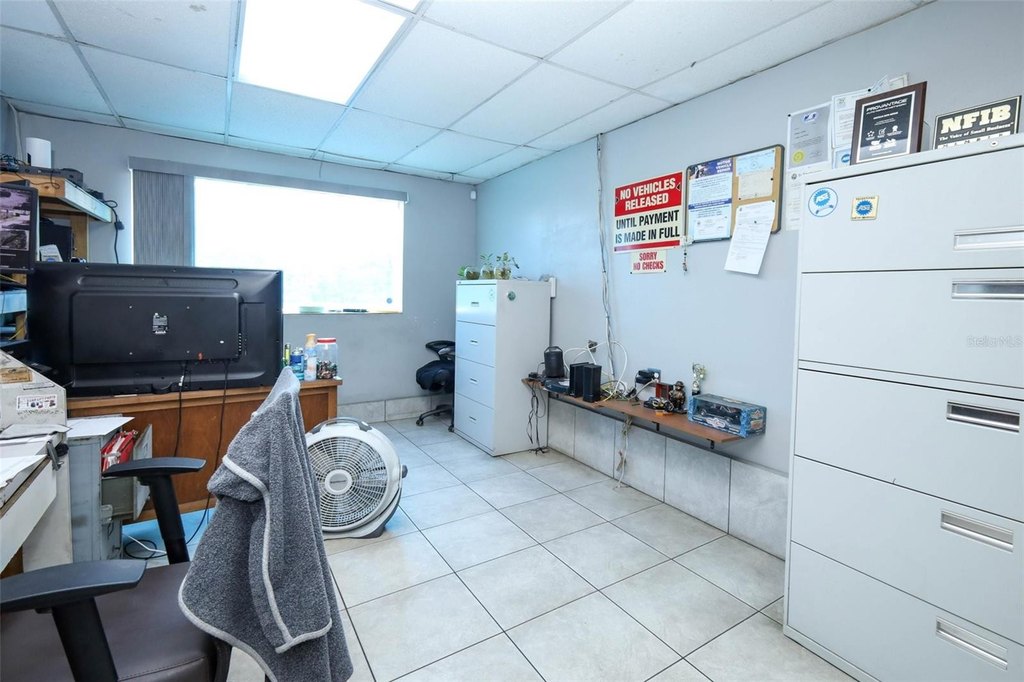
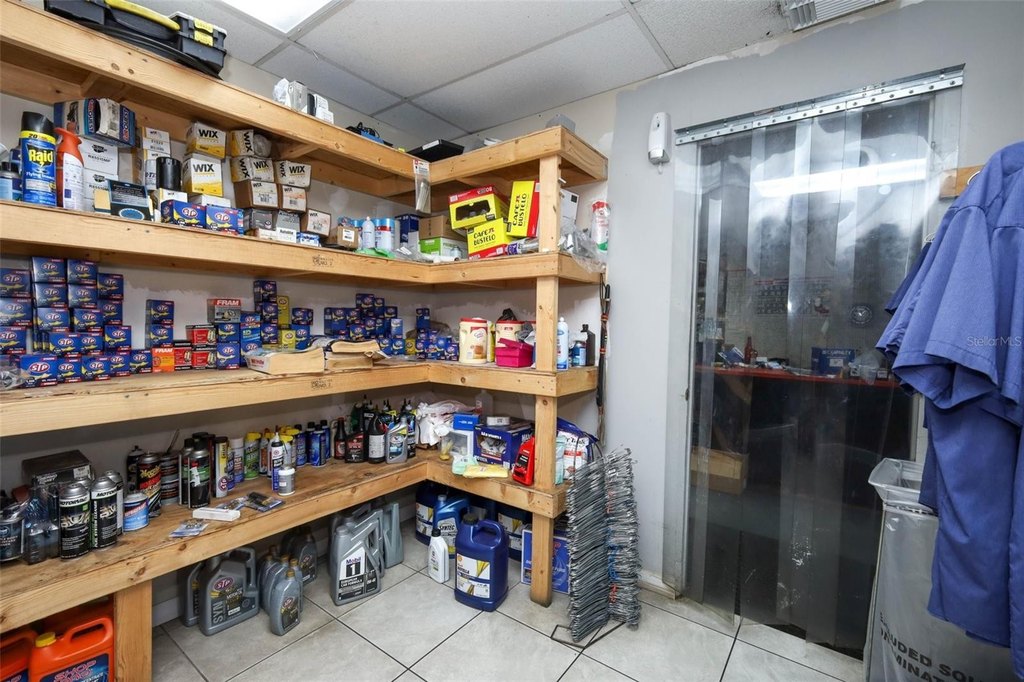
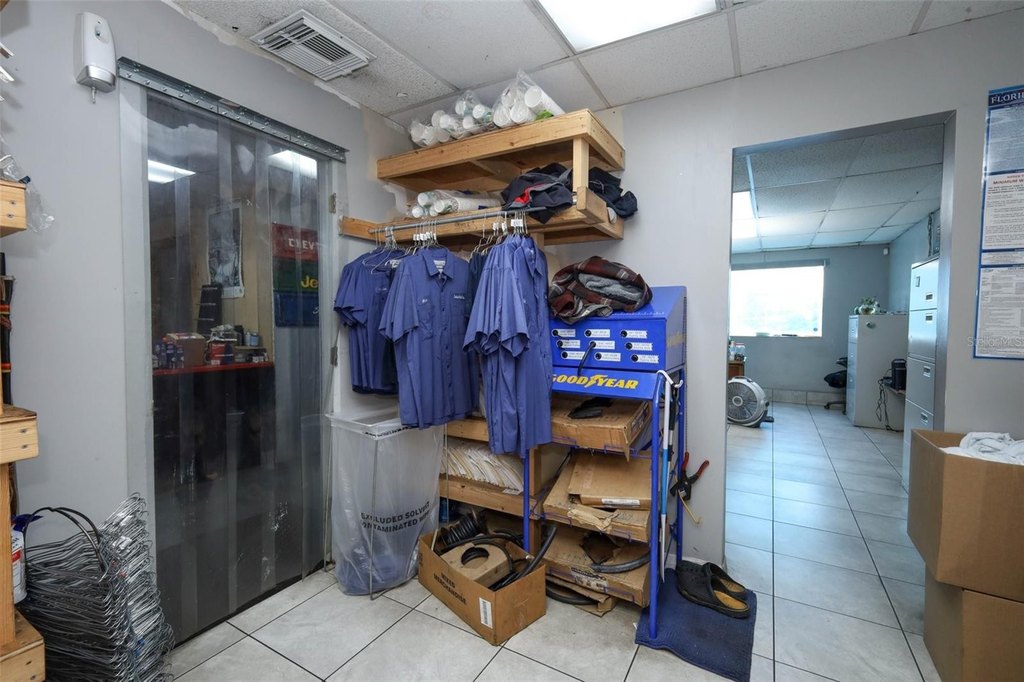
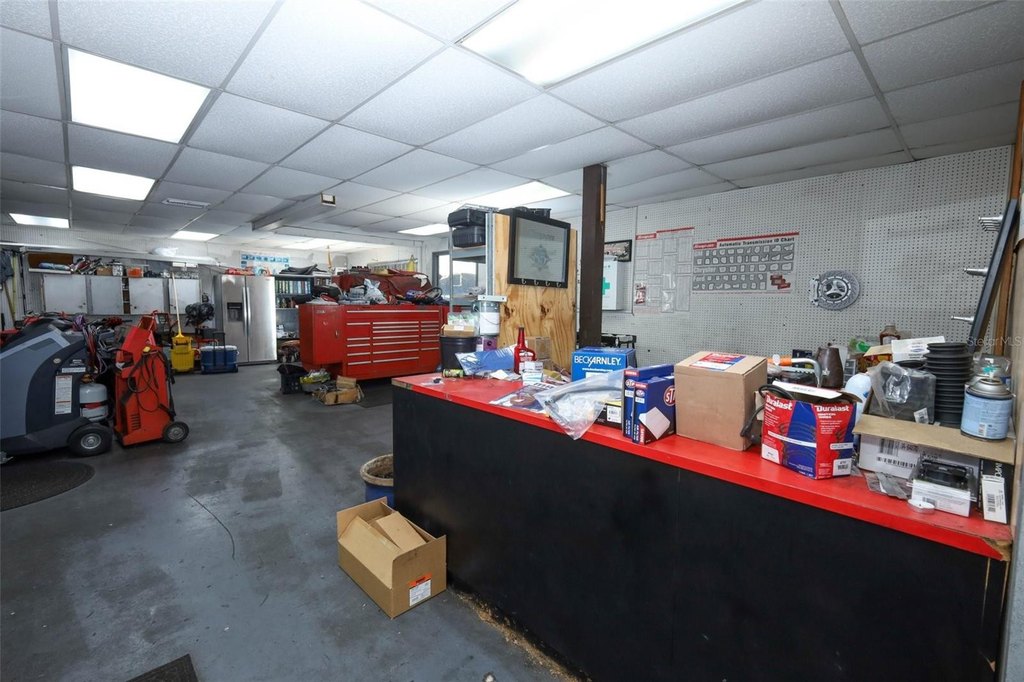
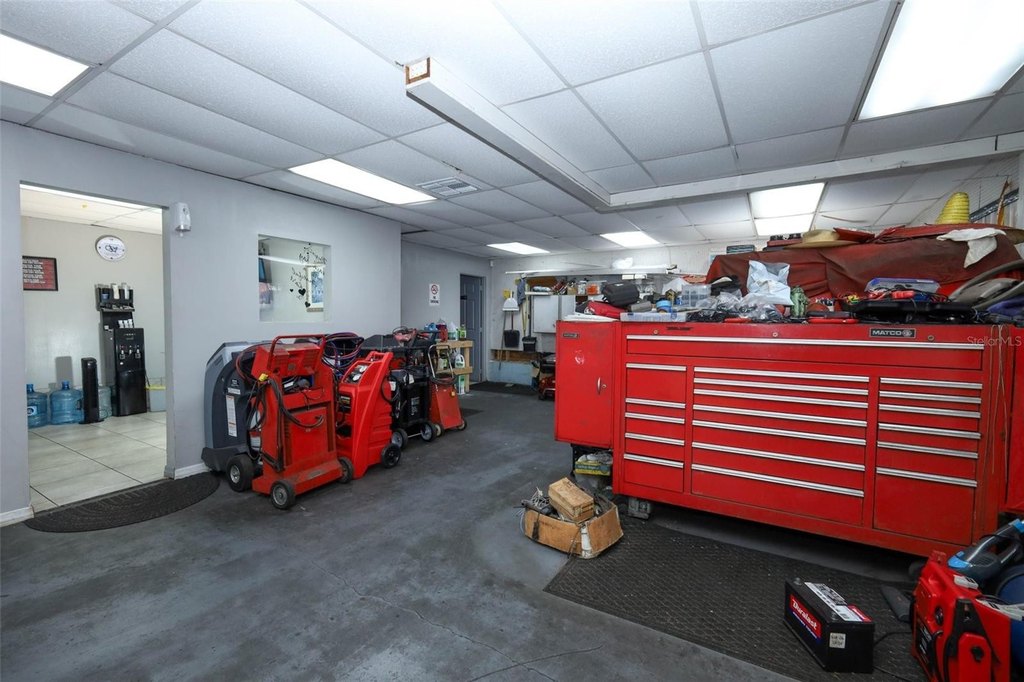
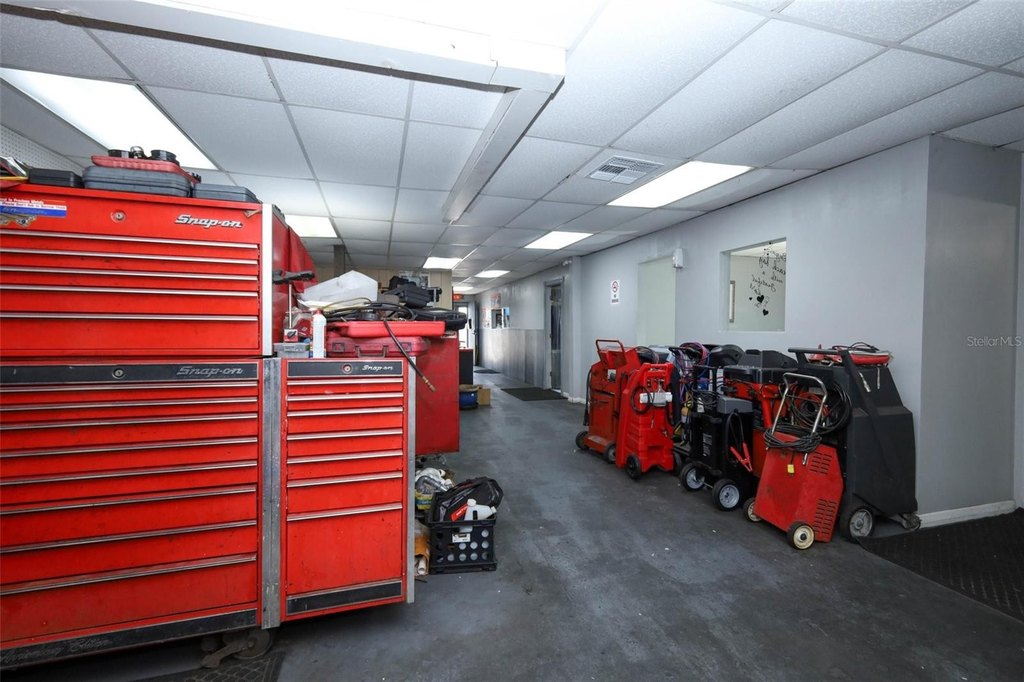
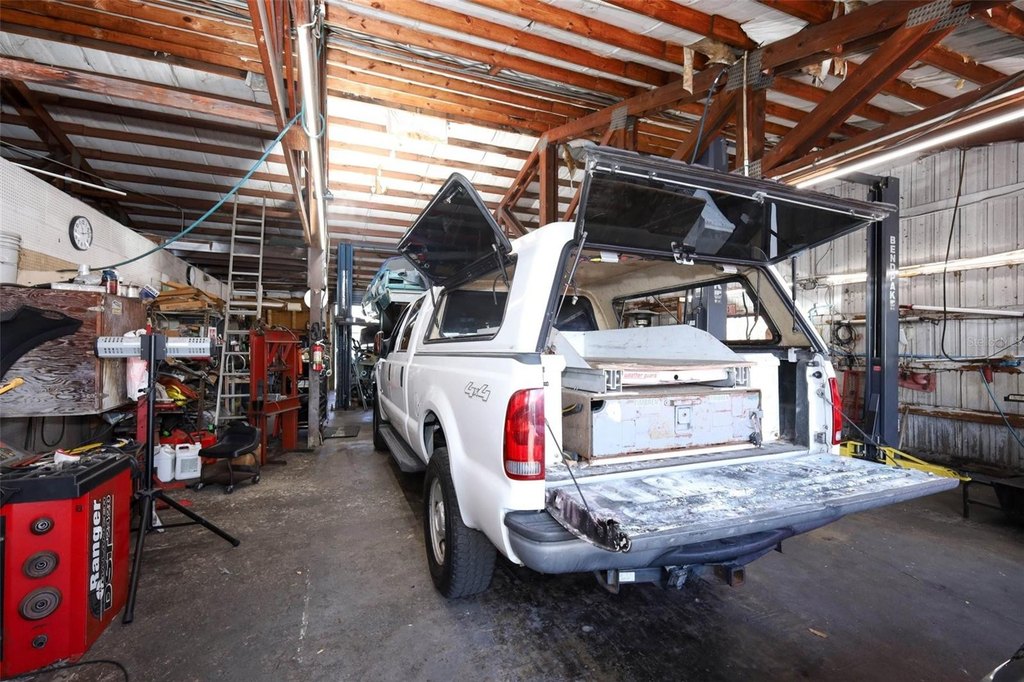
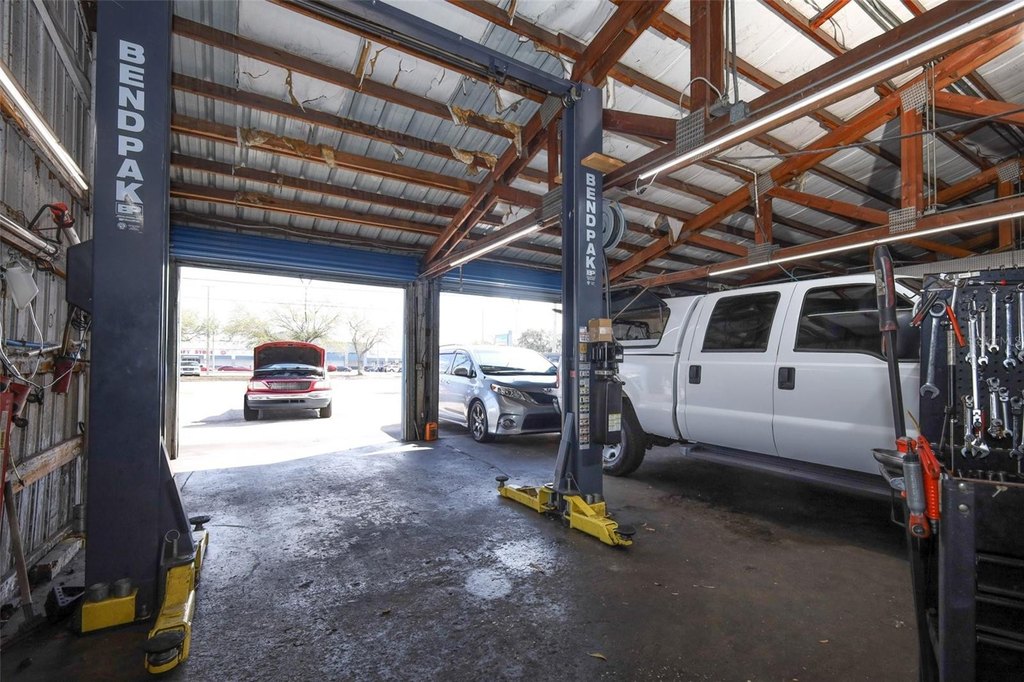
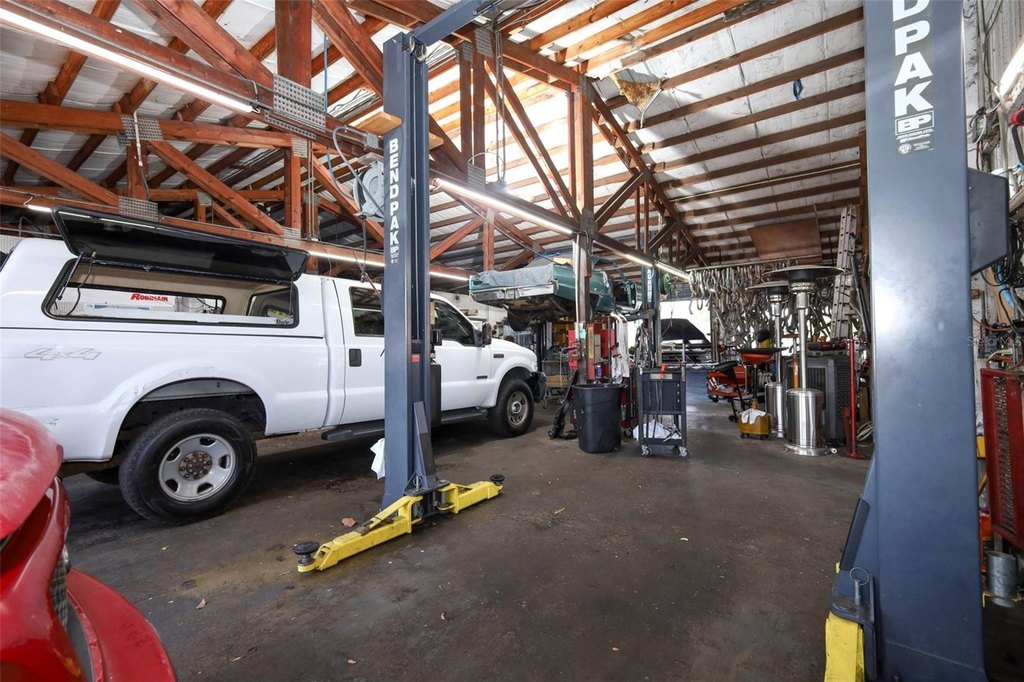
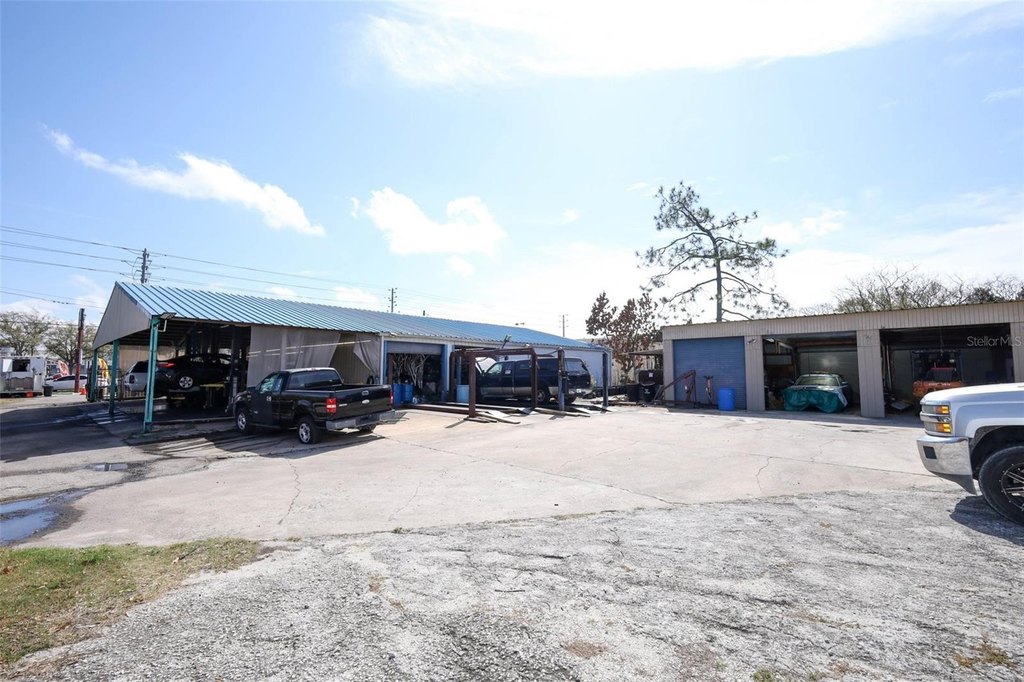
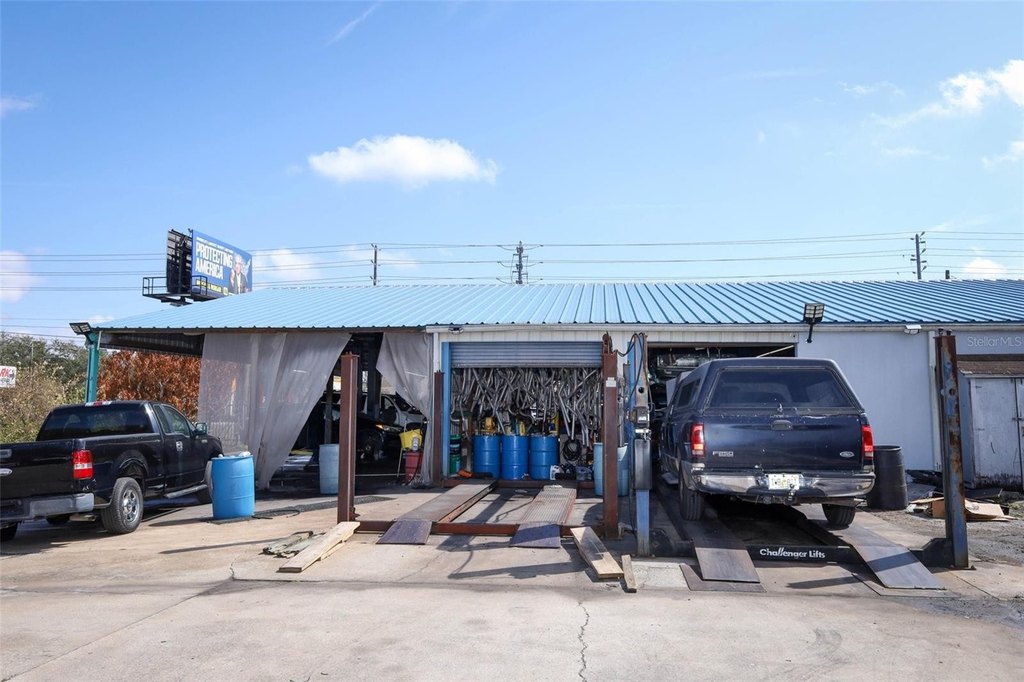
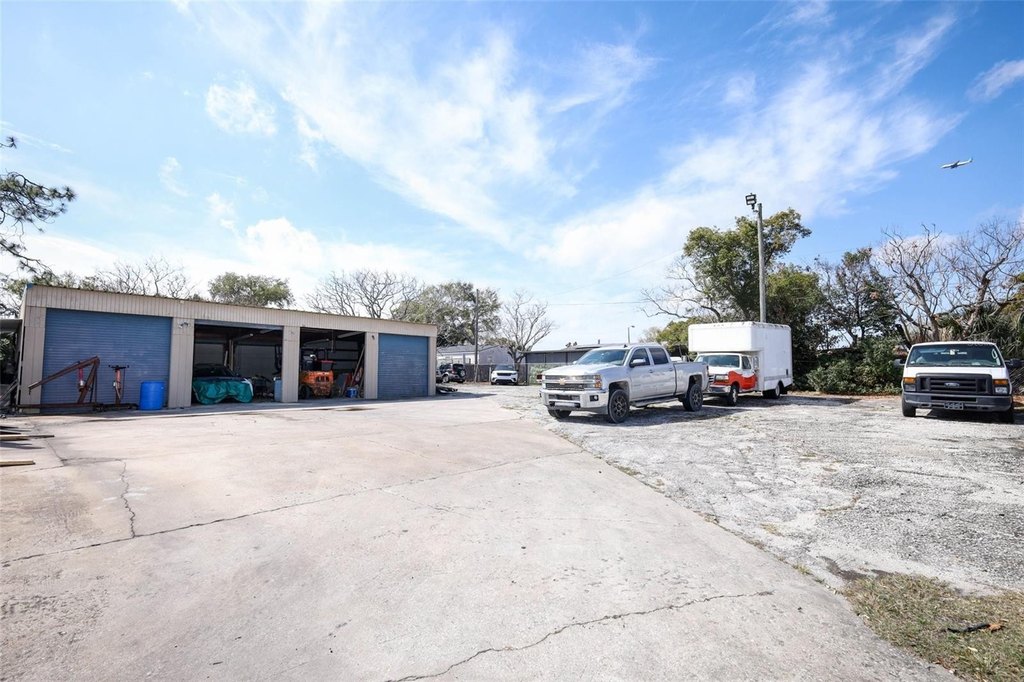
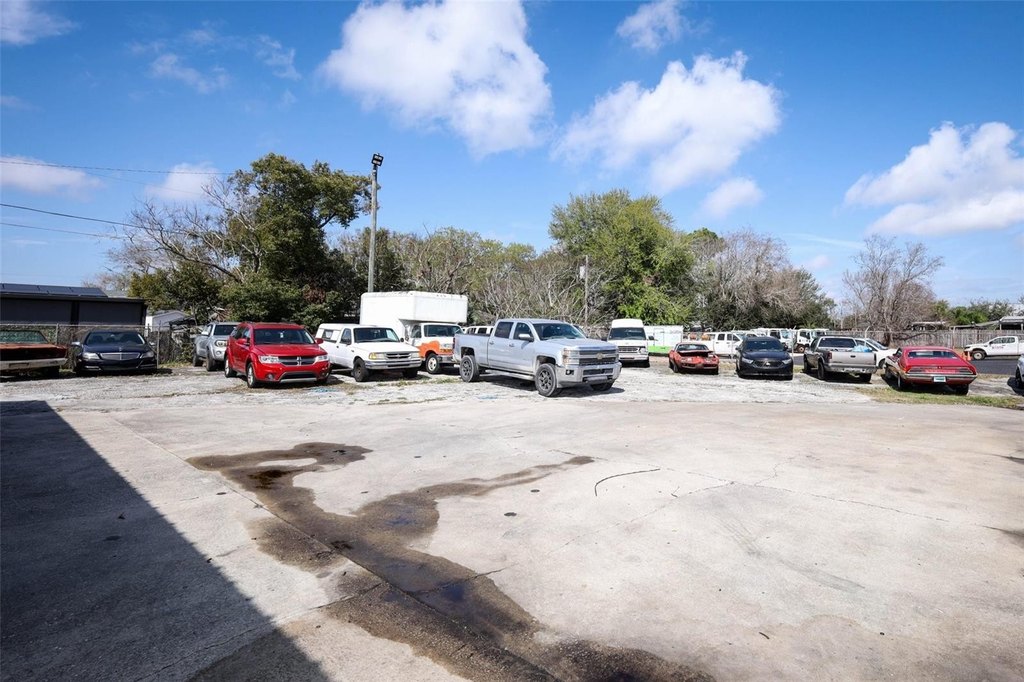
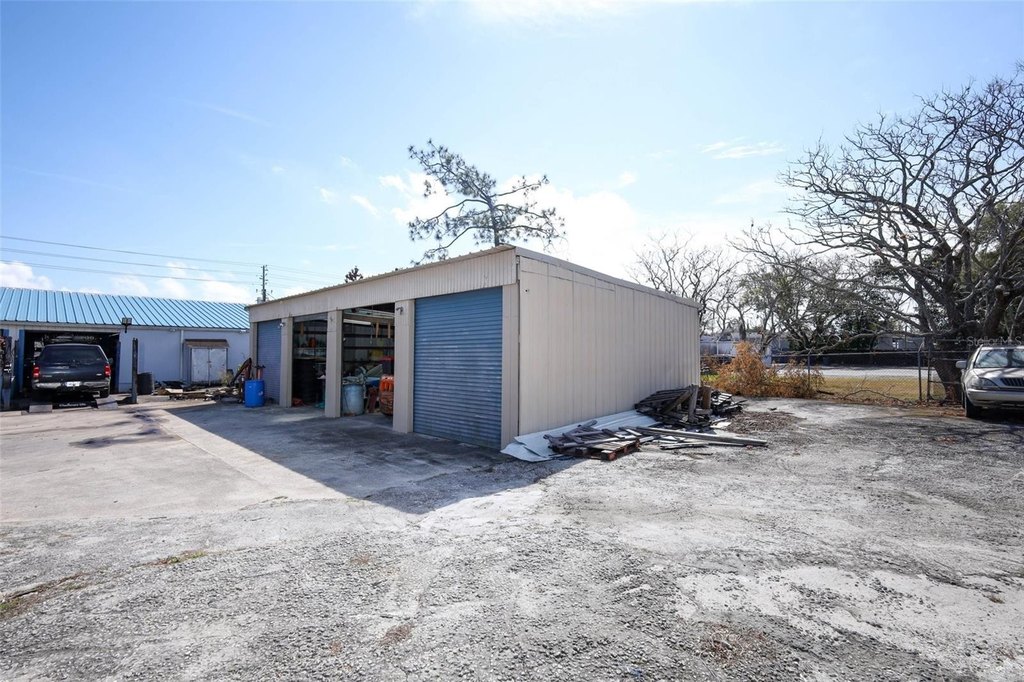
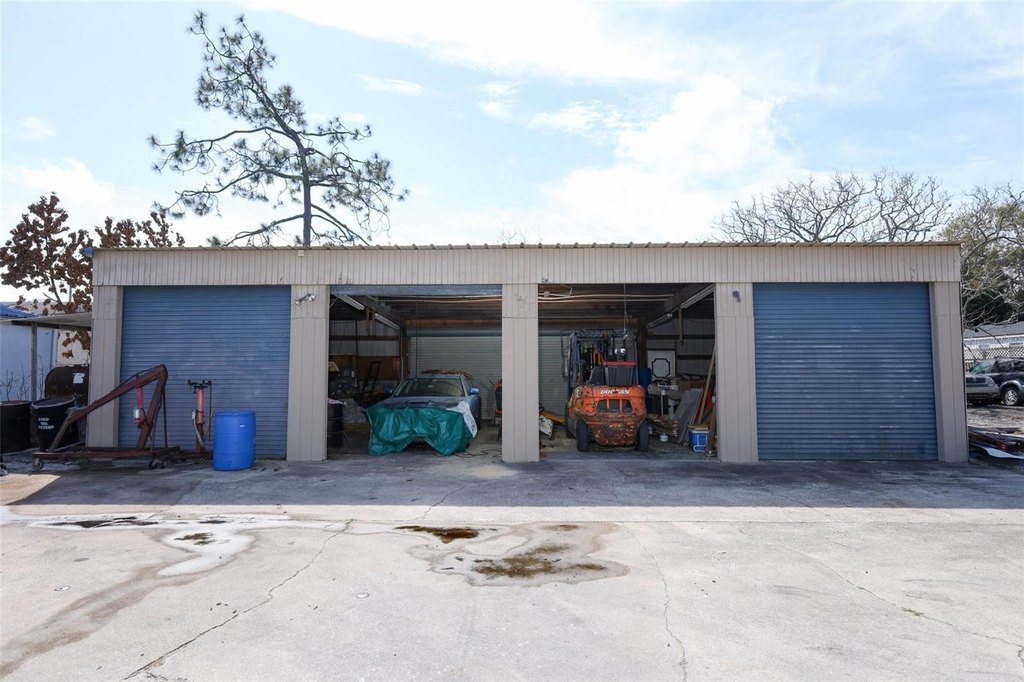
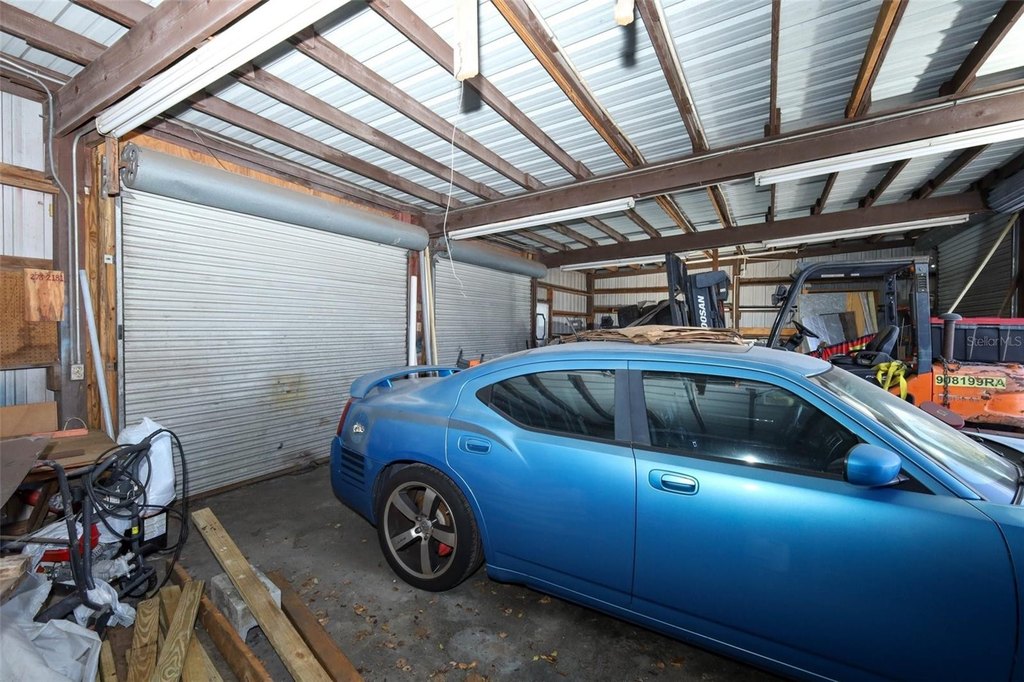
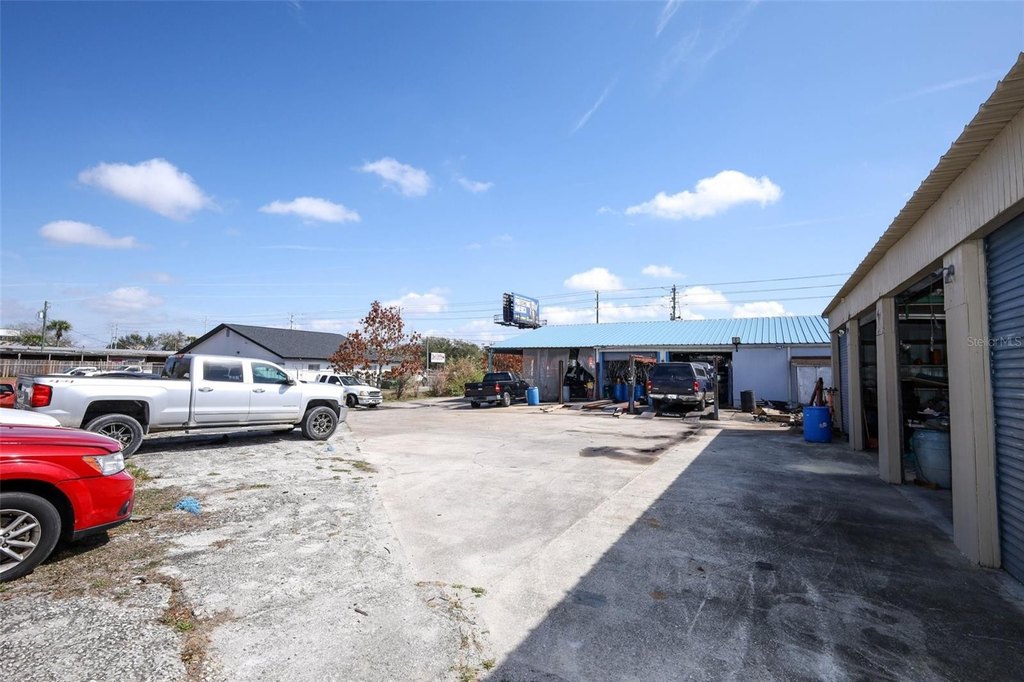
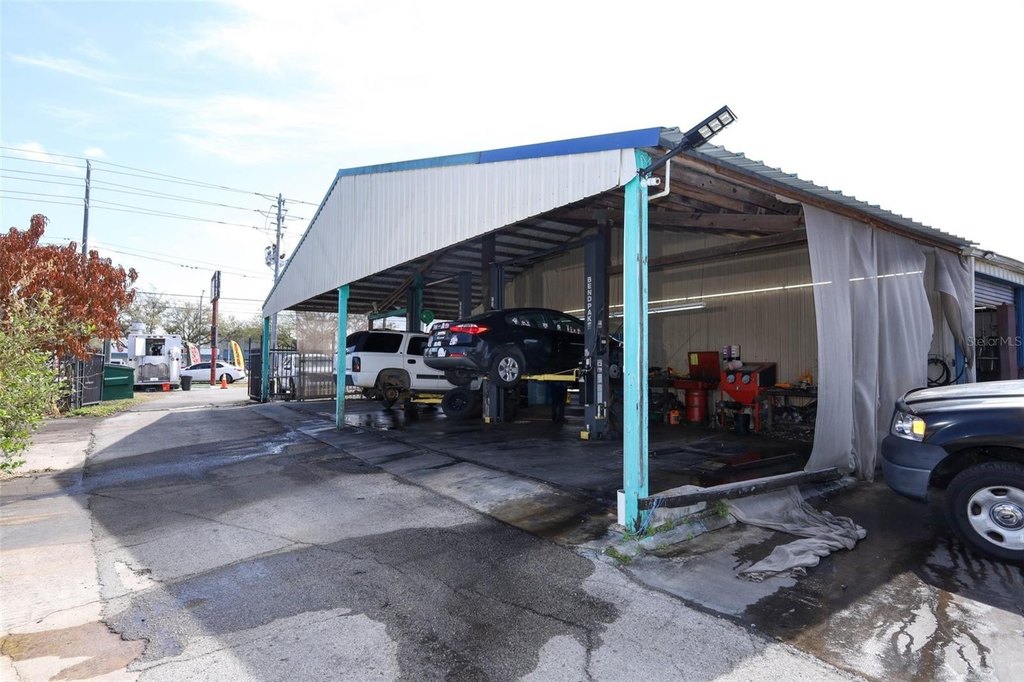
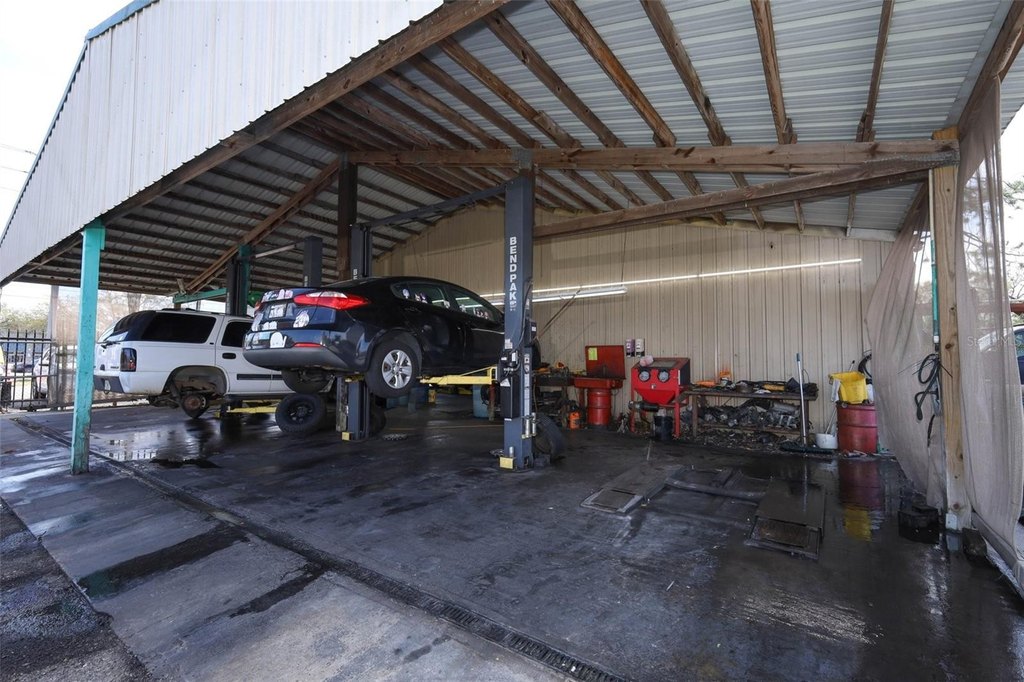
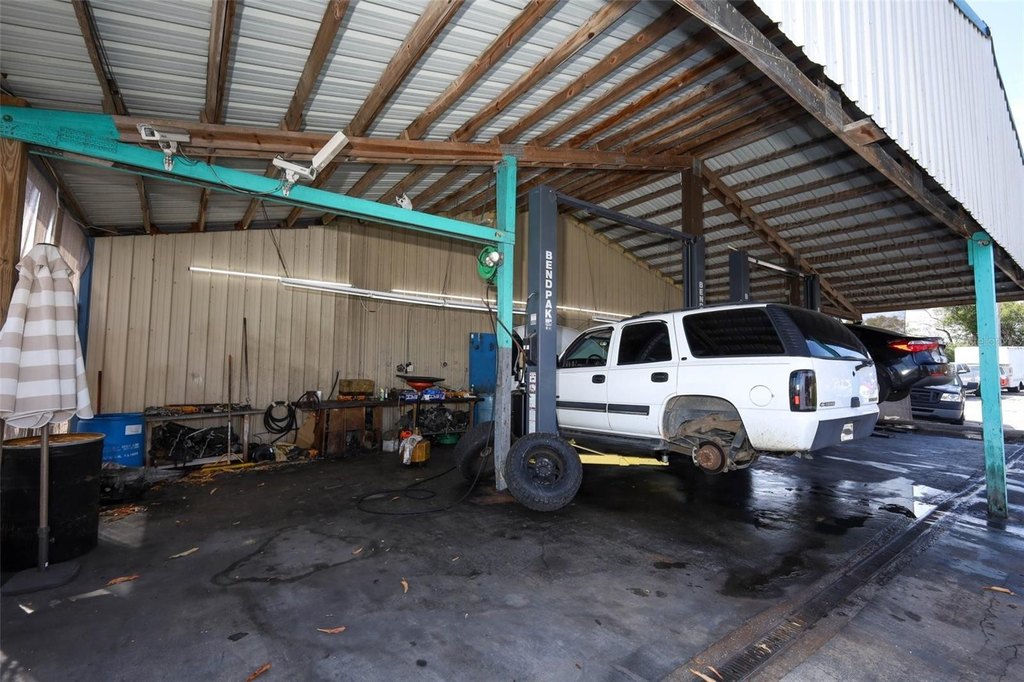
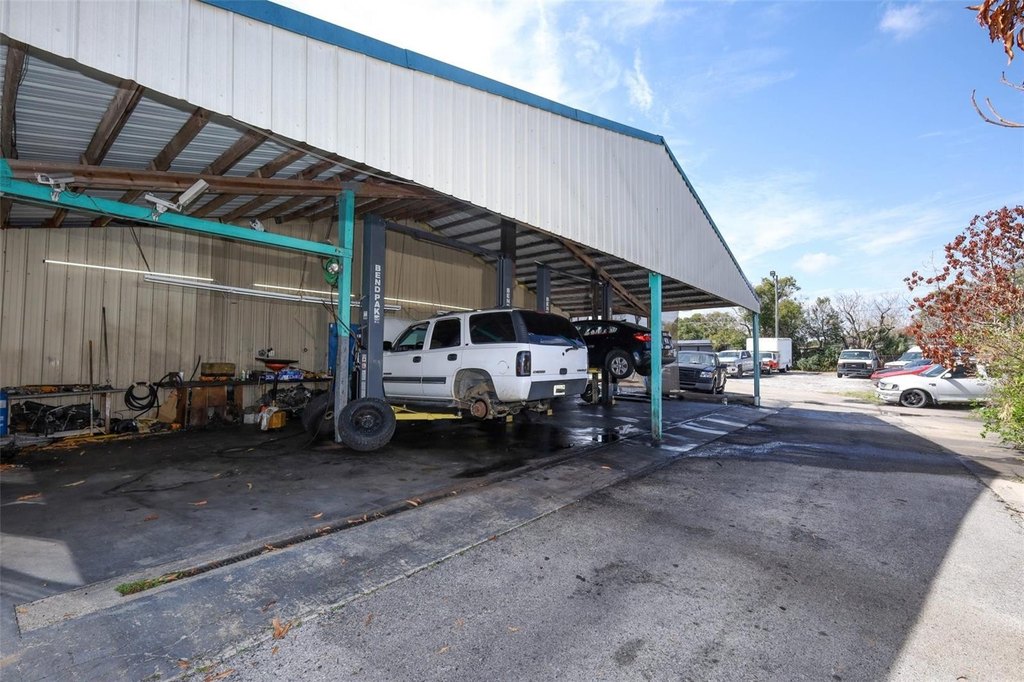
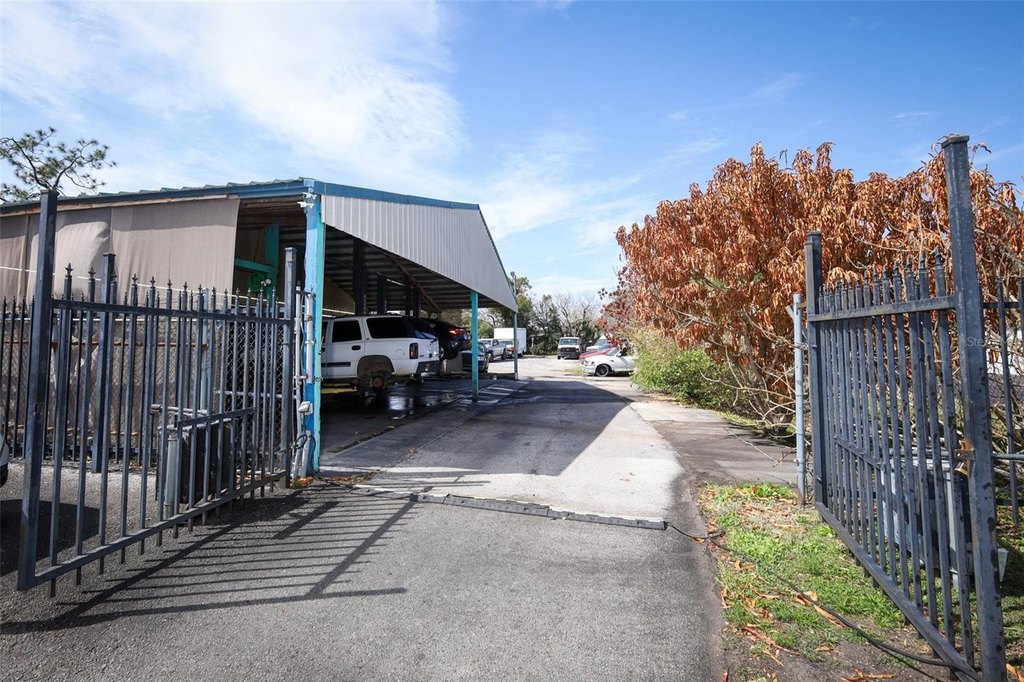
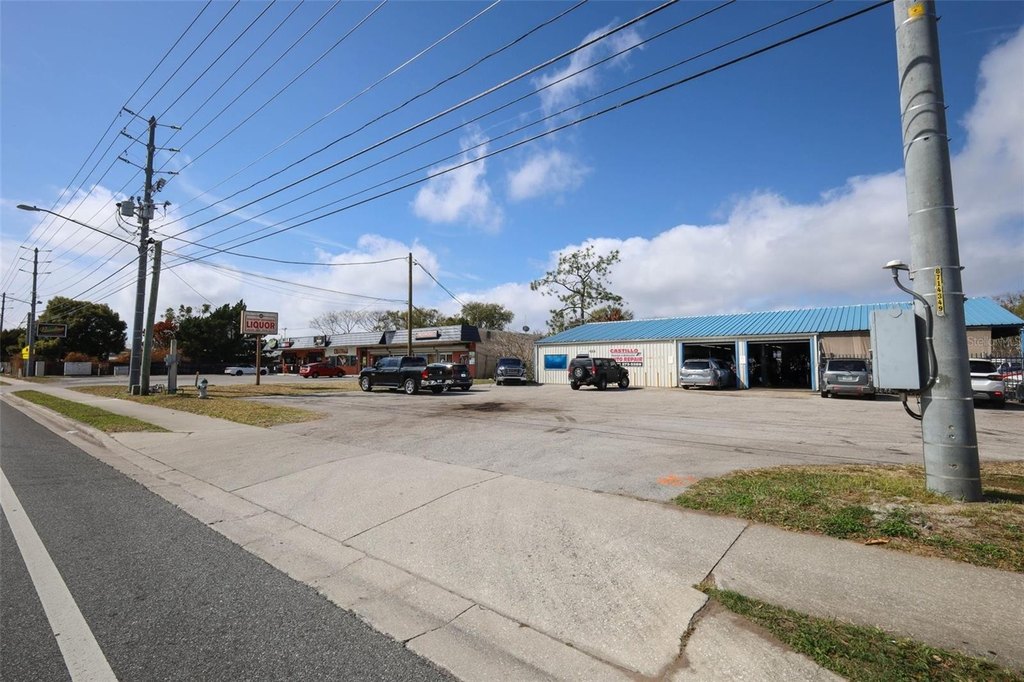
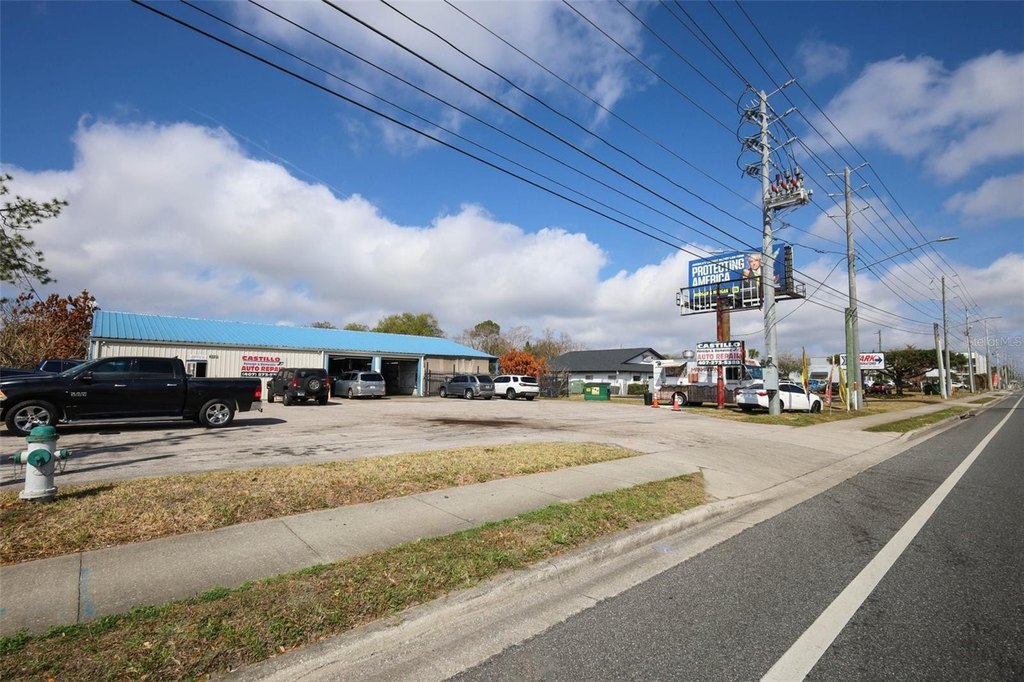
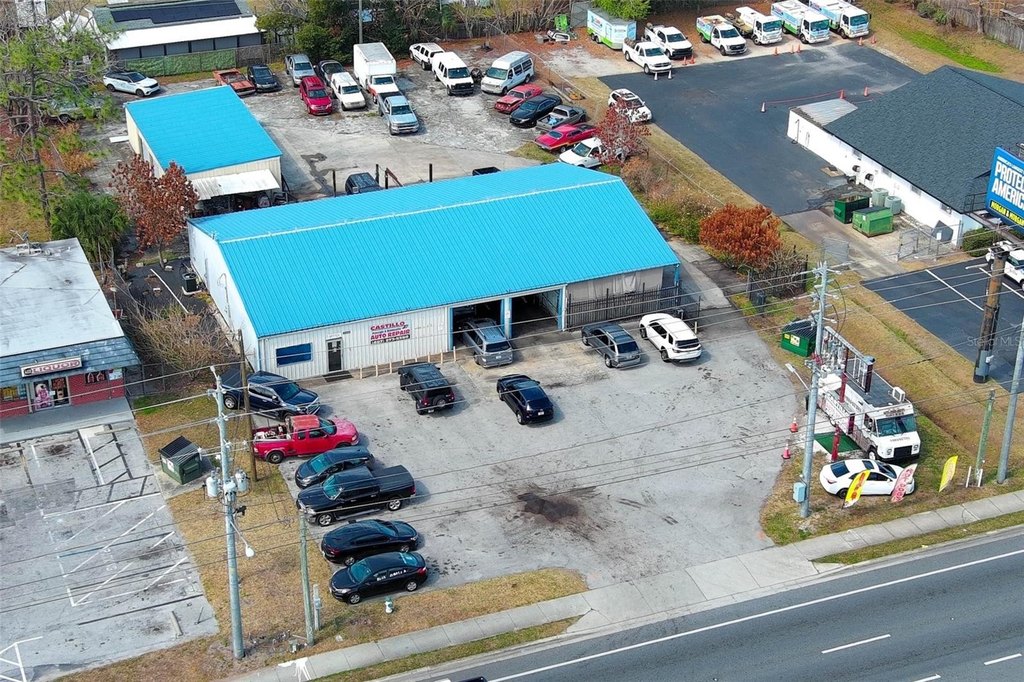
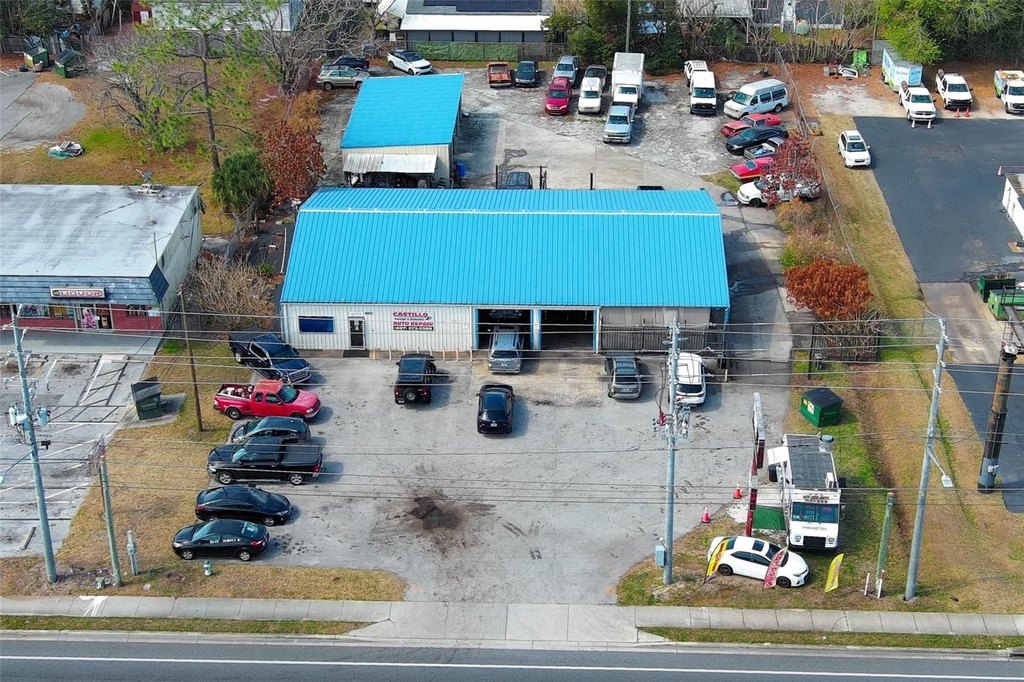
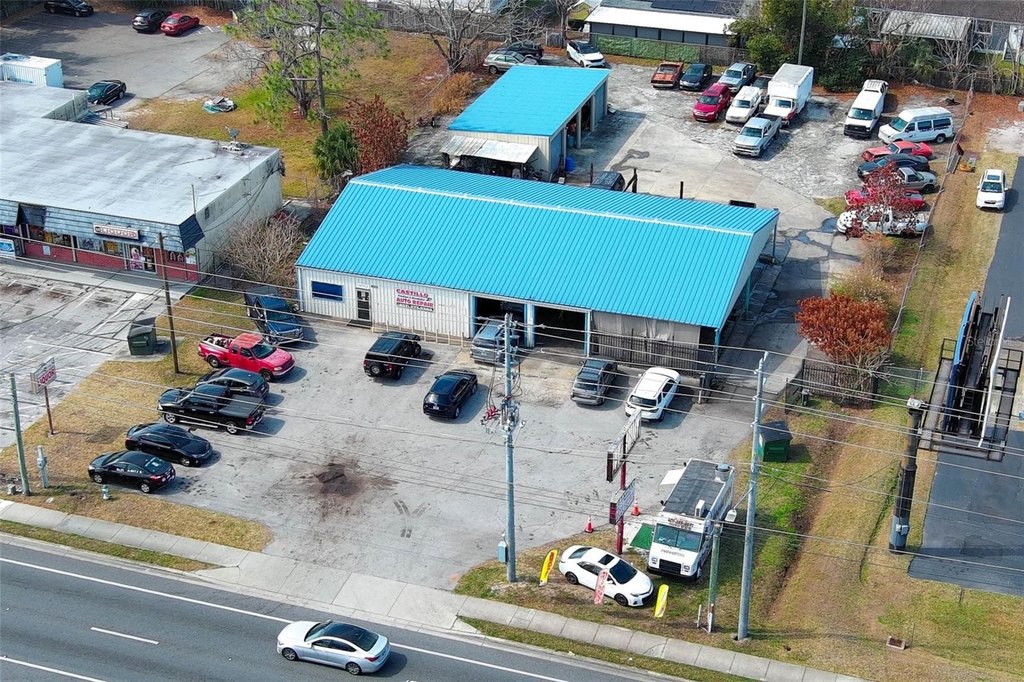
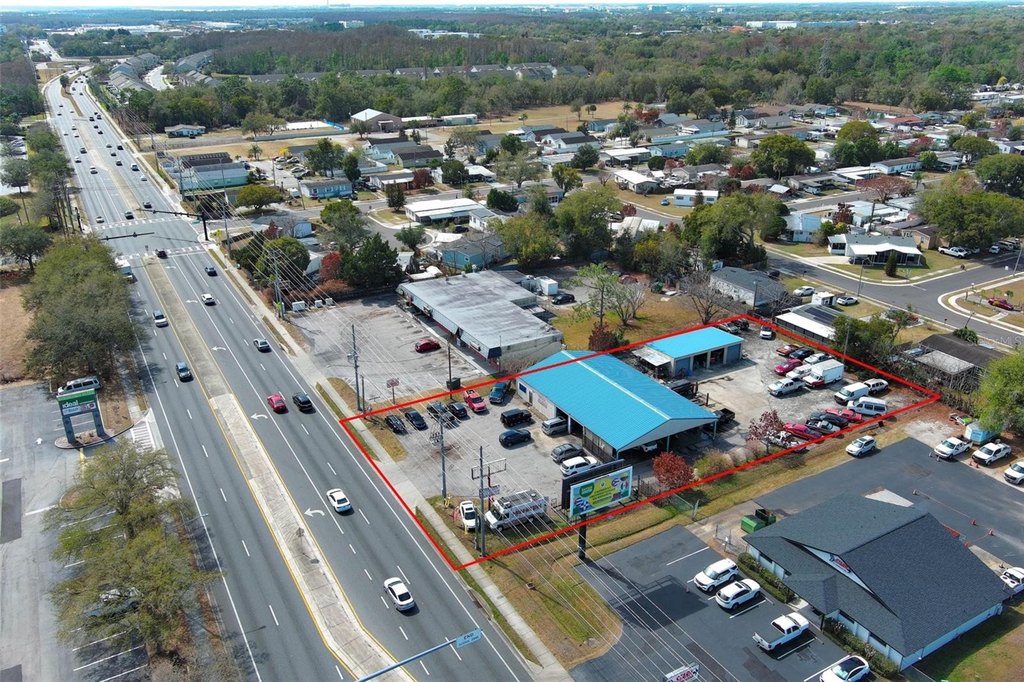
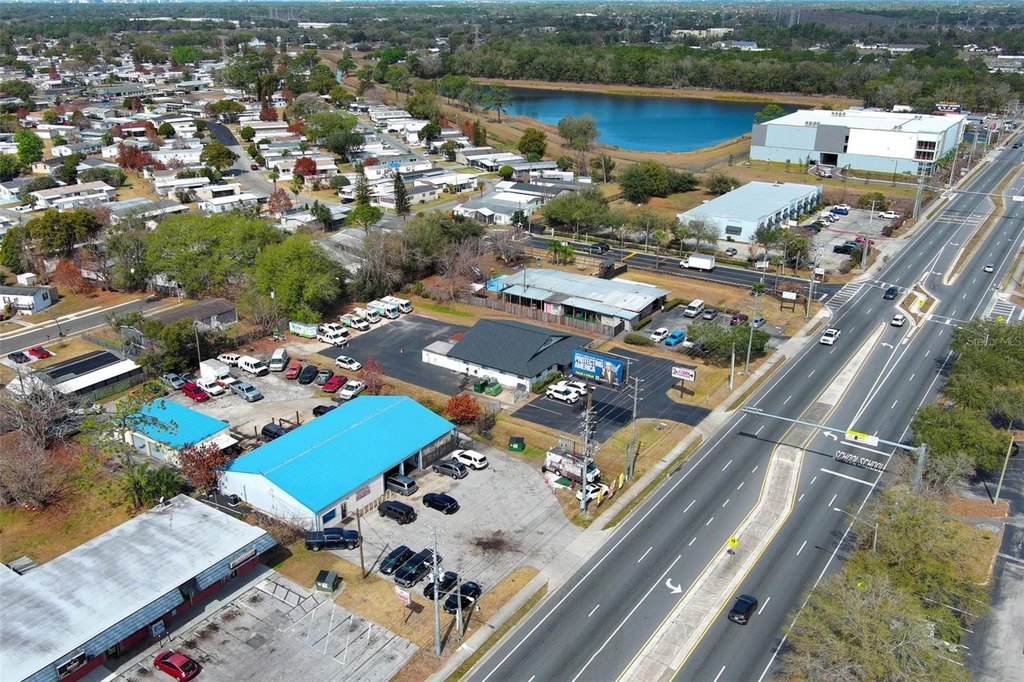
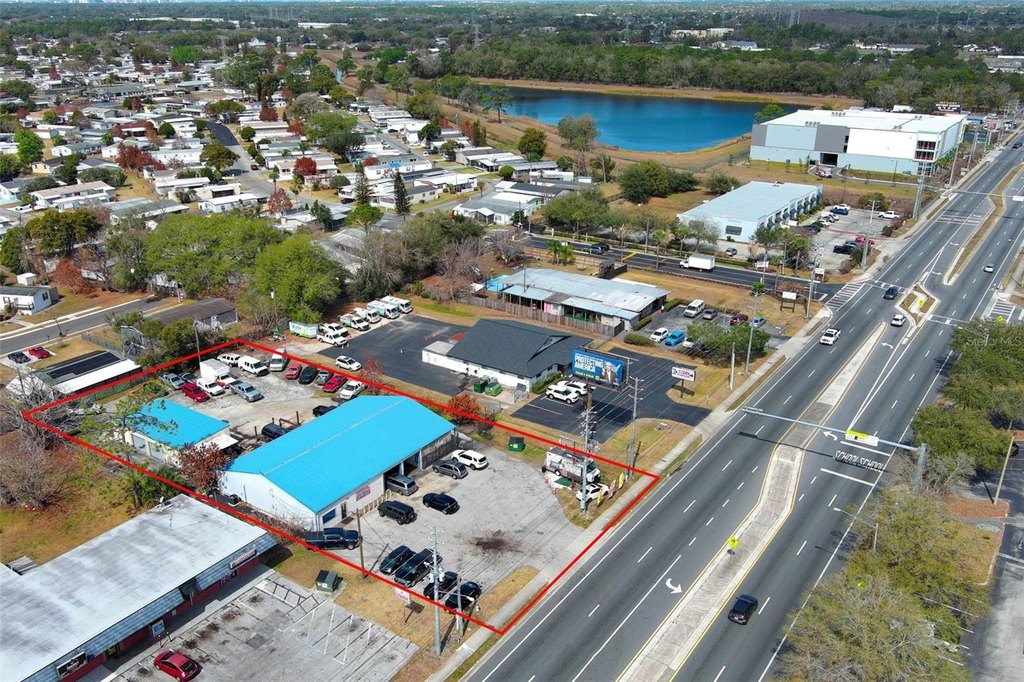
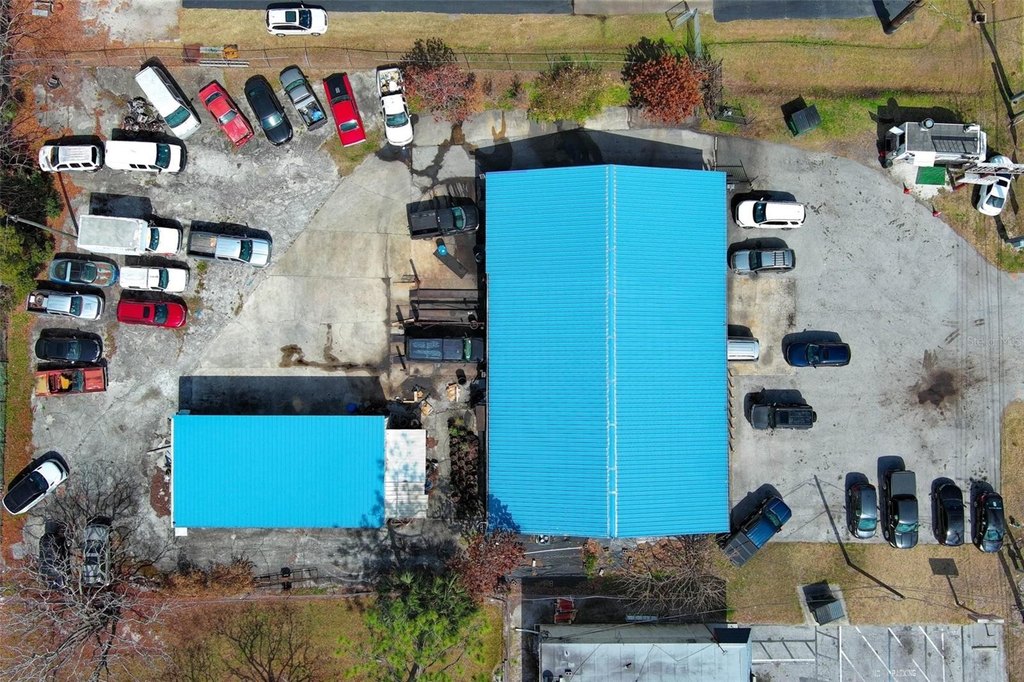
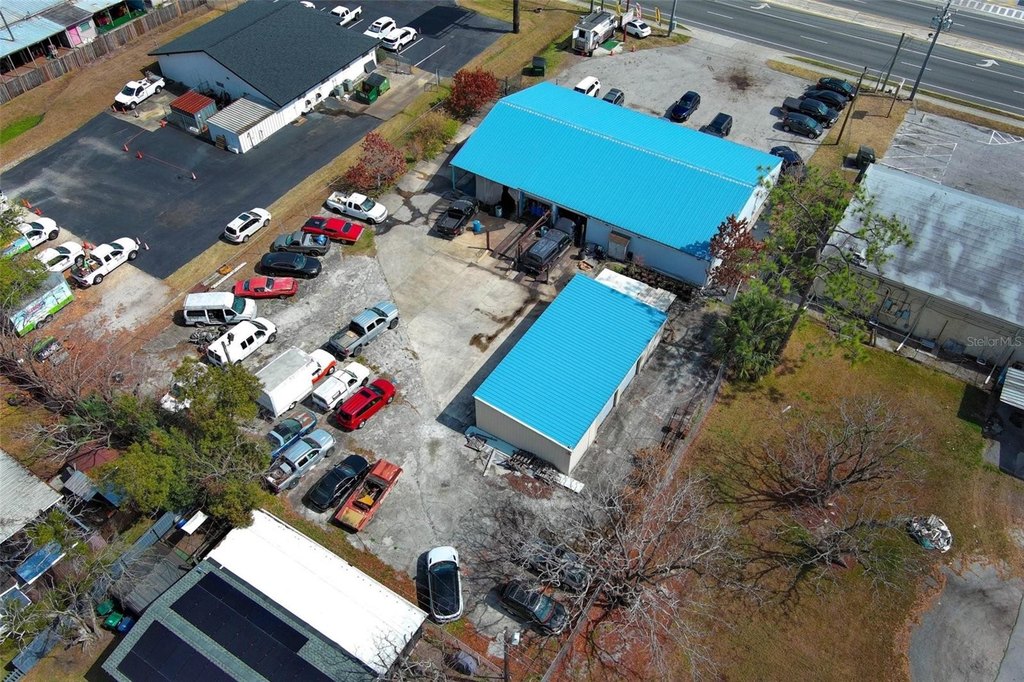
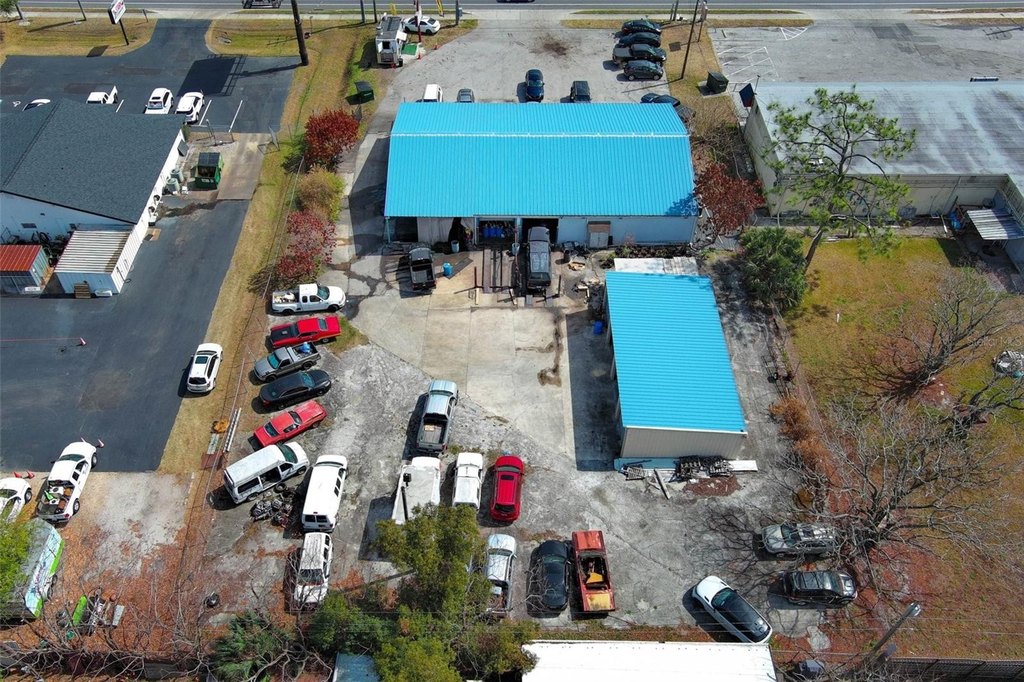
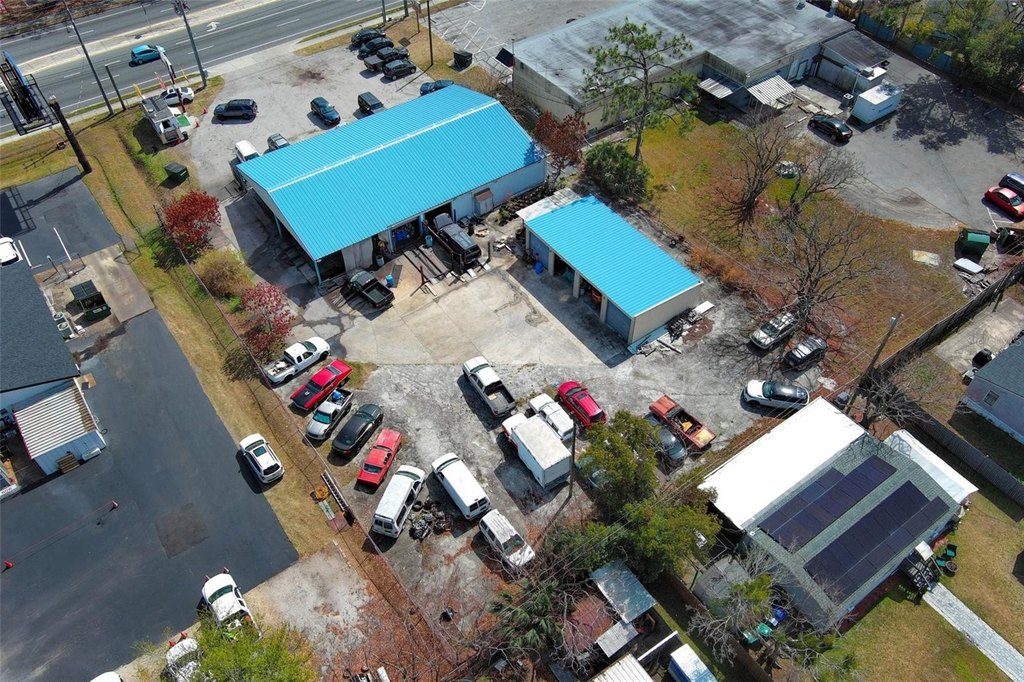
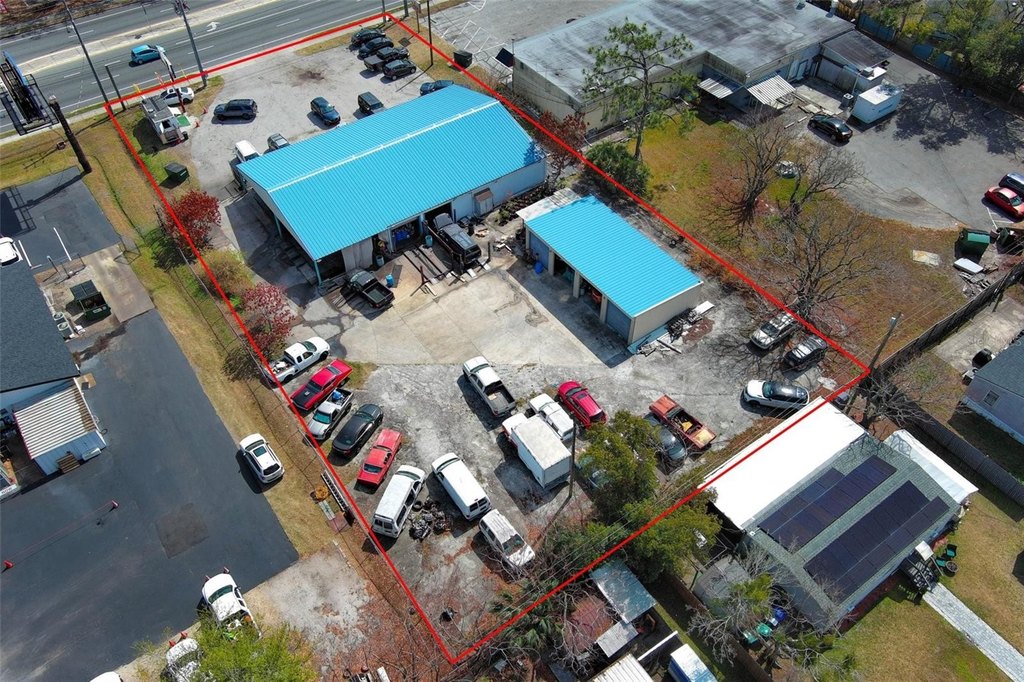
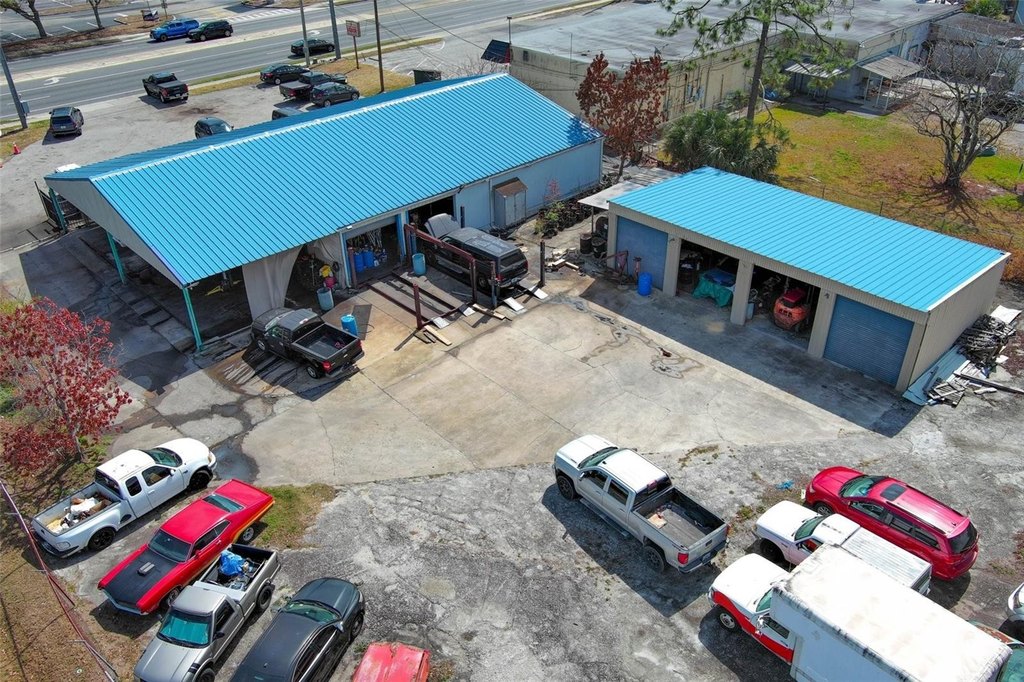
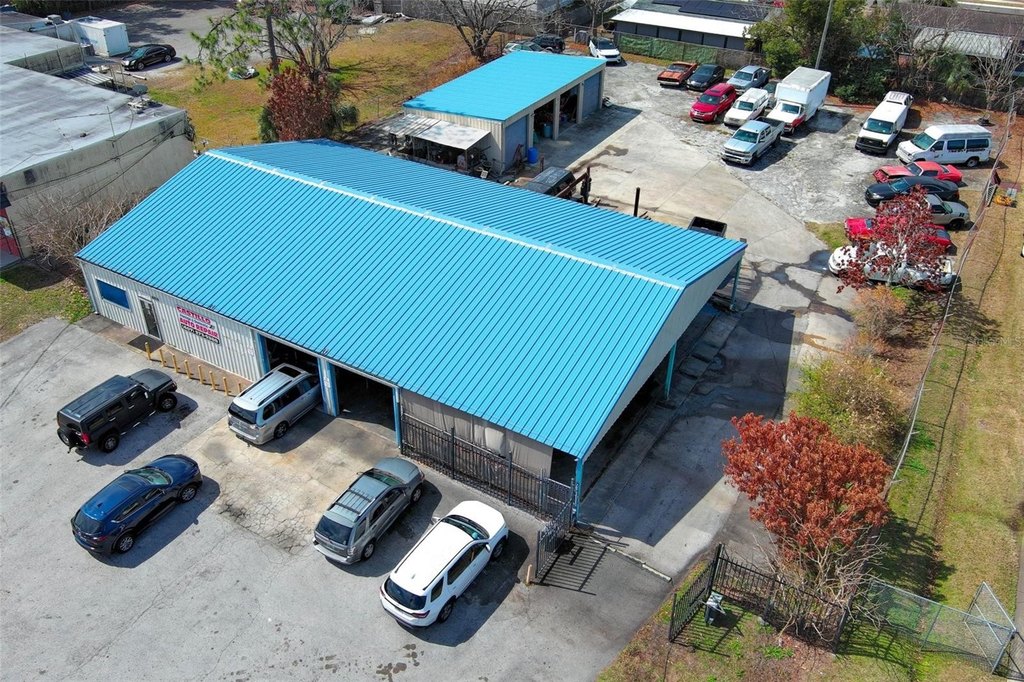
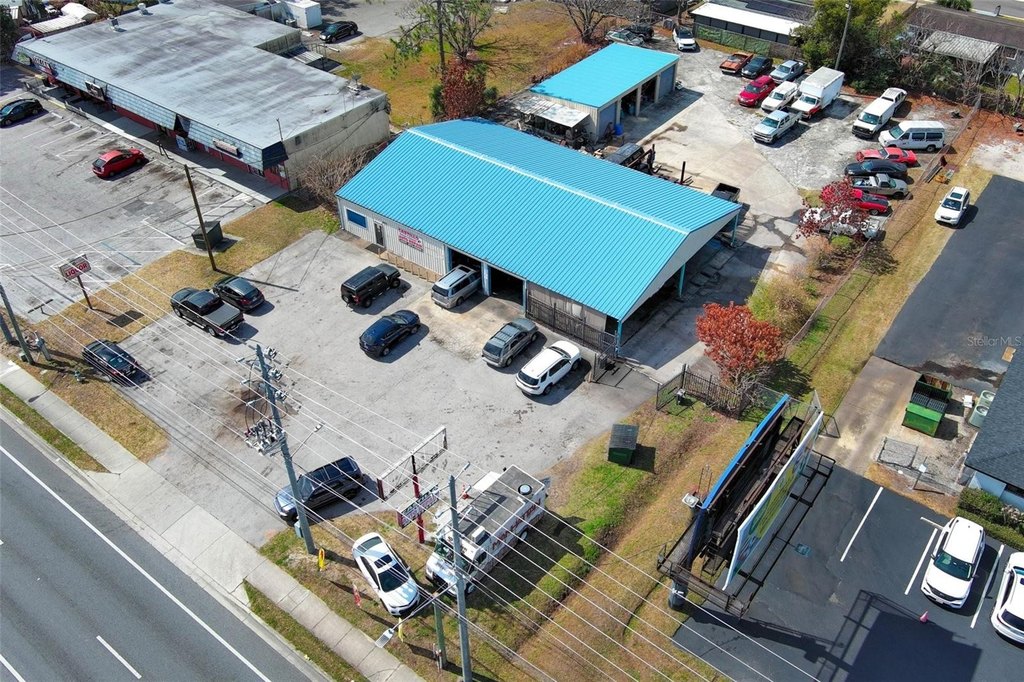
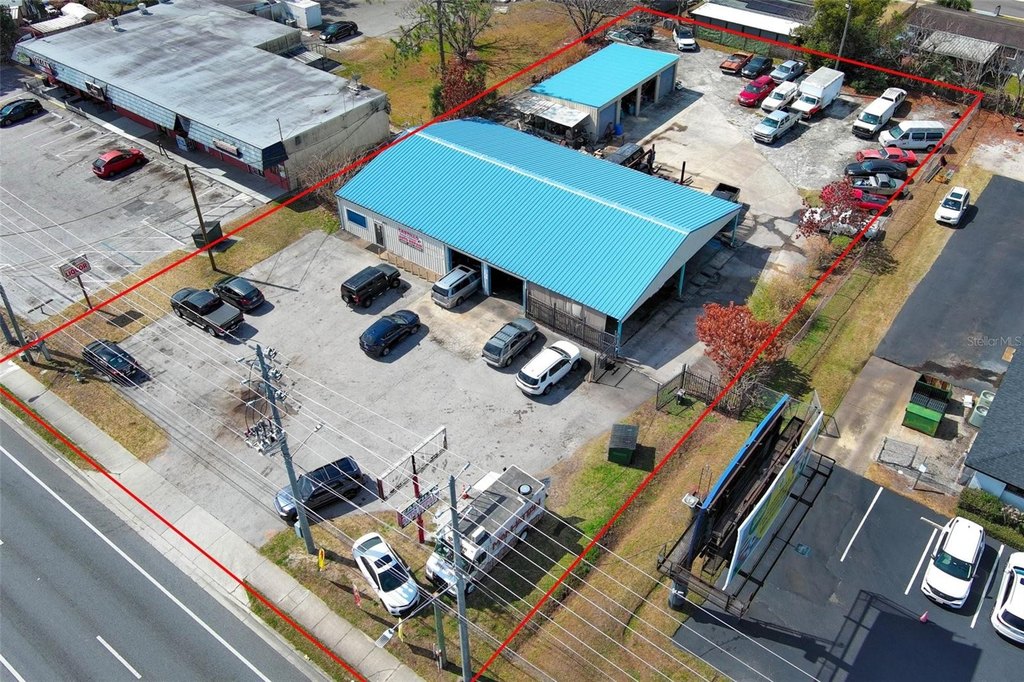
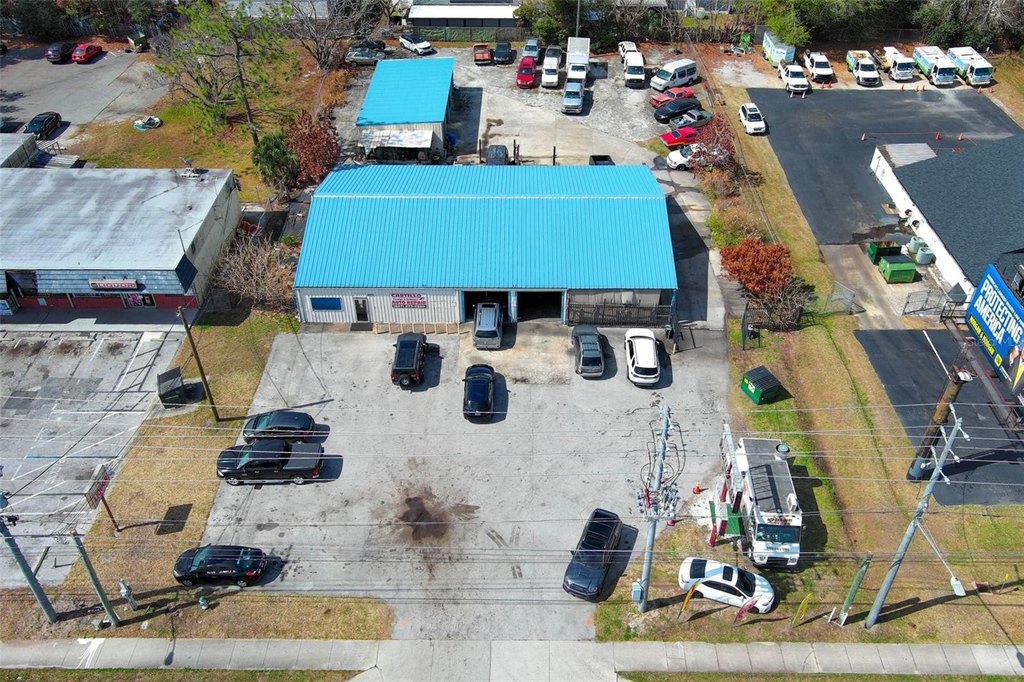
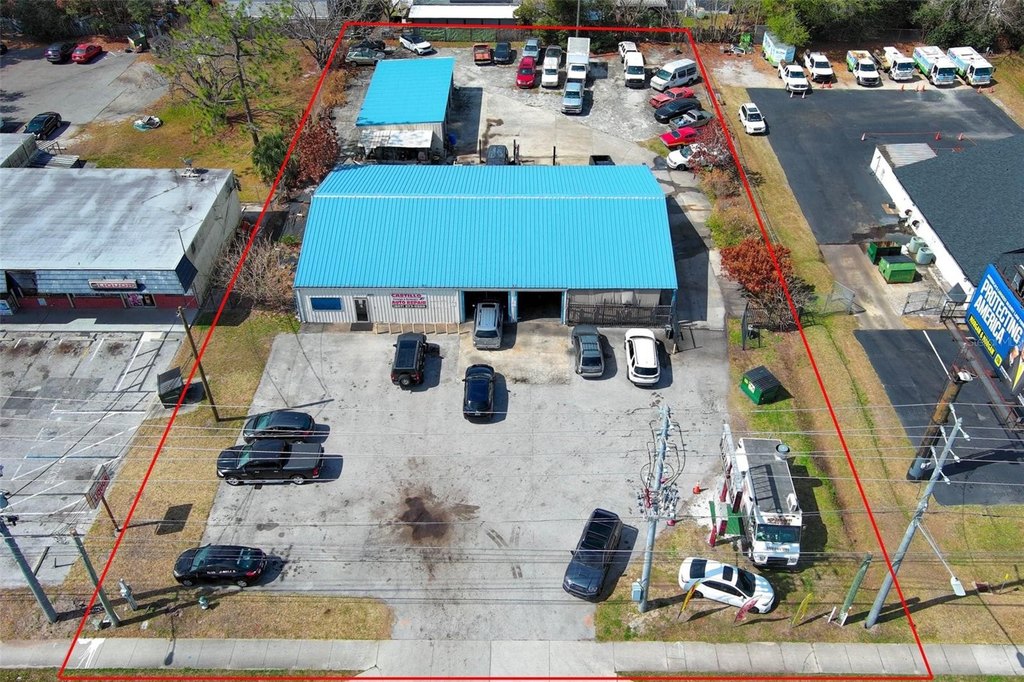
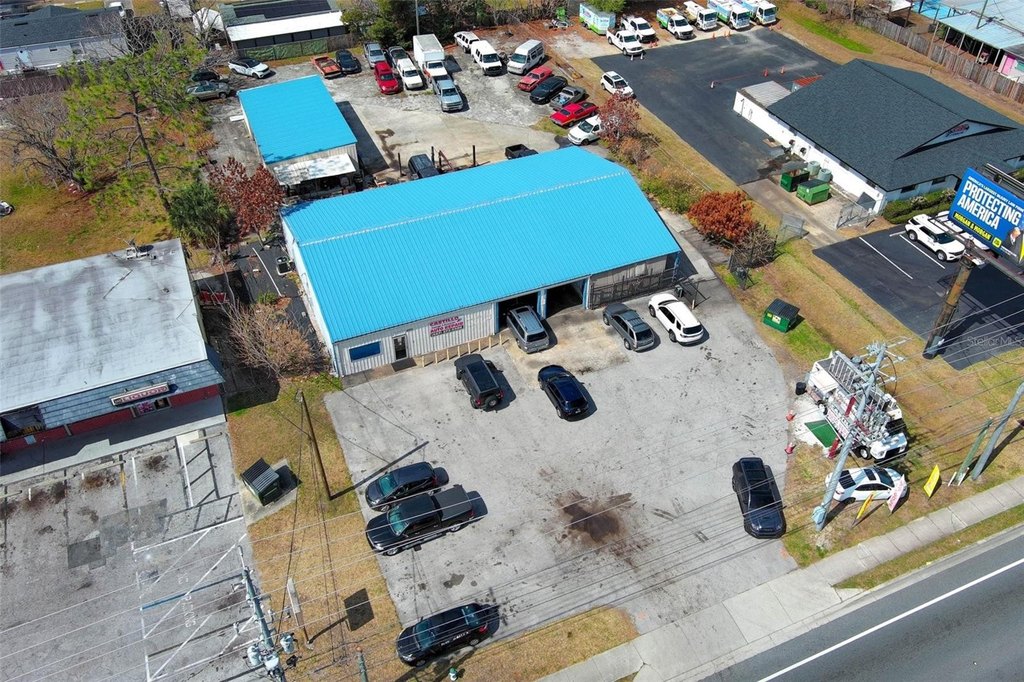
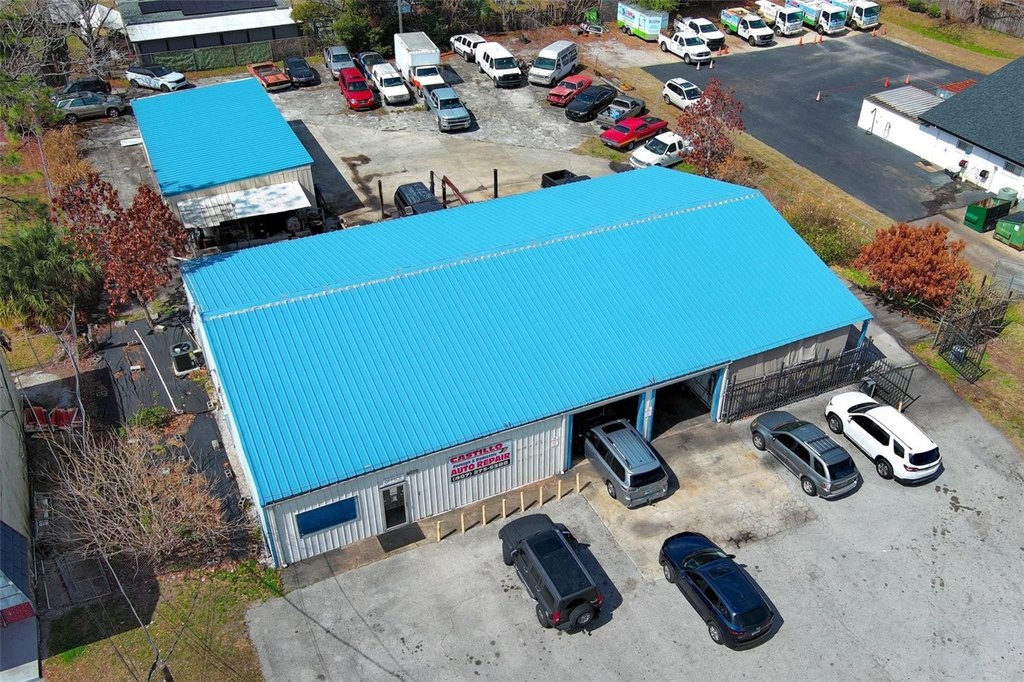
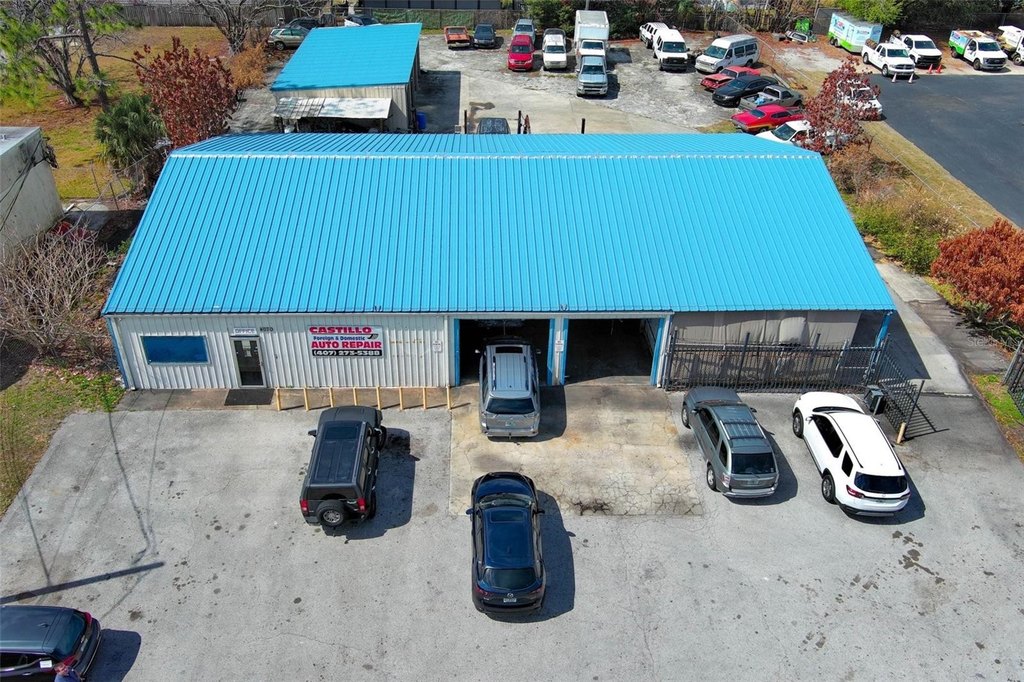
This 3,996-square-foot auto shop occupies a 0.75-acre site at 4070 S Goldenrod Road in Orlando. Built in 1978, the Class B facility has a metal-frame structure, concrete flooring, tile roofing, central air, and natural gas heating. Its automotive layout includes 6 lifts and 2 service bays, supported by a customer waiting room, reception office, and two bathrooms. A security camera system and a rear 3-car storage shed add functional support areas.
The property is zoned C-2 and provides up to 12 parking spaces. Building improvements include roof repairs completed in August 2004 and installation of a new A/C system in July 2025. The site is located in Orange County, Florida, with the property address on S Goldenrod Road.
The property is zoned C-2 and provides up to 12 parking spaces. Building improvements include roof repairs completed in August 2004 and installation of a new A/C system in July 2025. The site is located in Orange County, Florida, with the property address on S Goldenrod Road.
Key Highlights
- 3,996‑square‑foot auto shop on a 0.75‑acre site
- 6 lifts and 2 service bays for automotive repair operations
- C‑2 zoning
Financial Insights
Estimated NOI and Cap Rate
NOI / Yr
$78,469
Cap Rate
4.13%
Suggested Prices Based on Cap Rates
Cap Rate 5%
$1,569,380
$1.6M
Cap Rate 7%
$1,120,986
$1.1M
Cap Rate 9%
$871,878
$871.9K
Market Conditions
NOI Build-Up for 3,996 SF
Gross rent
$116.0K $29.04/SF
− Vacancy
−$3.9K −$0.99/SF
EGI
$112.1K $28.05/SF
− OpEx
−$33.6K −$8.42/SF
NOI
$78.5K $19.64/SF
Area
ZIP 32822
Vacancy
3.40%
Lease Rate
$29.04 /SF/Yr
Expense Ratio
30.00%
Simulate Cap Rate and NOI
Suggested Prices Based on Cap Rates
Cap Rate 5%
$1,569,380
Cap Rate 7%
$1,120,986
Cap Rate 9%
$871,878
Alternative Uses
Best Use
Retail
$1.12M
$980.9K – $1.31M
NOI $78,469 @ 7.0% cap · market cap 4.13%
Second Best
Industrial
$318.9K
$279.0K – $372.1K
NOI $22,323 @ 7.0% cap · market cap 1.17%
Theoretical Best
Specialty Retail
$1.20M
$1.05M – $1.40M
NOI $84,074 @ 7.0% cap · market cap 4.42%
Zoning and permitted uses should be independently verified with authorities.
Property Analytics
Unlock full access to Insights
Subscribe to Realmo Intelligence
Open Analytics
Current Use
Lease Details
2
Service bays
Yes
Paved road access
Location Intelligence
Trade Area within ½ mile
258
Businesses Nearby
16k
Monthly Visits Nearby
Well-served
Demand for This Use
Explore this area
Business Placement
Foot Traffic Nearby
Shops & Services 77%
Dining 17%
Electronics 5%
Citgo
Shops & Services
6,033 visits/mo
0.3 miles
Family Dollar
Shops & Services
3,613 visits/mo
0.3 miles
Hungry Howie's Pizza
Dining
2,701 visits/mo
0.3 miles
O'Reilly Auto Parts
Shops & Services
2,505 visits/mo
0.2 miles
Metro by T-Mobile
Electronics
858 visits/mo
0.2 miles
Demographics for 32822, FL
64,120
Population
27,437
Households
2.3
Avg Household Size
37
Median Age
26%
College-Educated
88%
High-School Grad
13.6 sq mi
ZIP Area
4,715
Density / Sq Mi
$52,944
Median Household Income
$31,368
Median Earnings
$1,609
Median Rent
$222,000
Median Home Value
Check the figures for this property
Cap Rate, Value Estimation, Potential NOI and more
View Realmo Analytics
Market
Vacancy Rate% for Retail in Orlando, FL

Questions? Ask Rey
Realmo’s AI knows this listing — price, zoning, demand, history. Ask anything.



Similar Off Market Nearby
- One stop Automotive — 4855 Distribution Ct unit 4, Orlando, FL 32822
- Best Deal Window Tint — 4701 Distribution Ct #4, Orlando, FL 32822
- On the spot tire shop — 4701 Distribution Ct, Orlando, FL 32822
- Housewall Garage System — 4751 Distribution Ct # 6, Orlando, FL 32822
- Manny's Transport & Recovery — 4839 Patch Rd, Orlando, FL 32822
Frequently Asked Questions
What type of property is this?
Auto shop - C-2-zoned automotive facility with repair infrastructure, customer areas, and on-site storage improvements.
Where is this auto shop located?
The property is located at 4070 S GOLDENROD Road Orlando, FL.
What is the asking price?
The asking price for this property is $1,900,000.
What are key features of this property?
This property features: 3,996‑square‑foot auto shop on a 0.75‑acre site; 6 lifts and 2 service bays for automotive repair operations; C‑2 zoning


