Duplex on Pond-Fed
For Sale
$1,160,000
1408 Riosa RD, Lincoln, CA 95648
Residential Income, Lincoln, CA
Property Size3,092 SF
Lot Size4.80 Acres
Price / SF$375.16
Days on Market447
Property Features for 1408 Riosa RD
General Information
Property type
Residential Multi Family
Property subtype
Other
Zoning
FARM
Bedrooms
4
Rooms
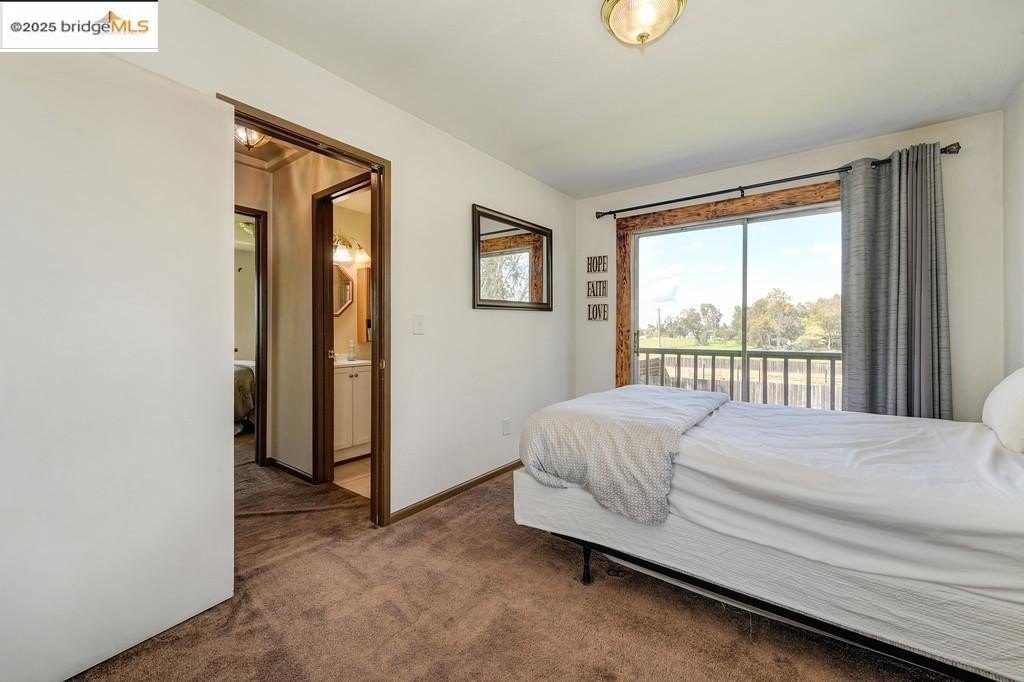
Laundry Room, Bedroom 3, Bedroom 1, Bedroom 2, Bedroom 4
Parking features
RV
Security features
Security
Window features
Screens
Interior features
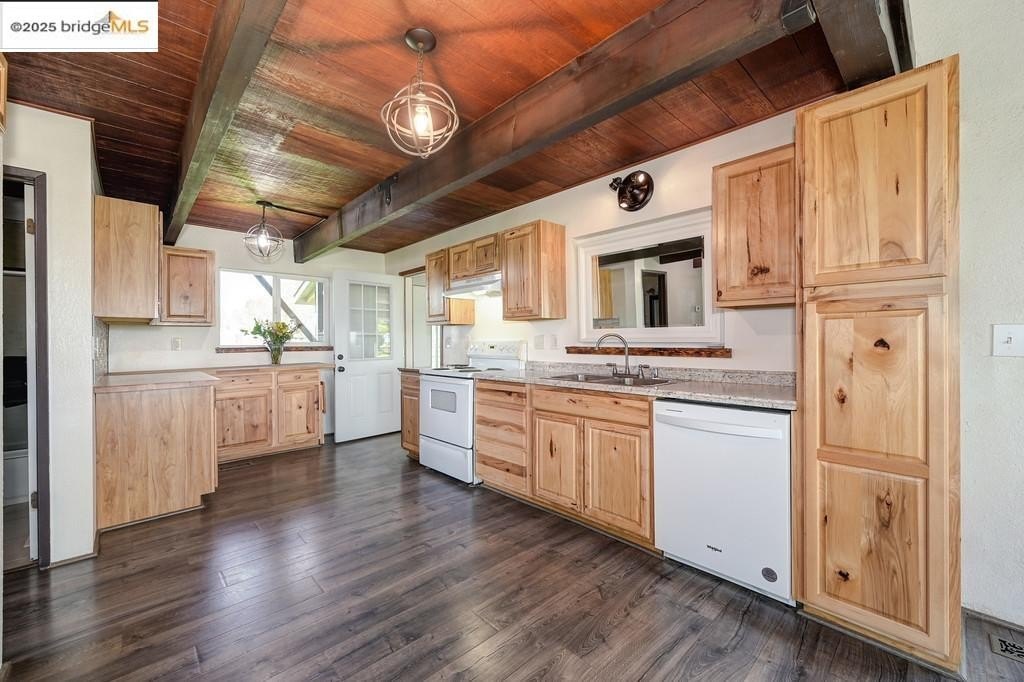
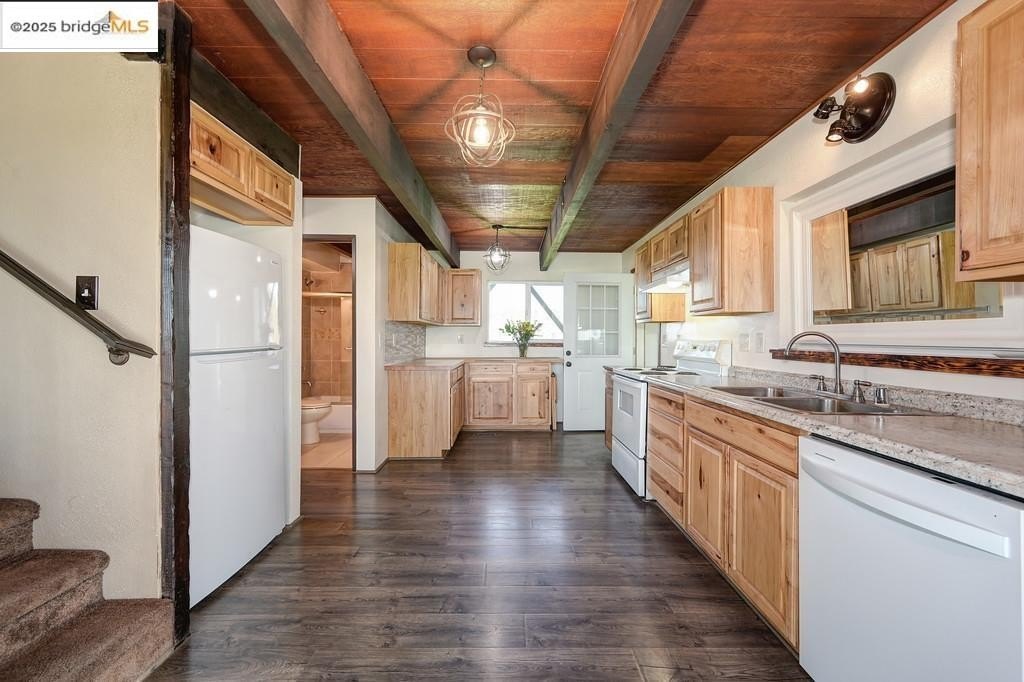
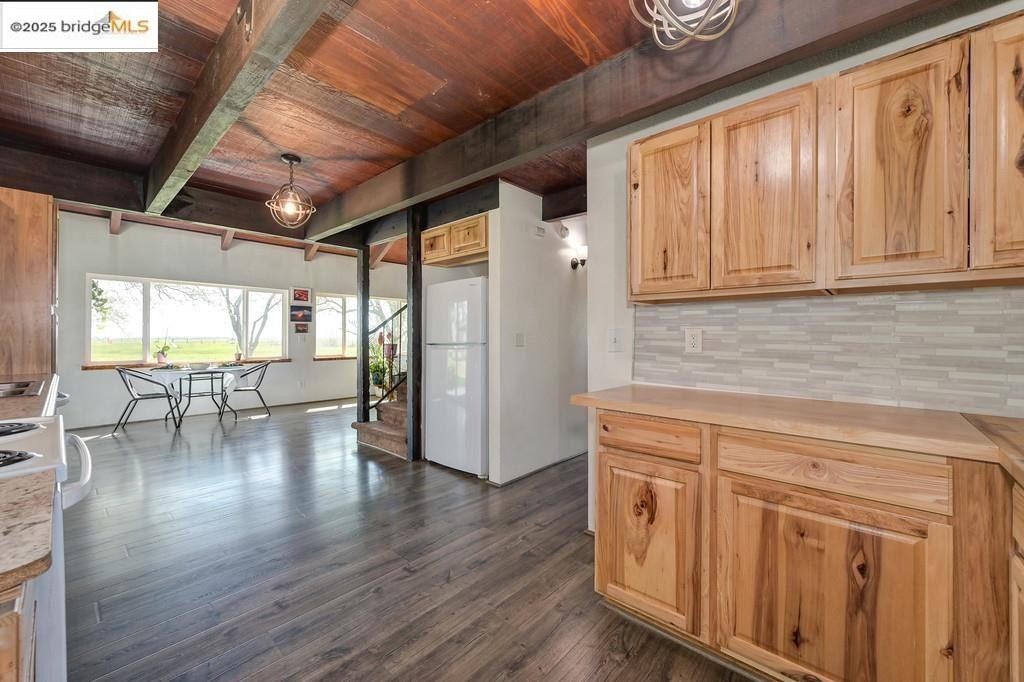
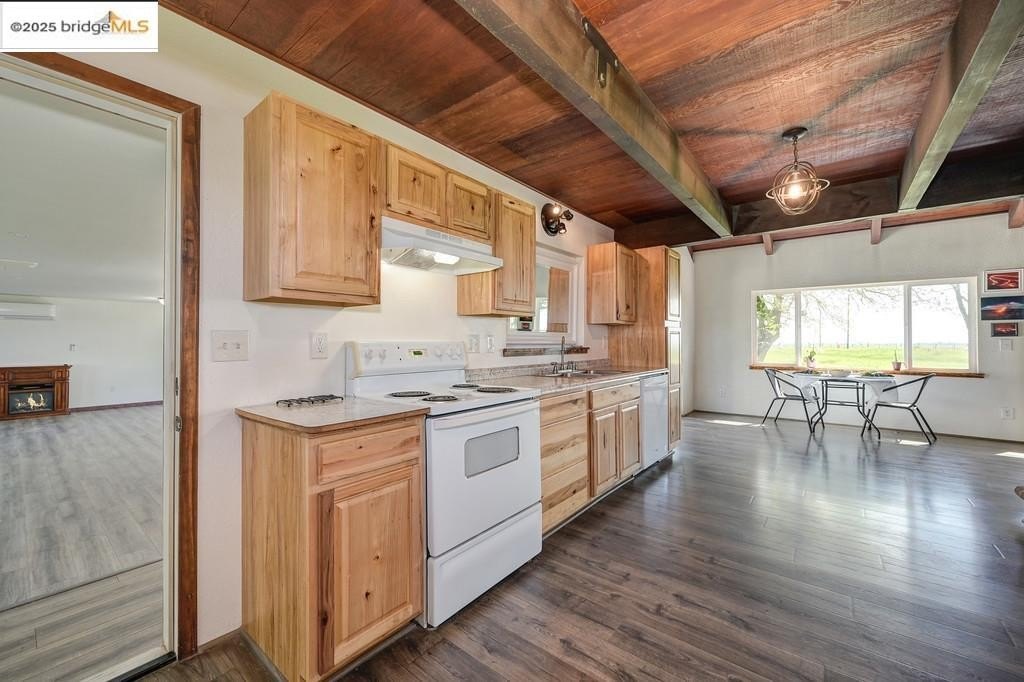
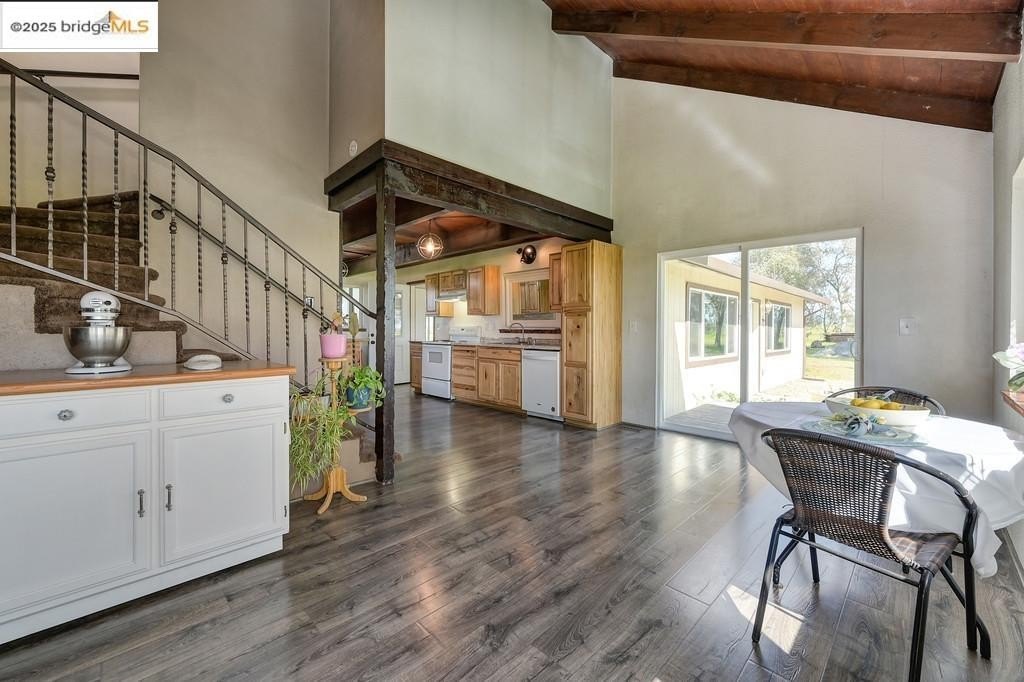
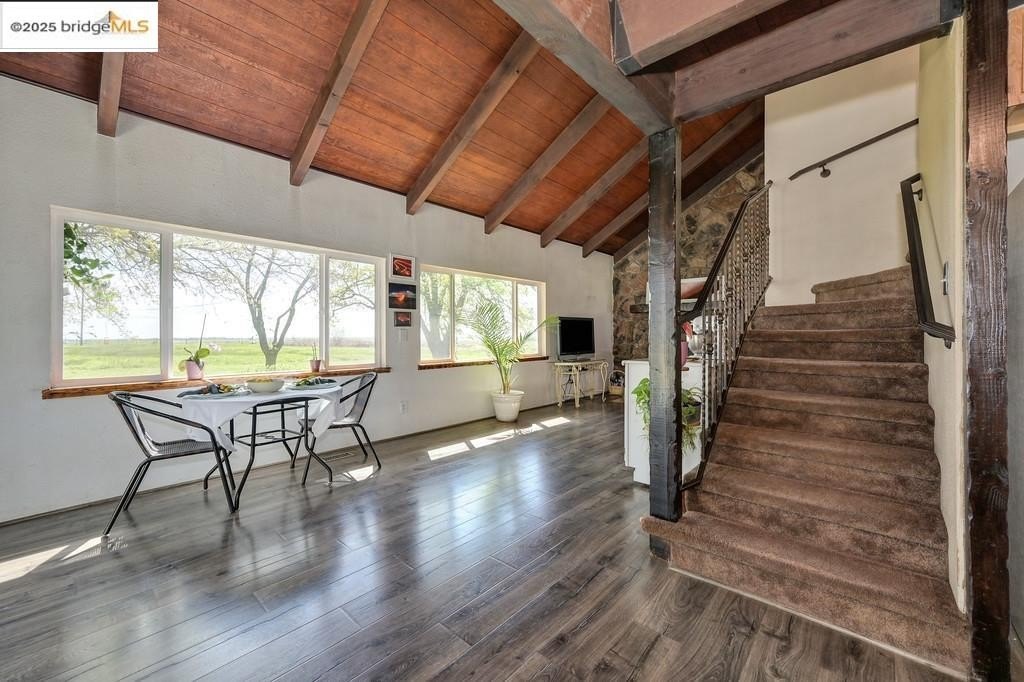
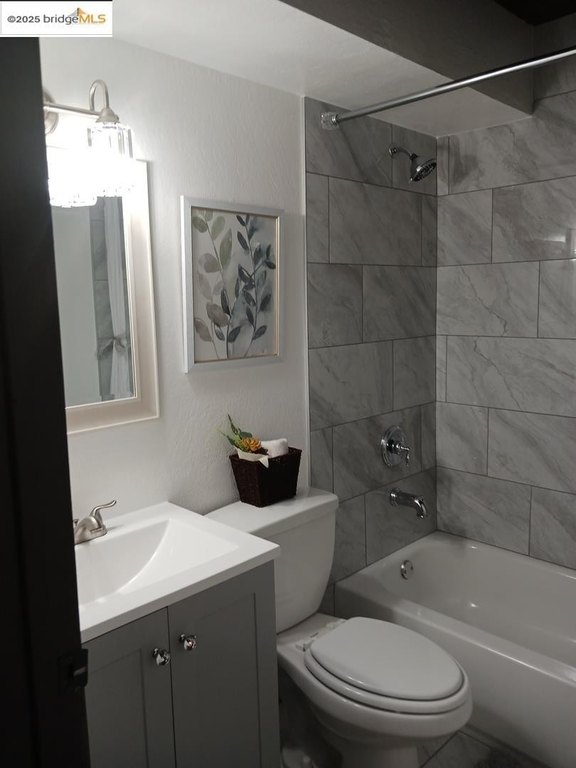
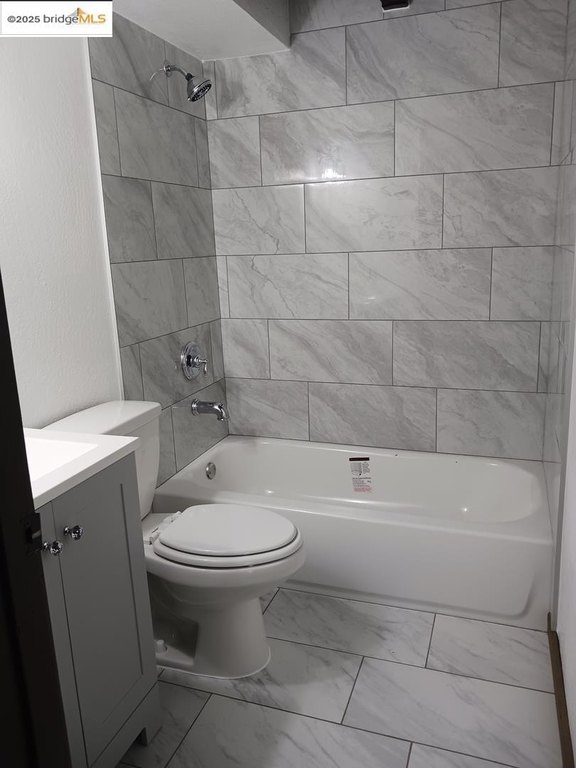
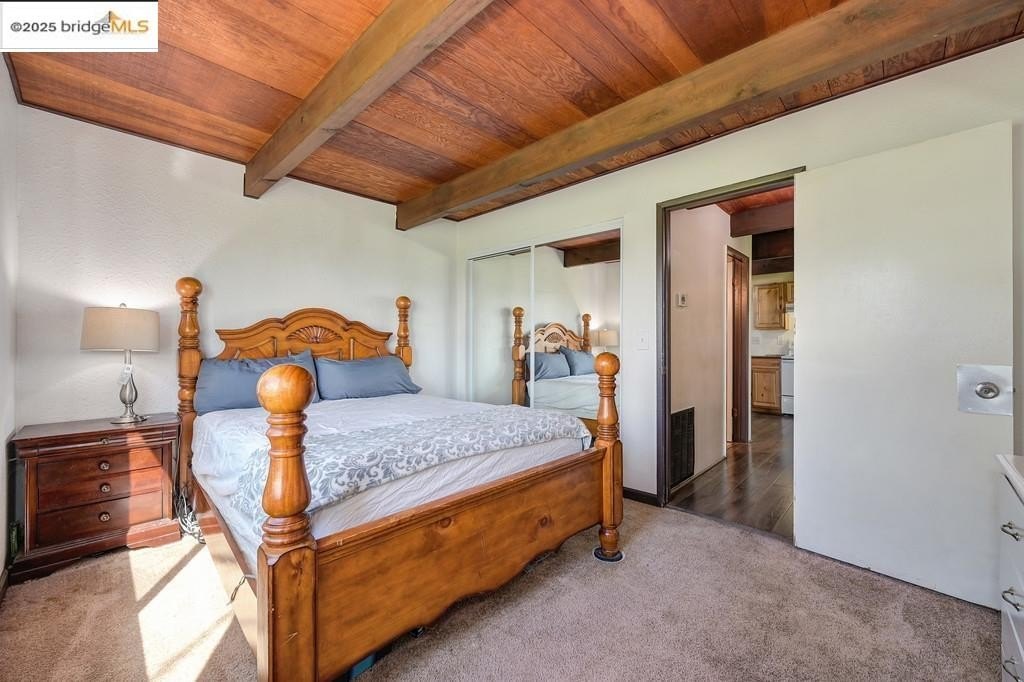
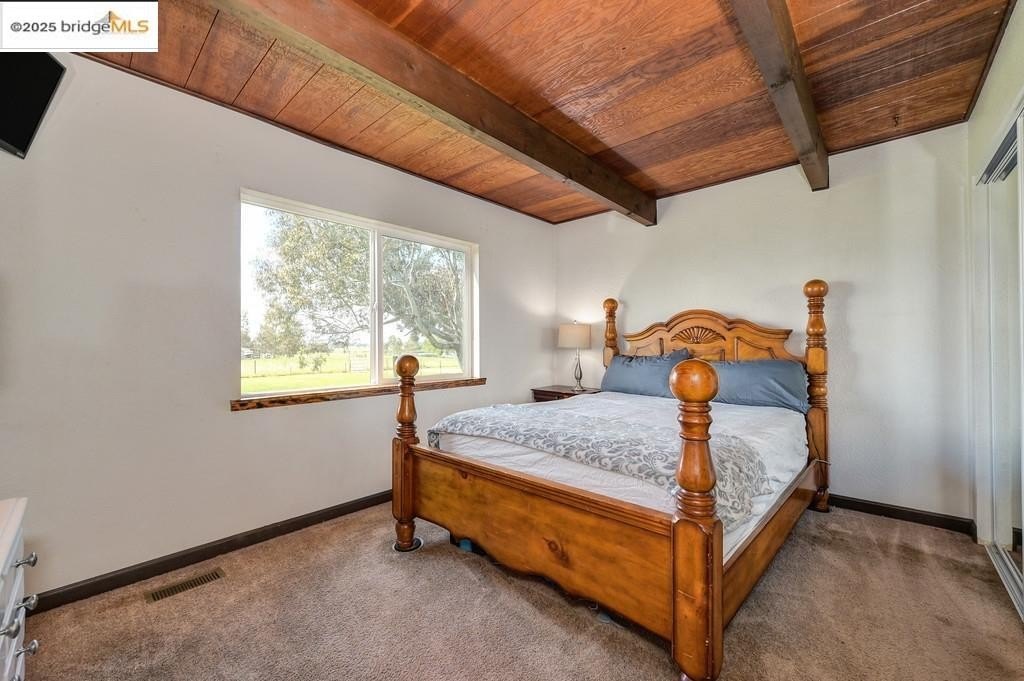
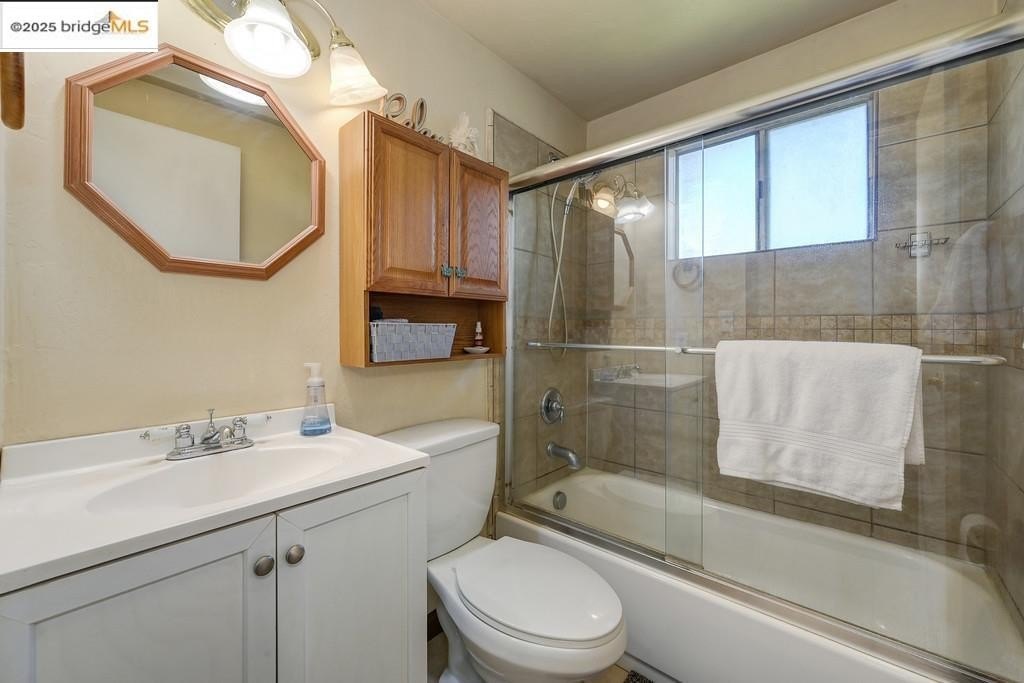
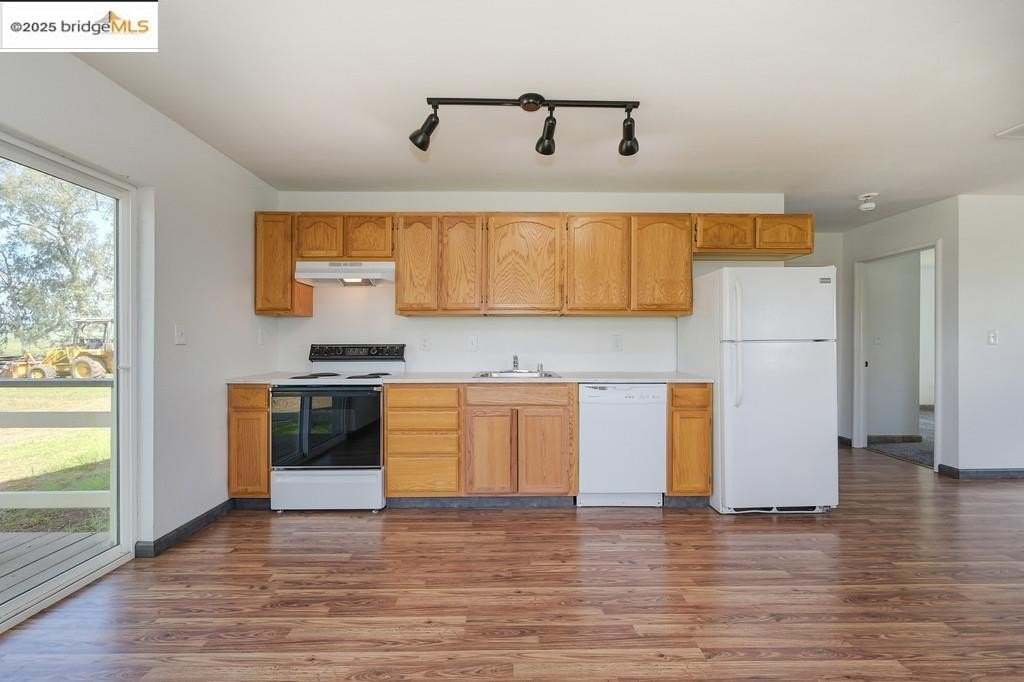
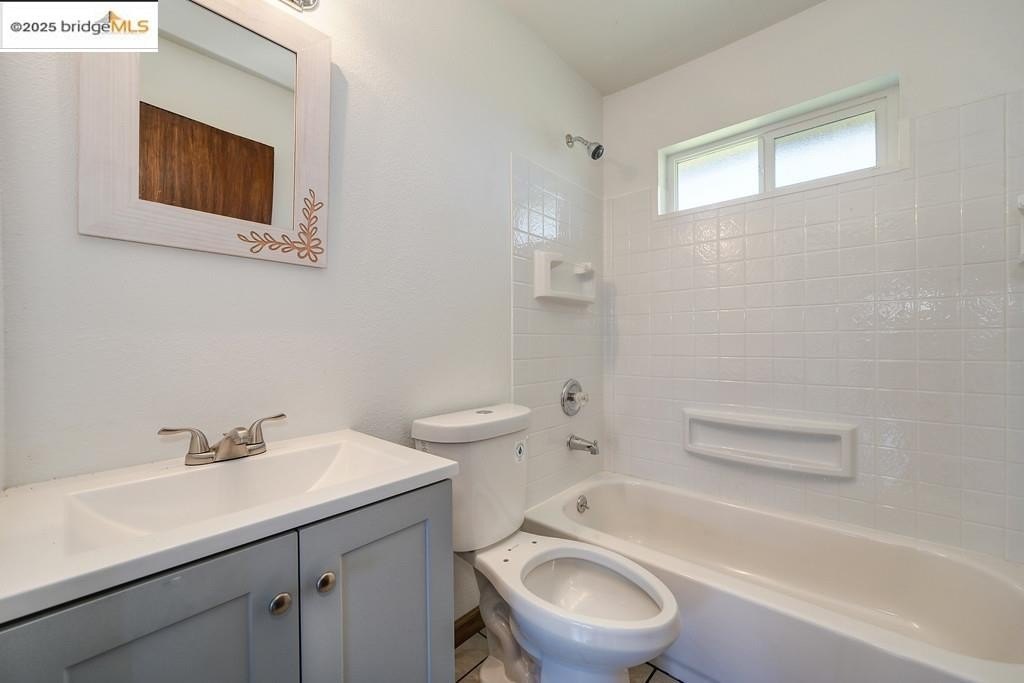
Updated Baths, Updated Kitchen, Open Beam Ceiling, Tub w/Shower Over
Exterior features
Dog Run
Fencing
Fenced, Cross Fenced, Barbed Wire
Fireplace
1
Appliances
Dryer, Washer, Electric Water Heater
Subdivision
Not Listed
Lot features
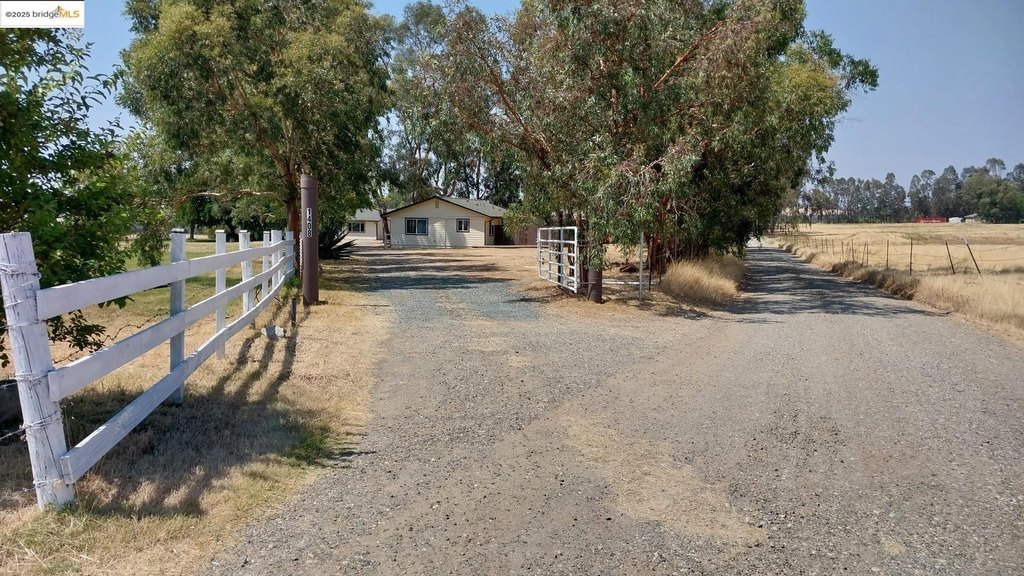
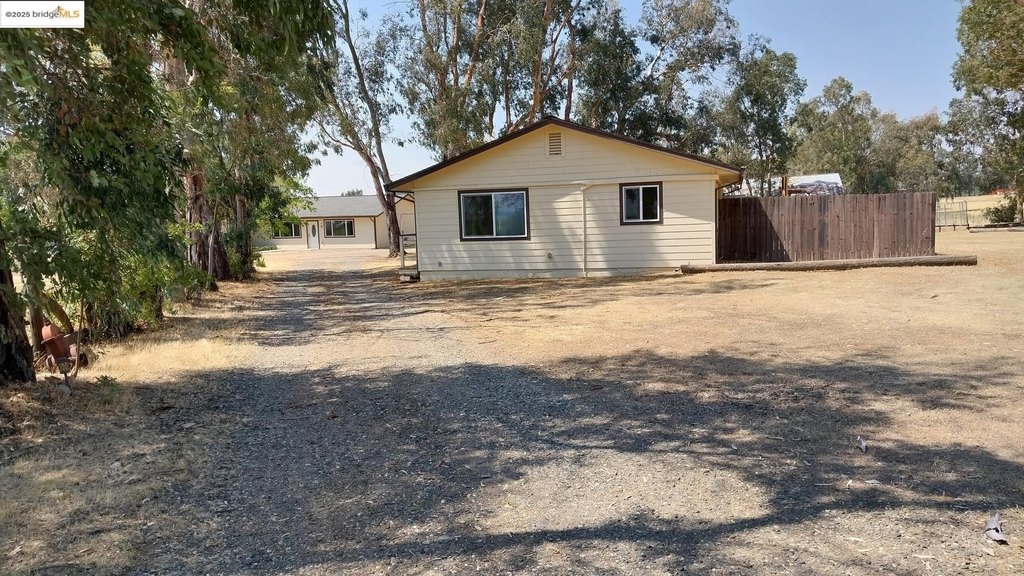
2 Houses / 1 Lot, Agricultural, Private, Security Gate
High school district
Western Placer Unified
Standard status
Active
APN
020012044000
Size
3,092 SF
Lot size
4.80 Acres
Utilities
Sewer type
Septic Tank, Engineered Septic
Heating system
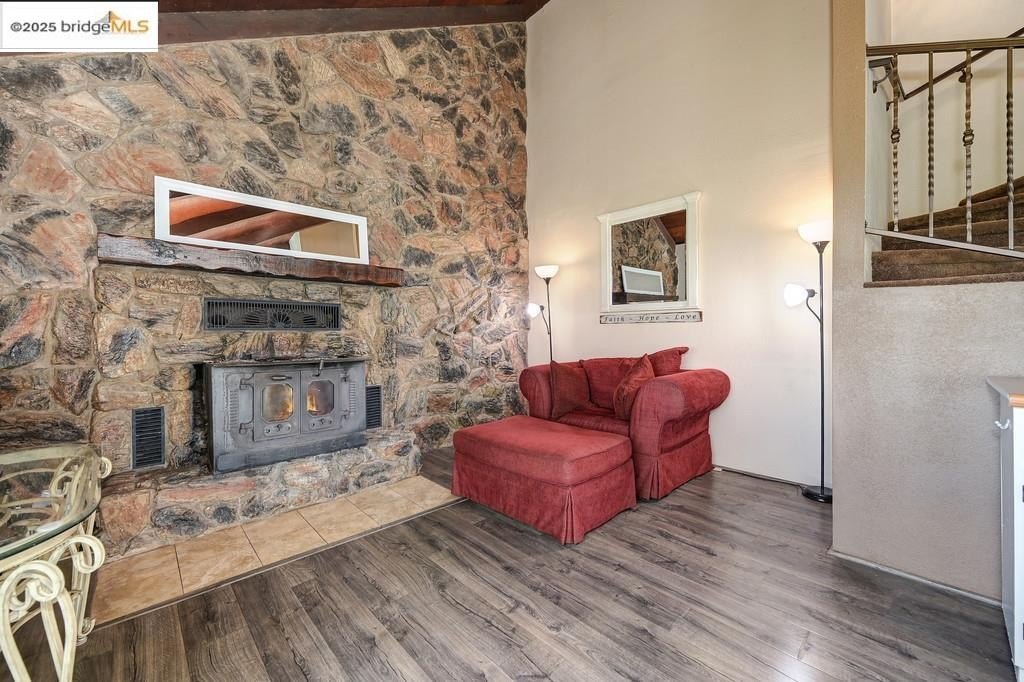
Fireplace(s), Heat Pump (Heating), Fireplace Insert, Electric (Heating)
Cooling system
Multi Units, Window Unit(s), Wall/Window Unit(s), Heat Pump, Central Air
Water source
Well, Private
Water front features
Pond
Amenities
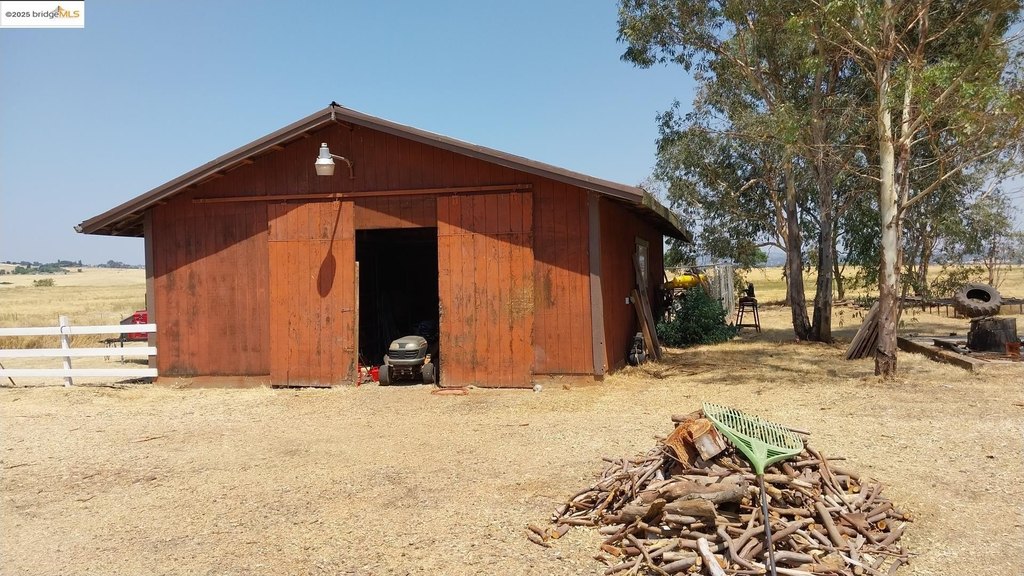
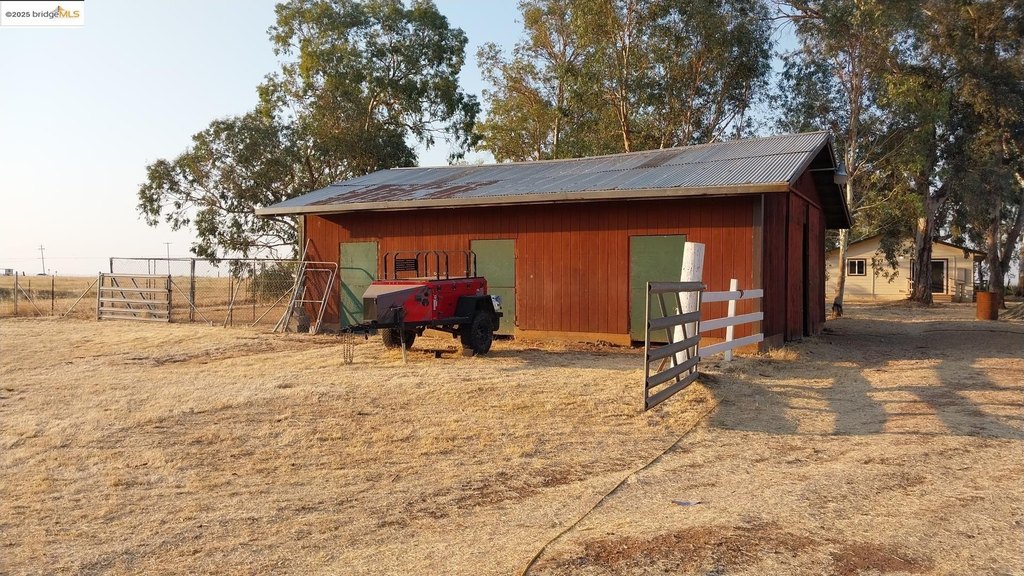
barn
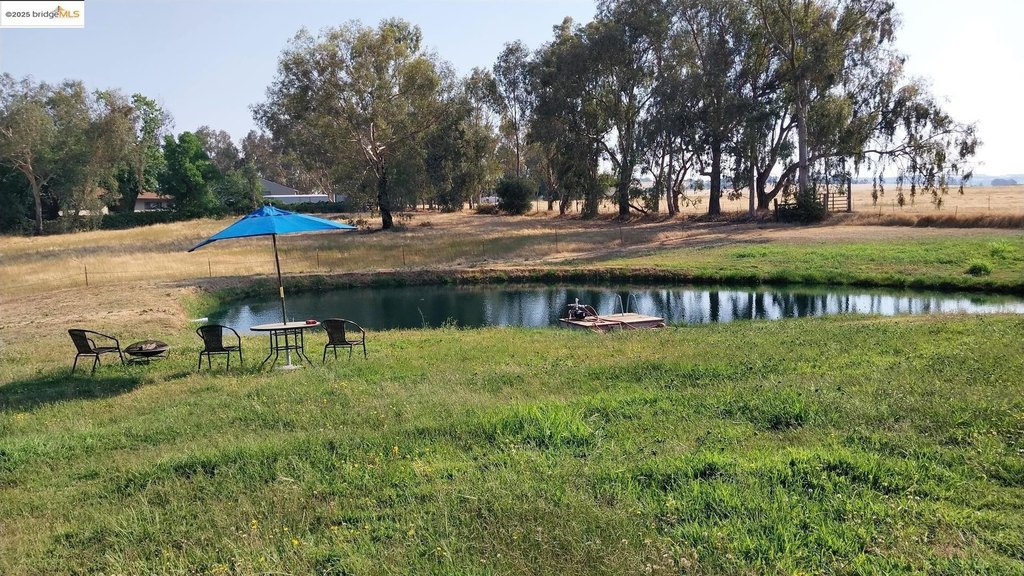
pond
fenced
cross fenced
Building Details
Year built
1974
Flooring type
Laminate, Carpet
Building materials
Frame, Wood Siding, Lap Siding, Fiber Cement
Additional Structures
Kennel/Dog Run
Listing Agency:
HOMECOIN.COM
(888) 400-2513
Listed By:
Jonathan Minerick · License #01523060
(404) 388-9441
Added: Jul 18, 2025
Changed: Sep 16
Last Checked: Oct 7 at 4:06PM
MLS# 41105300
Copyright © 2026 bridgeMLS. All rights reserved. All information provided by the listing agent/broker is deemed reliable but is not guaranteed and should be independently verified.
Investment Insights
Based on property information with market context.
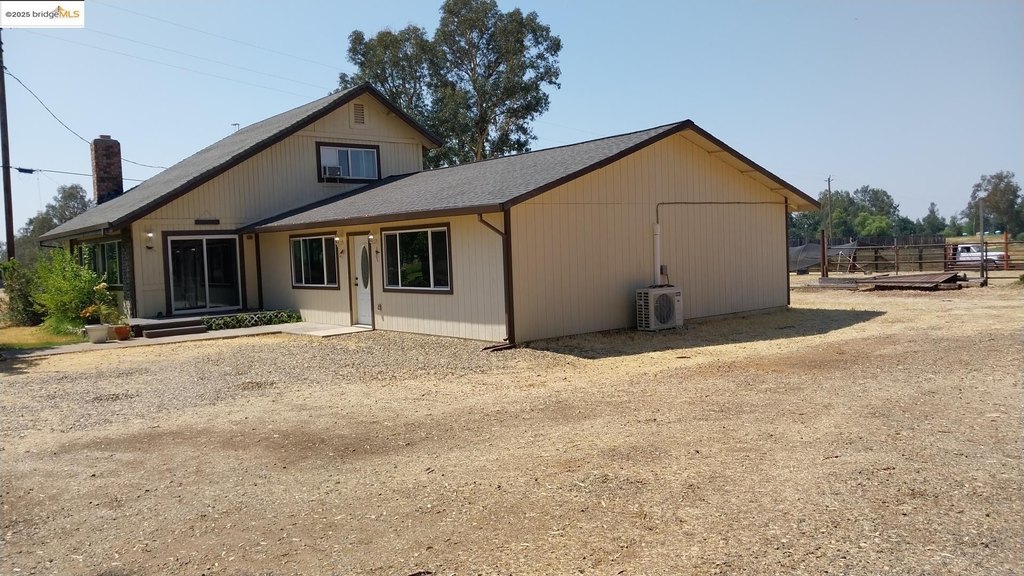
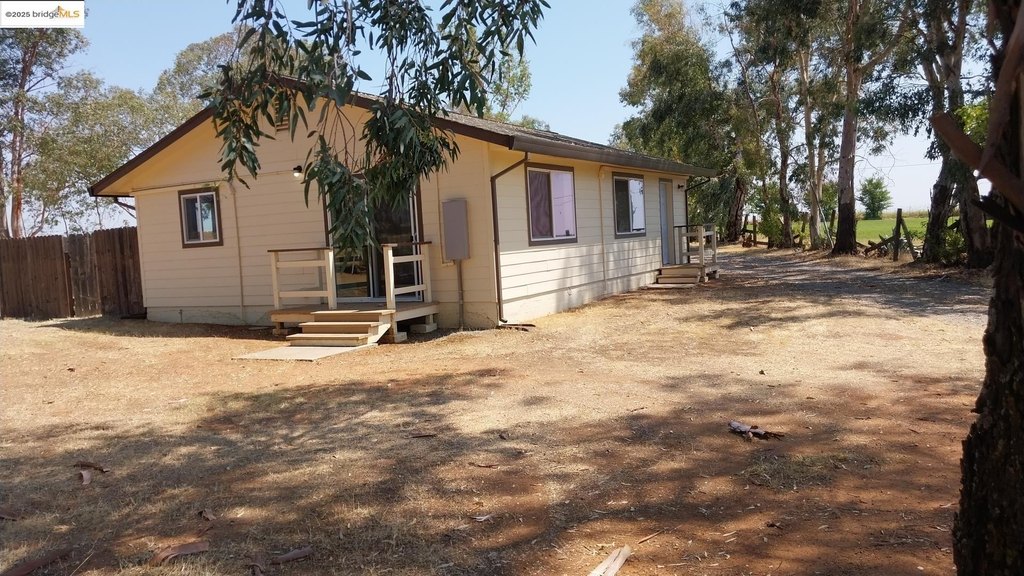
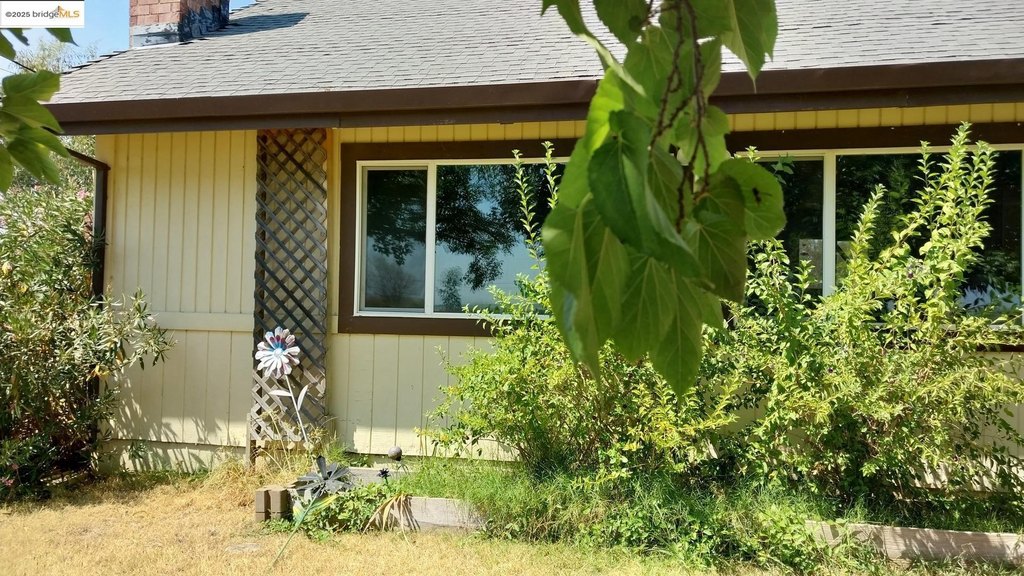
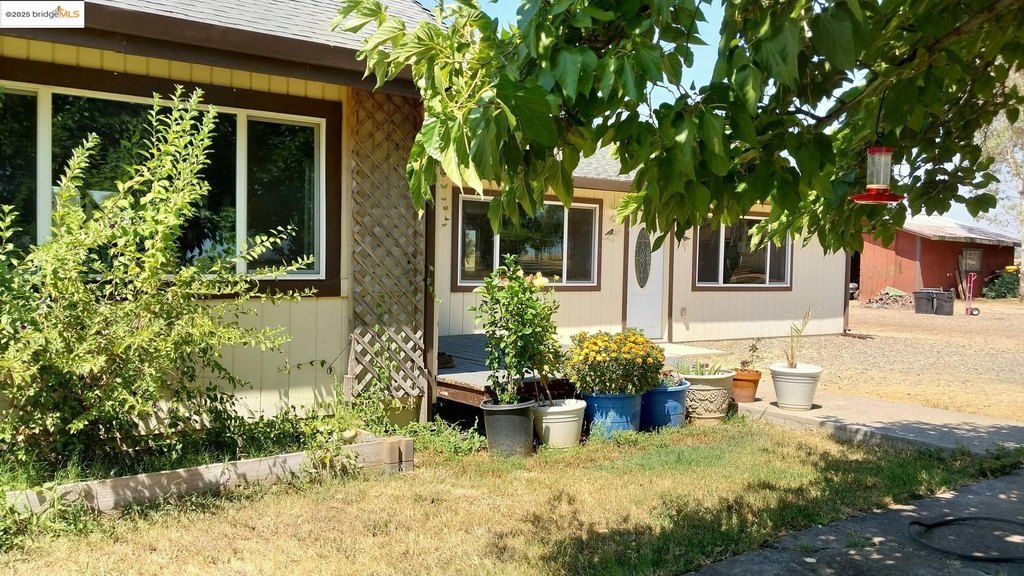
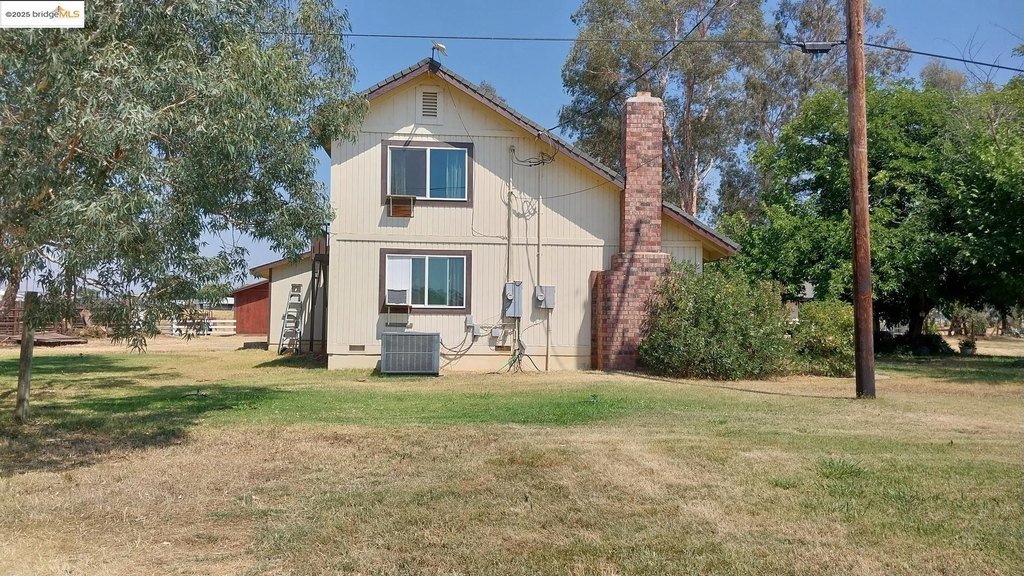
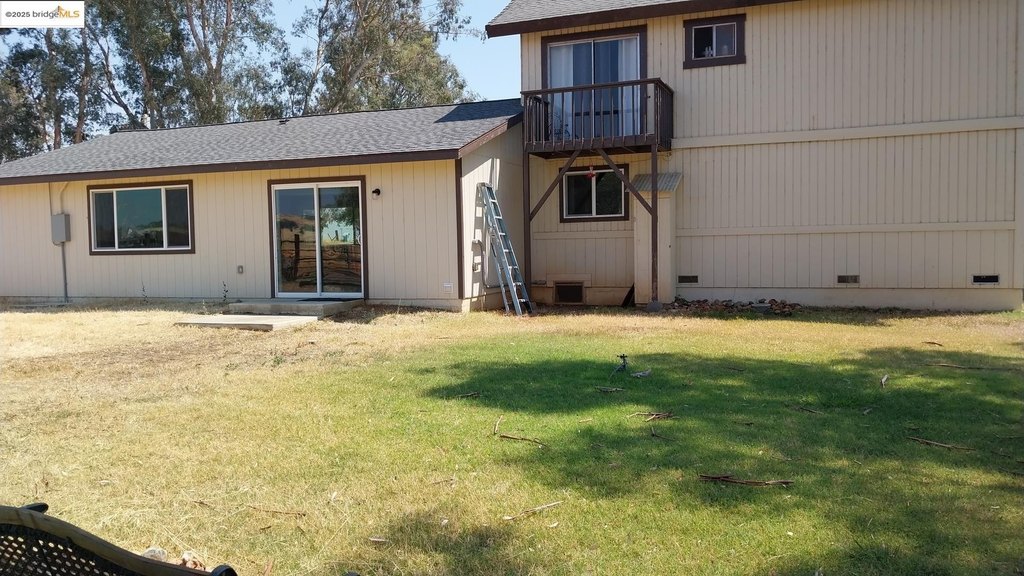
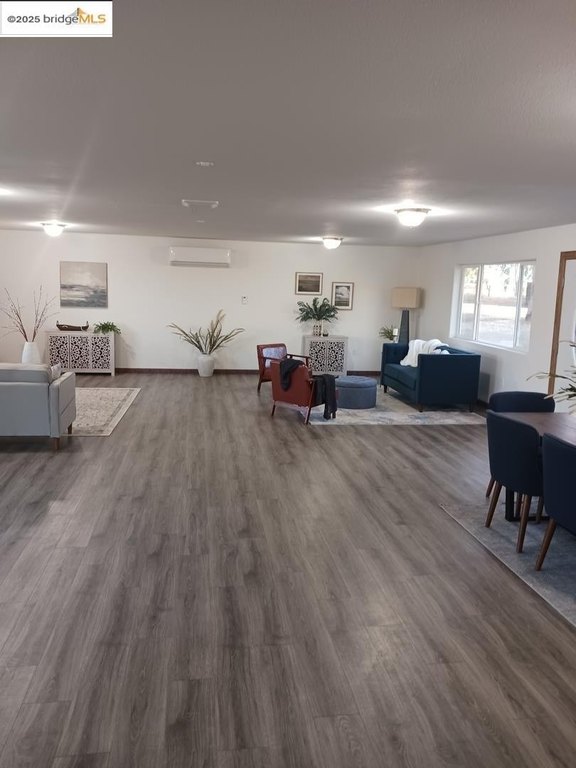
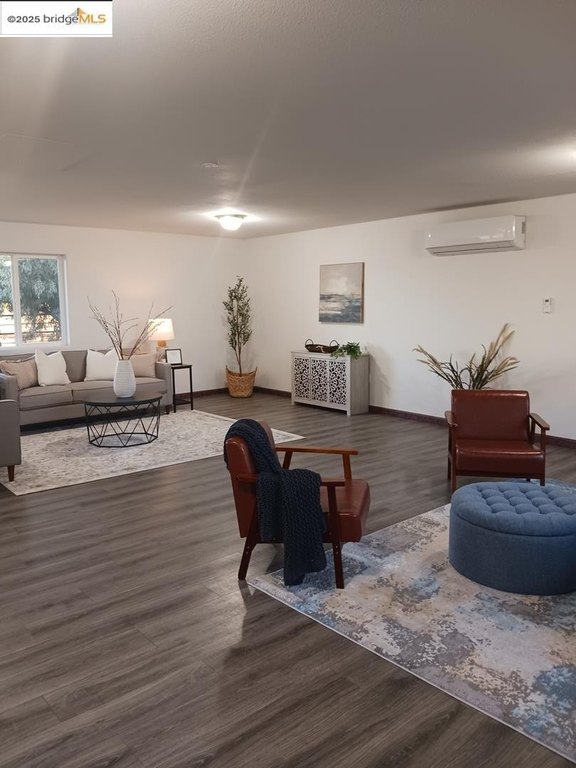
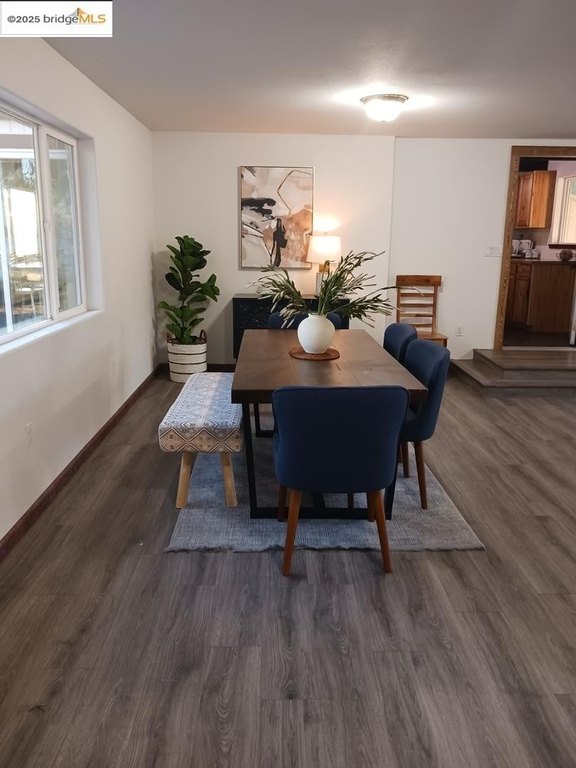
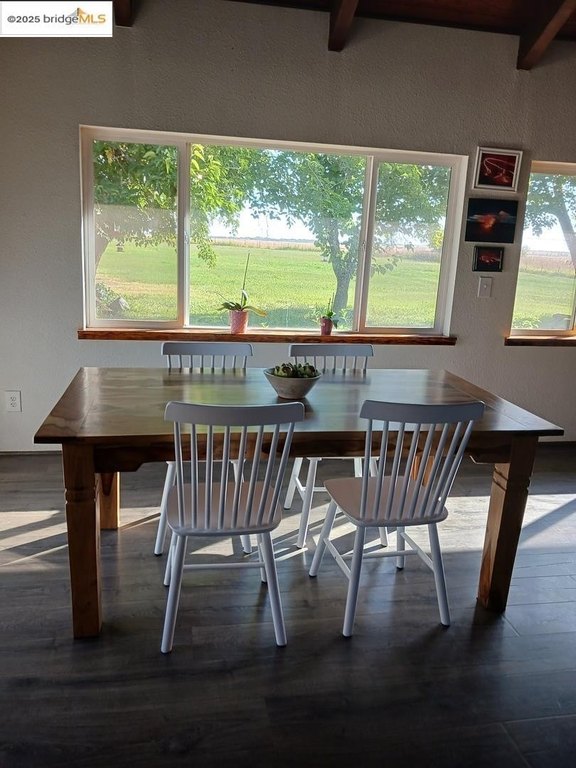
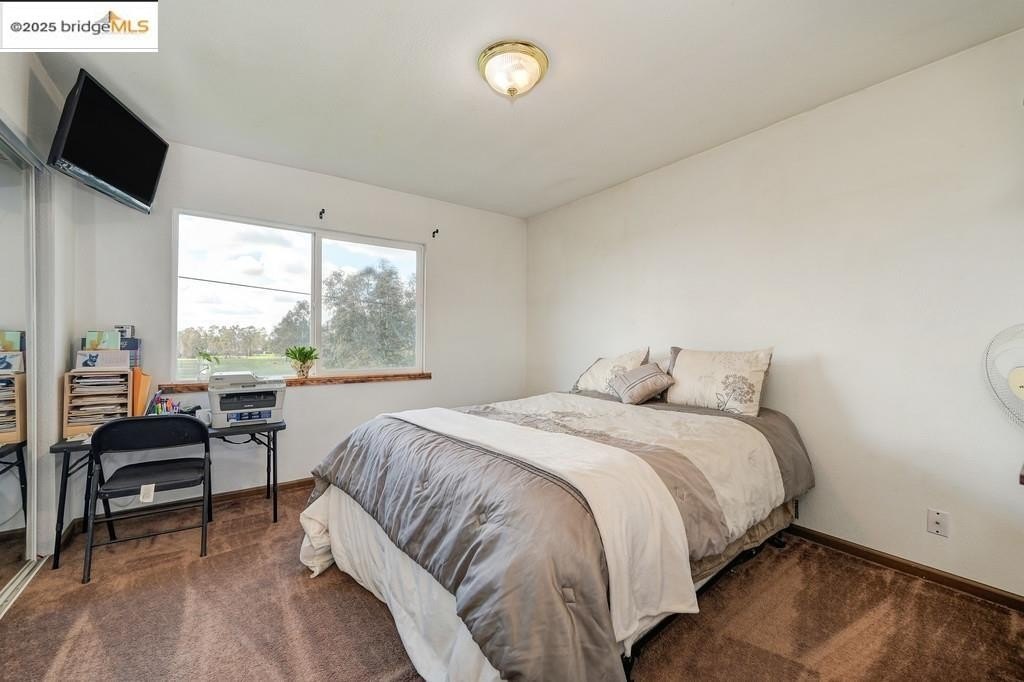
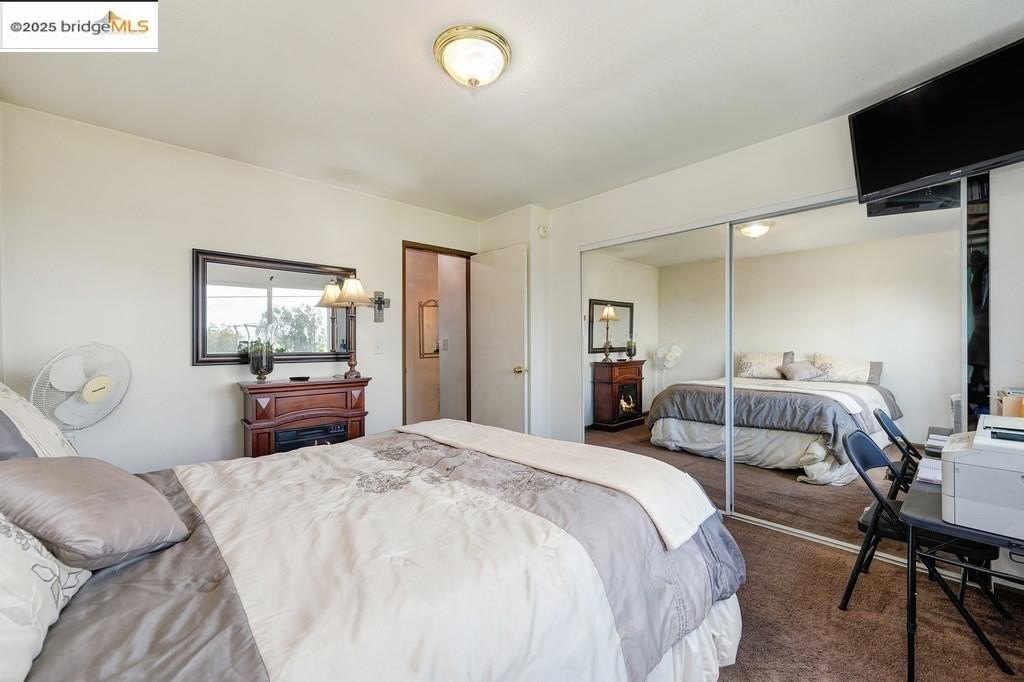
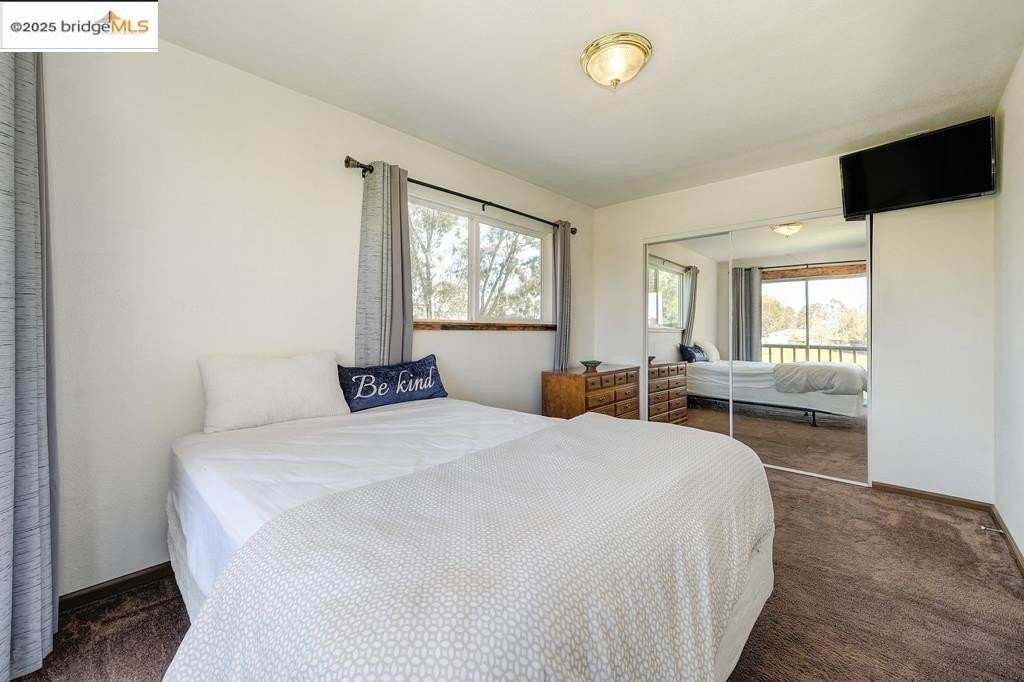
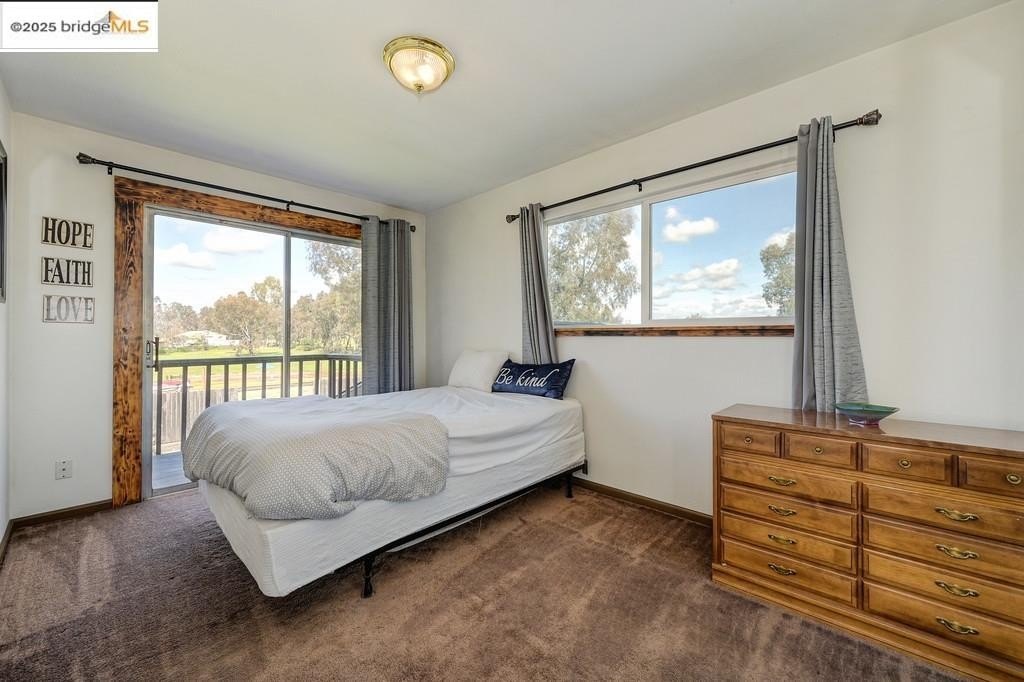
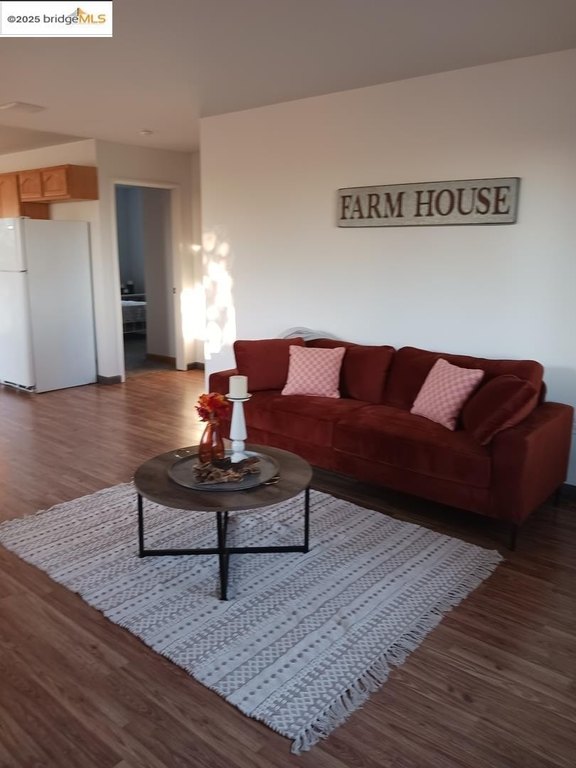
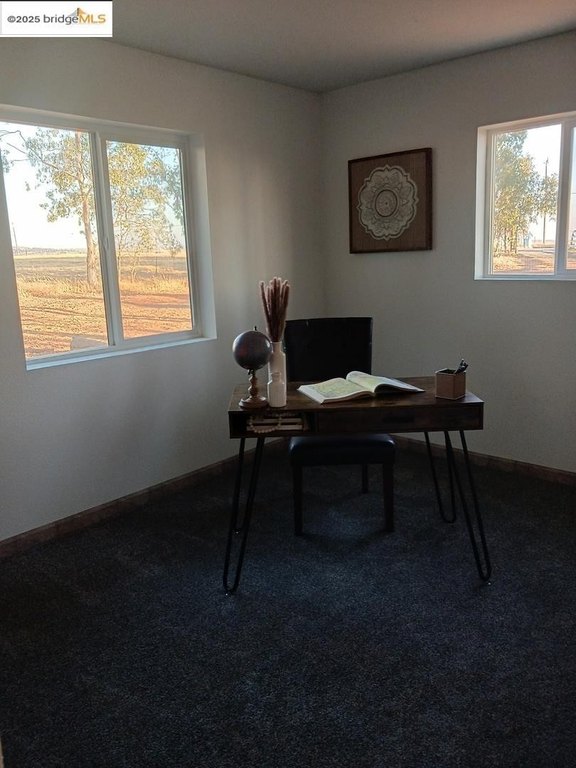
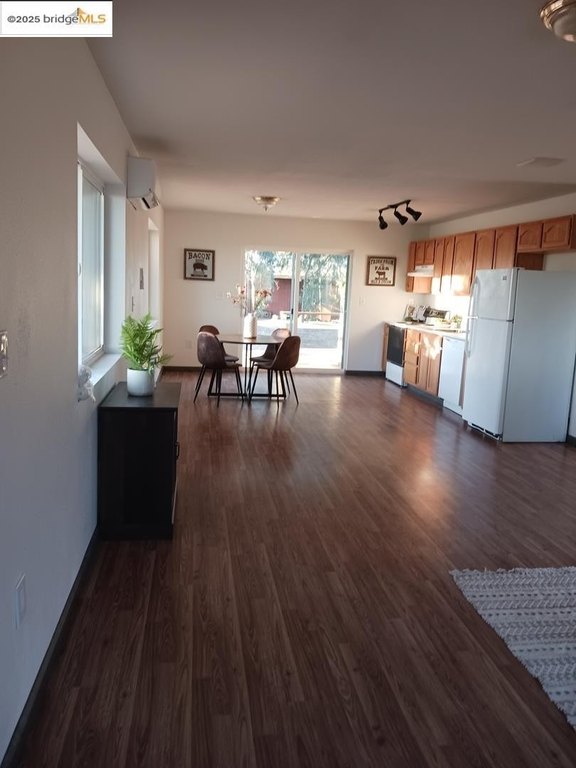
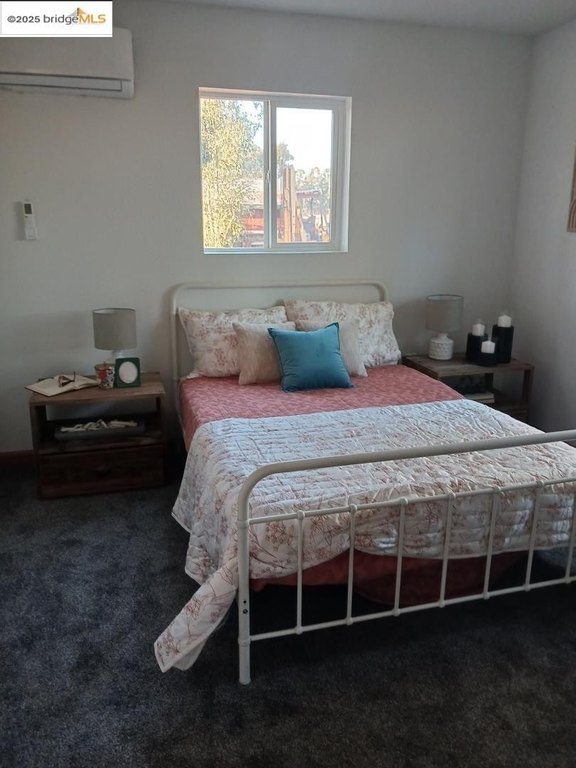
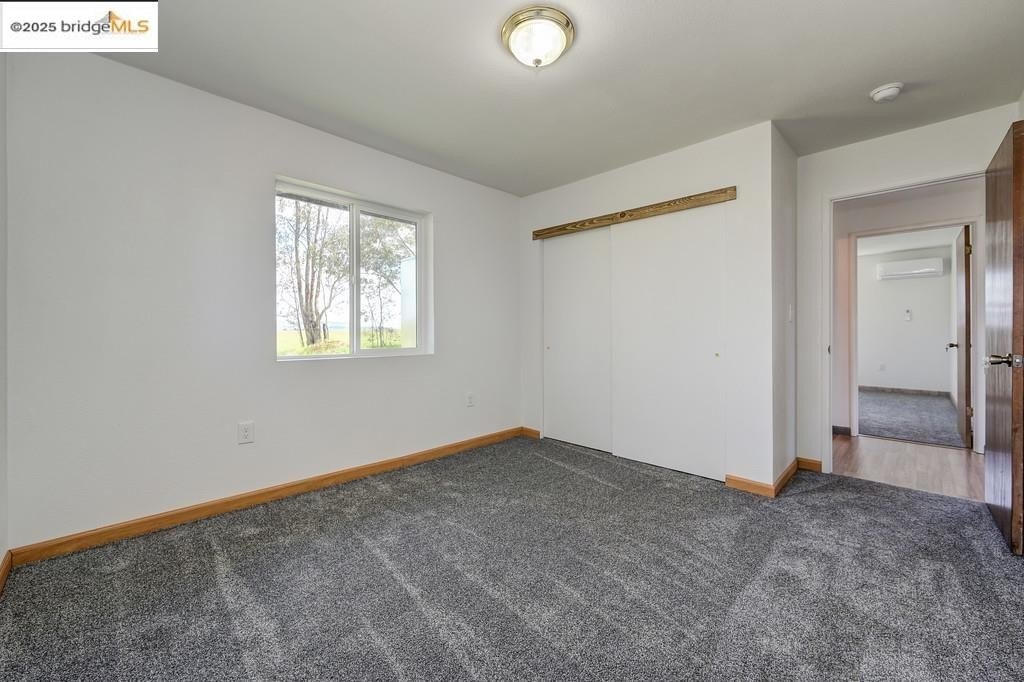
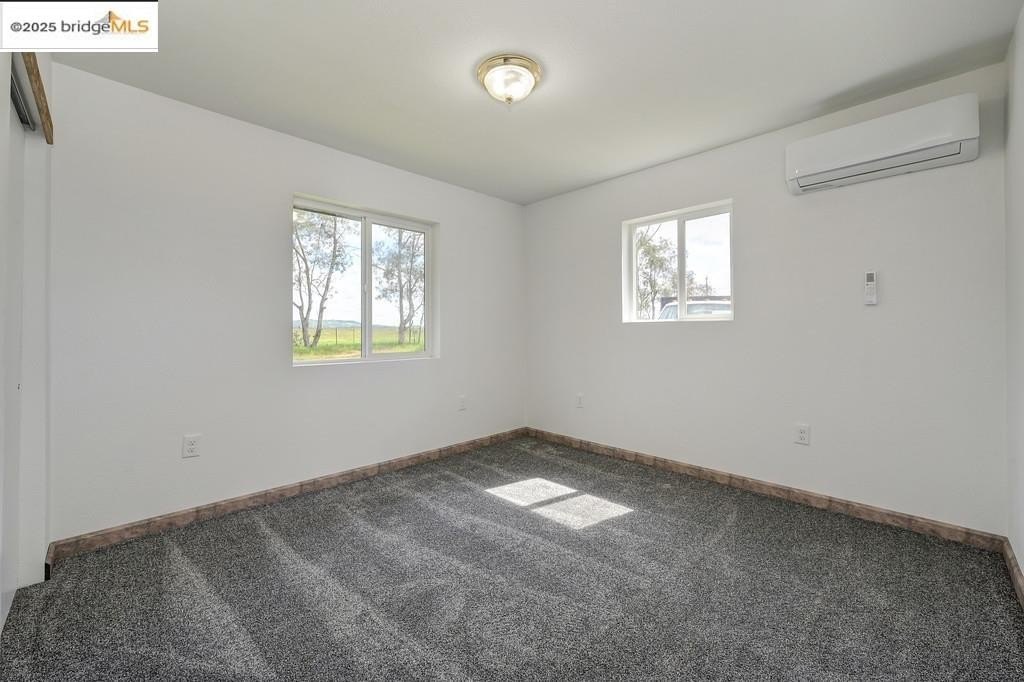
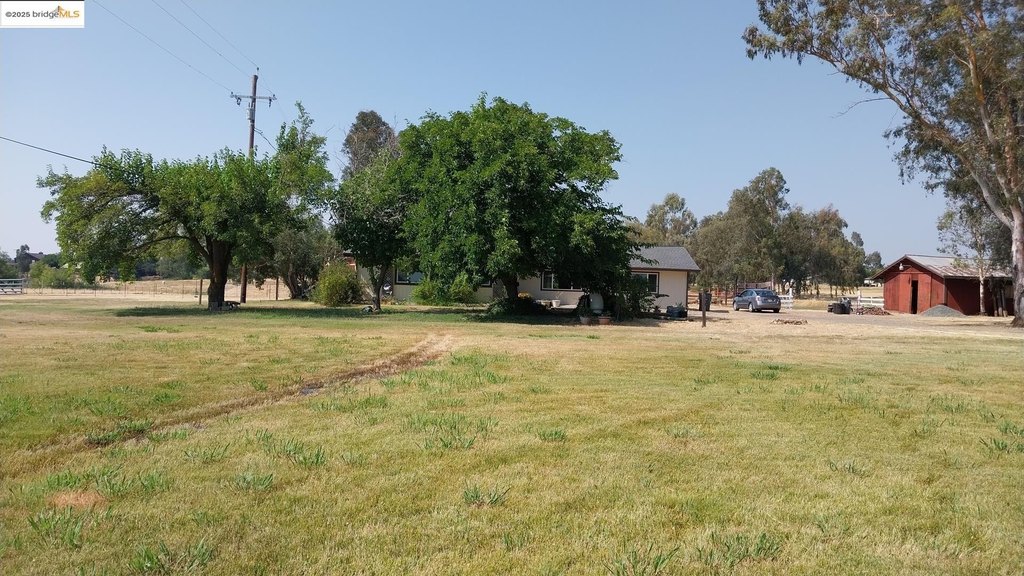
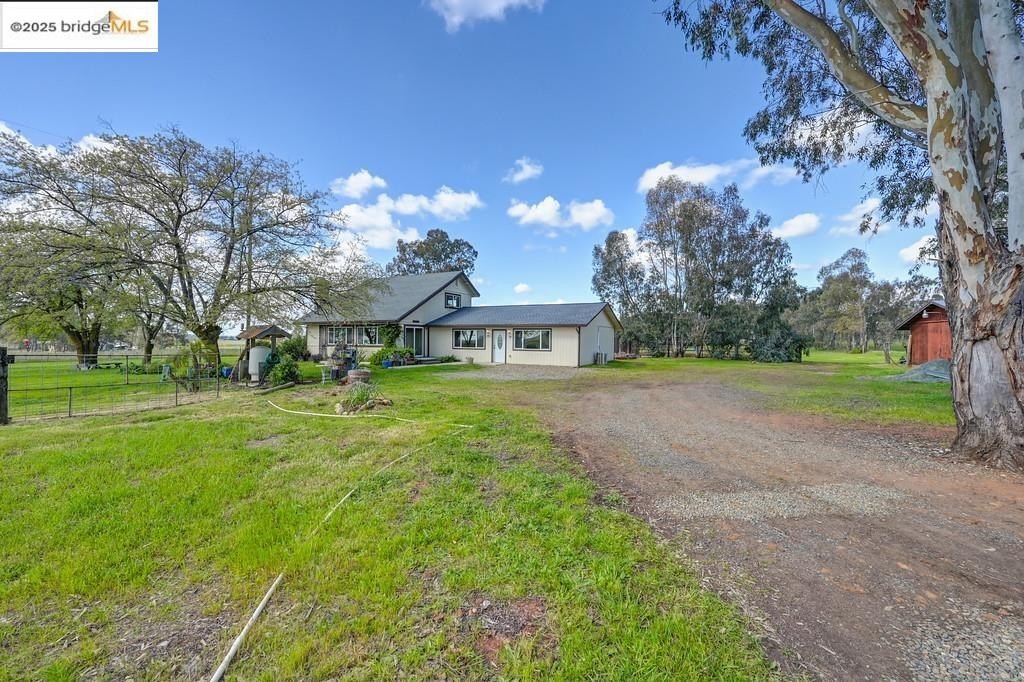
A duplex-style property with two separate houses on the same site. The homes are described as fully separate, each with its own power meter and address and its own septic system. The first home is 2,200 square feet with three bedrooms and two bathrooms, plus a large entertaining/family area; the listing notes updated kitchen and updated baths, along with hickory cabinets and a dishwasher. It includes a mix of upstairs and downstairs bedrooms and bathrooms and is supported by new A/C heat pumps. The second home is newly built at 884 square feet with two bedrooms and one bathroom, plus a den.
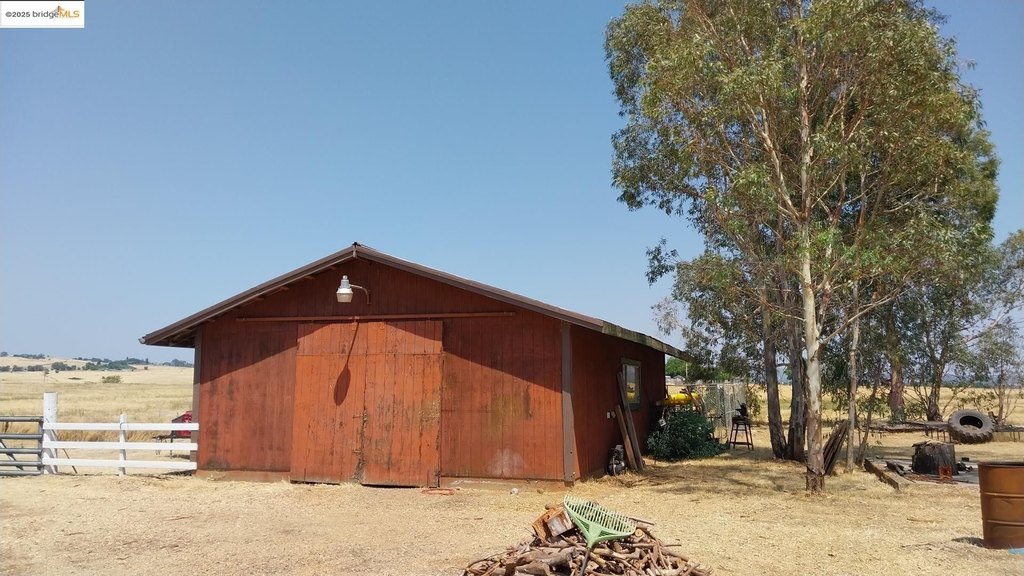
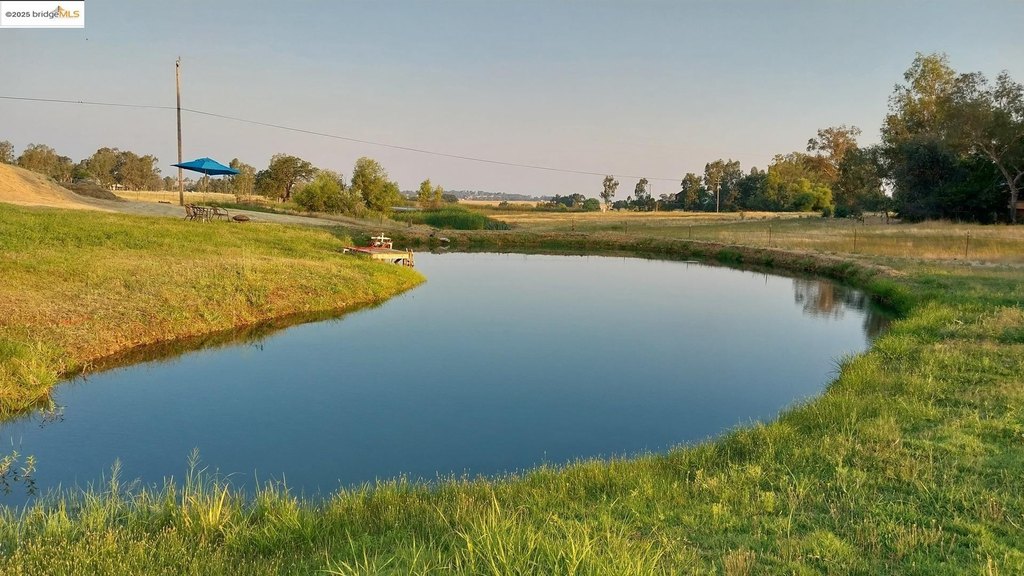
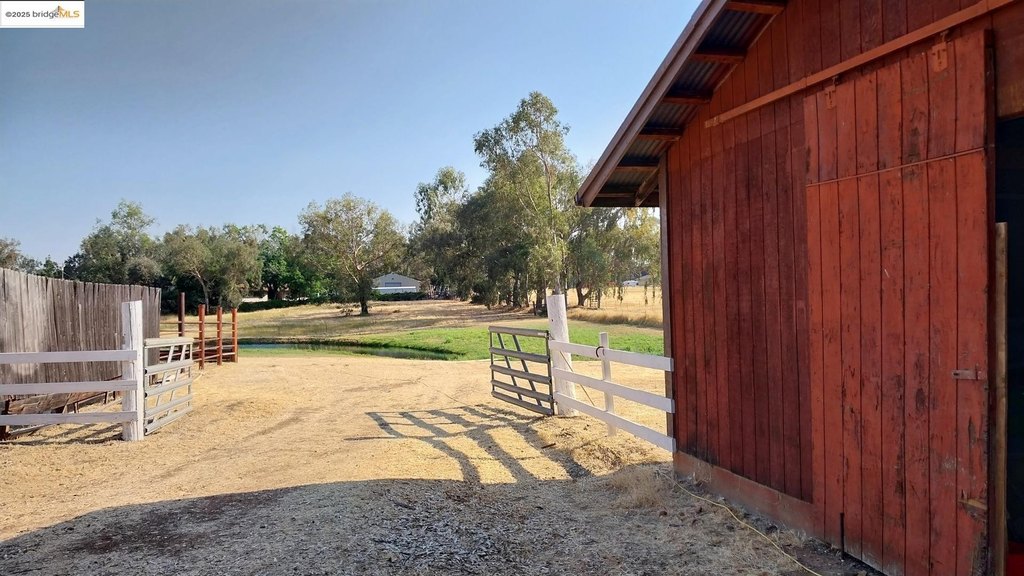
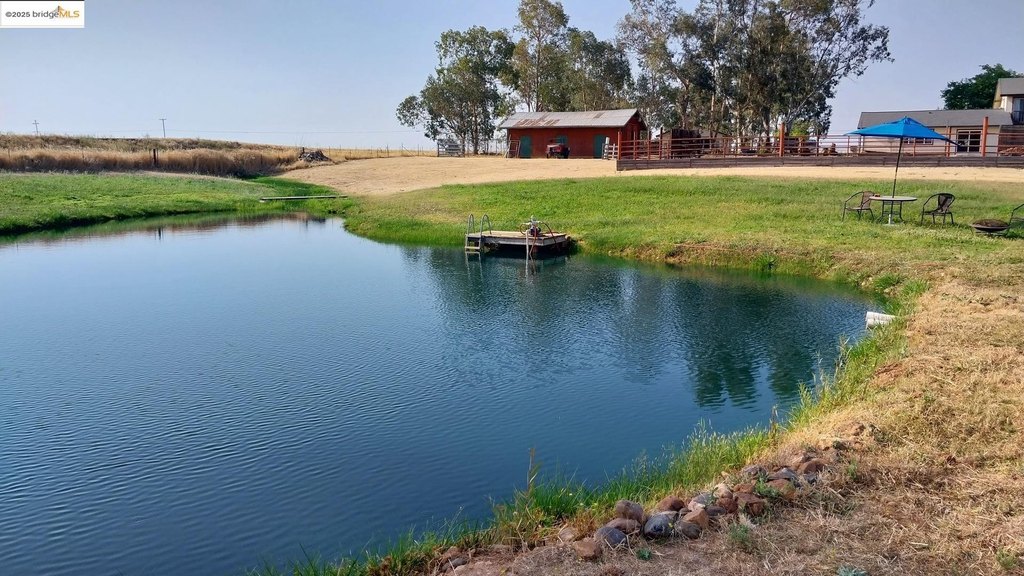
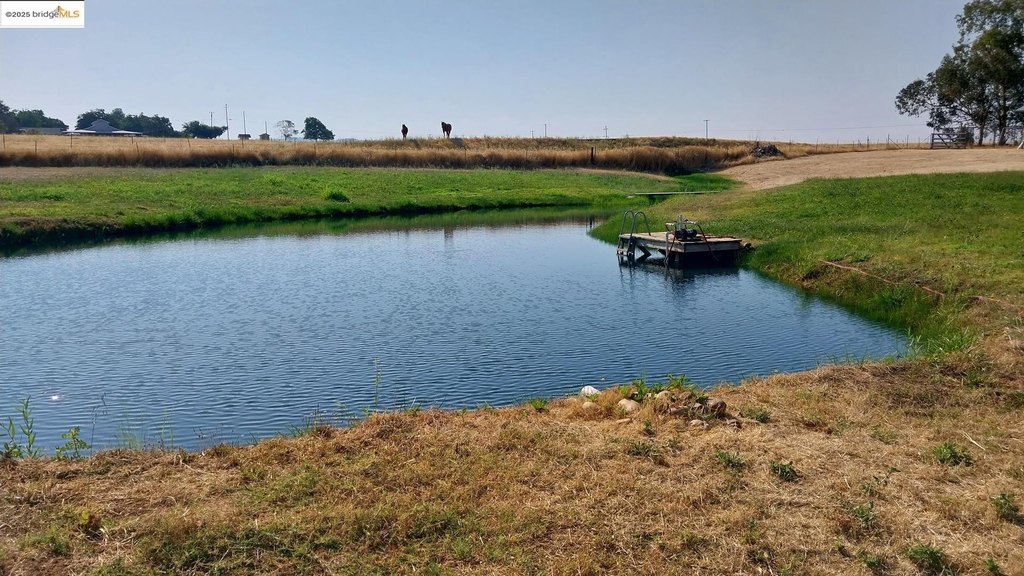
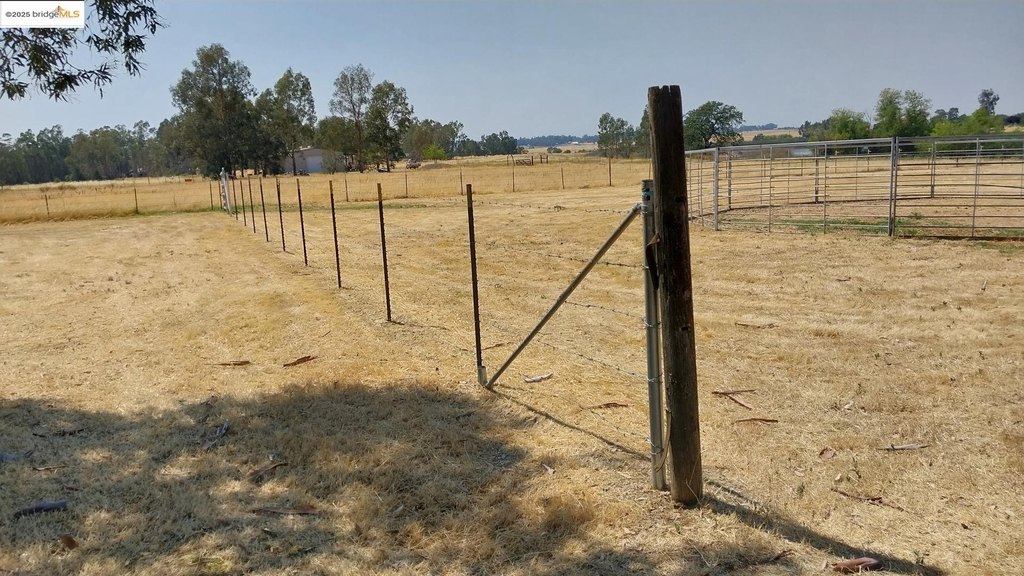
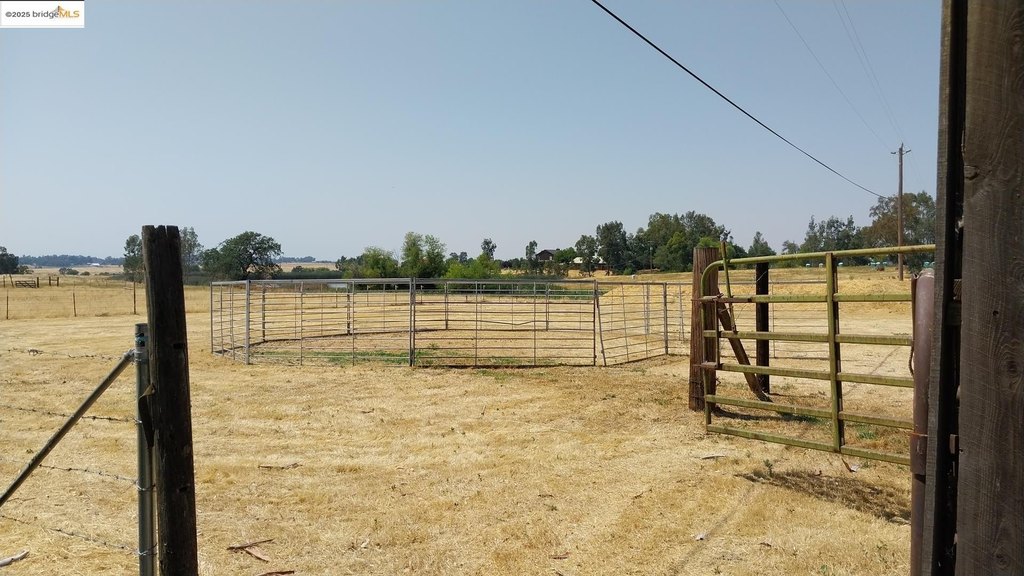
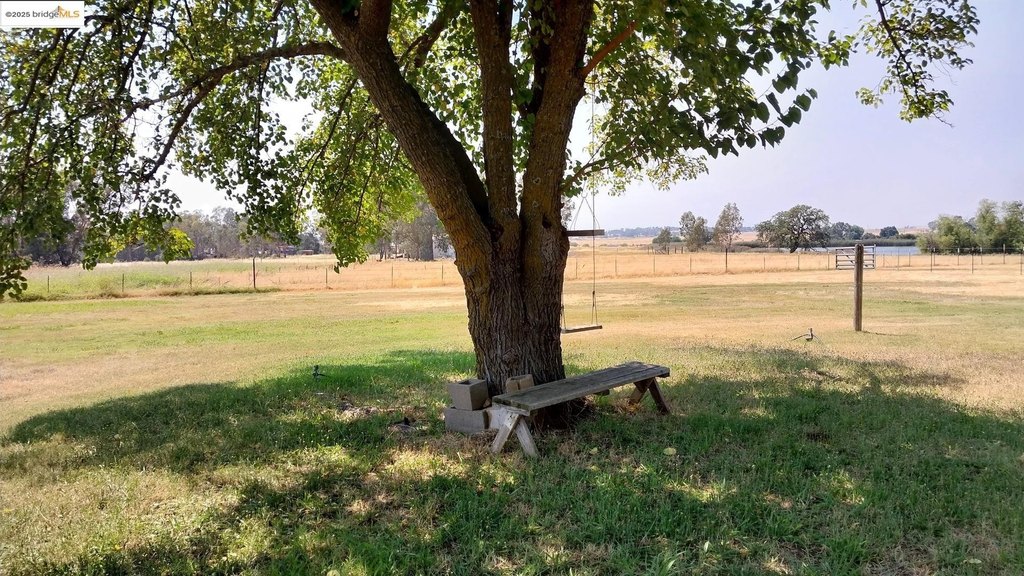
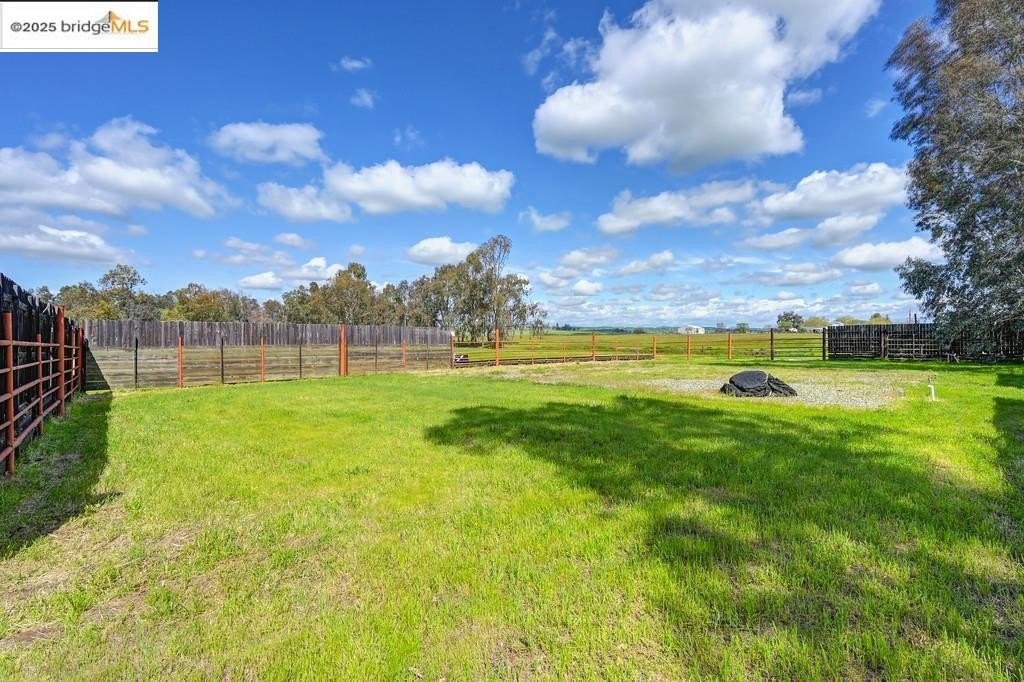
The property sits on 4.8 acres and is mostly level, with a pond that is fed by irrigation water. Fish mentioned include bass, bluegill, and catfish. There is also a 1,000 square foot barn, and the parcel is fenced and cross-fenced with barbed wire. Zoning is FARM, with well and private water noted, and septic tank/engineered septic provided.
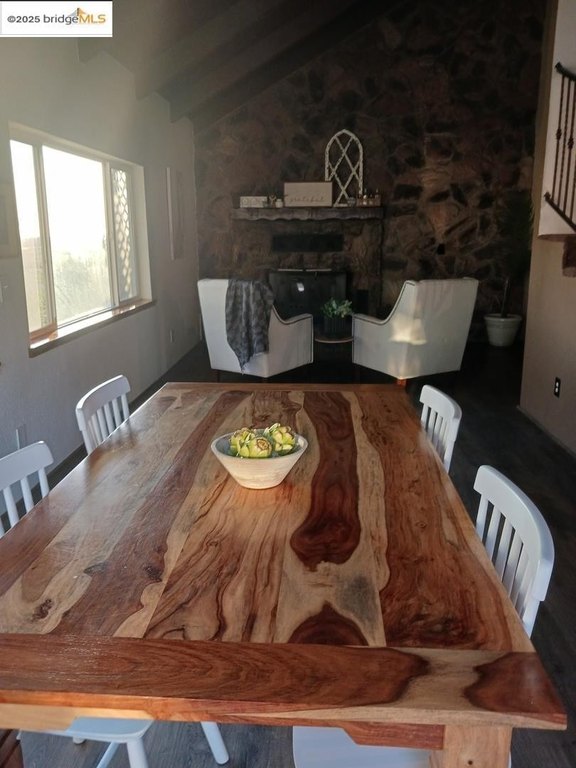
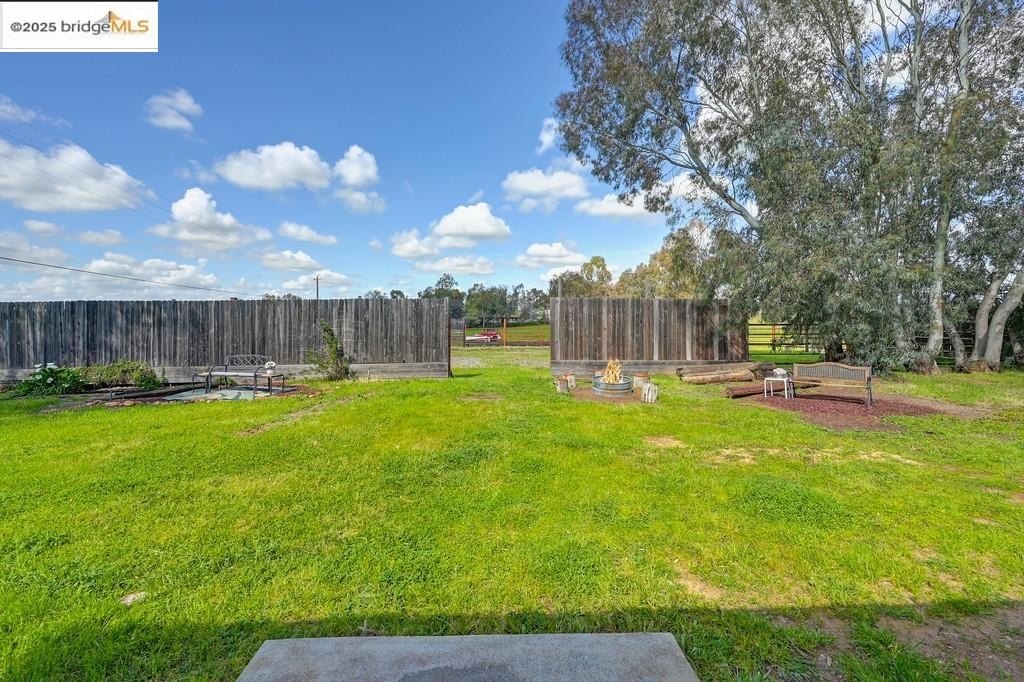
Interior amenities described include updated finishes and open beam ceiling features, electric water heater, washer/dryer, and fireplace(s) with fireplace insert. Parking features include RV parking, and the listing also mentions dog run exterior space.
The property sits on 4.8 acres and is mostly level, with a pond that is fed by irrigation water. Fish mentioned include bass, bluegill, and catfish. There is also a 1,000 square foot barn, and the parcel is fenced and cross-fenced with barbed wire. Zoning is FARM, with well and private water noted, and septic tank/engineered septic provided.
Interior amenities described include updated finishes and open beam ceiling features, electric water heater, washer/dryer, and fireplace(s) with fireplace insert. Parking features include RV parking, and the listing also mentions dog run exterior space.
Key Highlights
- Two fully separate houses with their own power meter, address, and separate septic
- 4.8 acres mostly level with an irrigation‑water‑fed pond
- 1,000 sq ft barn plus fenced and cross‑fenced yard with barbed wire
Financial Insights
Estimated NOI and Cap Rate
NOI / Yr
$47,633
Cap Rate
4.11%
Suggested Prices Based on Cap Rates
Cap Rate 5%
$952,660
$952.7K
Cap Rate 7%
$680,471
$680.5K
Cap Rate 9%
$529,256
$529.3K
Market Conditions
NOI Build-Up for 3,092 SF
Gross rent
$91.6K $29.64/SF
− Vacancy
−$5.0K −$1.63/SF
EGI
$86.6K $28.01/SF
− OpEx
−$39.0K −$12.60/SF
NOI
$47.6K $15.41/SF
Area
Placer County, CA
Vacancy
5.50%
Lease Rate
$29.64 /SF/Yr
Expense Ratio
45.00%
Simulate Cap Rate and NOI
Suggested Prices Based on Cap Rates
Cap Rate 5%
$952,660
Cap Rate 7%
$680,471
Cap Rate 9%
$529,256
Alternative Uses
Best Use
Apartment 5plus
$680.5K
$595.4K – $793.9K
NOI $47,633 @ 7.0% cap · market cap 4.11%
Second Best
—
—
no second resolved use
Theoretical Best
Office A
$1.20M
$1.05M – $1.40M
NOI $83,790 @ 7.0% cap · market cap 7.22%
Zoning and permitted uses should be independently verified with authorities.
Property Analytics
Unlock full access to Insights
Subscribe to Realmo Intelligence
Open Analytics
Current Use
Lease Details
2
Residential units
Yes
Paved road access
Yes
Utilities to site
Location Intelligence
Trade Area within ½ mile
2
Businesses Nearby
Explore this area
Business Placement
Demographics for 95648, CA
54,483
Population
22,095
Households
2.5
Avg Household Size
45
Median Age
38%
College-Educated
94%
High-School Grad
144.3 sq mi
ZIP Area
378
Density / Sq Mi
$108,200
Median Household Income
$58,255
Median Earnings
$2,054
Median Rent
$635,200
Median Home Value
Check the figures for this property
Cap Rate, Value Estimation, Potential NOI and more
View Realmo Analytics
Market
Vacancy Rate% for Multifamily in West region

Questions? Ask Rey
Realmo’s AI knows this listing — price, zoning, demand, history. Ask anything.


Frequently Asked Questions
What type of property is this?
Multifamily property - Two separate homes on a pond-fed, fenced lot with well water and engineered septic, zoned FARM.
Where is this multifamily property located?
The property is located at 1408 Riosa RD Lincoln, CA.
What is the asking price?
The asking price for this property is $1,160,000.
What are key features of this property?
This property features: Two fully separate houses with their own power meter, address, and separate septic; 4.8 acres mostly level with an irrigation‑water‑fed pond; 1,000 sq ft barn plus fenced and cross‑fenced yard with barbed wire



