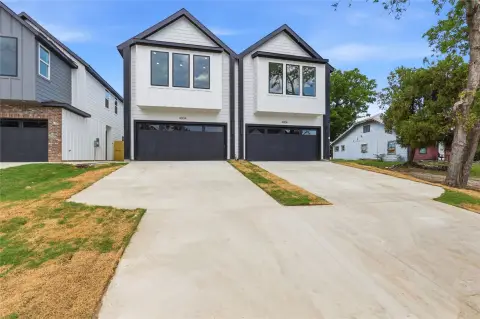
Two-Residence Duplex with
For Sale
$924,900
13740 Vida Lane, Dallas, TX 75253
ResidentialIncome, Dallas, TX
Property Size4,418 SF
Lot Size2.42 Acres
Price / SF$209.35
Days on Market62
Property Features for 13740 Vida Lane
General Information
Property type
Residential Multi Family
Property subtype
Other
Bedrooms
8
Bathrooms
6
Full bathrooms
5
Half bathrooms
1
Rooms
Bedroom 2, Bathroom 3, Bathroom 6, Bedroom 6, Bedroom 3, Bedroom 8, Bedroom 5, Bedroom 1, Bathroom 4, Bathroom 2, Bedroom 7, Bathroom 1, Bathroom 5, Bedroom 4
Parking
10
Parking features
Oversize, Garage, Gated, Open, Driveway, Guest, Carport
Interior features
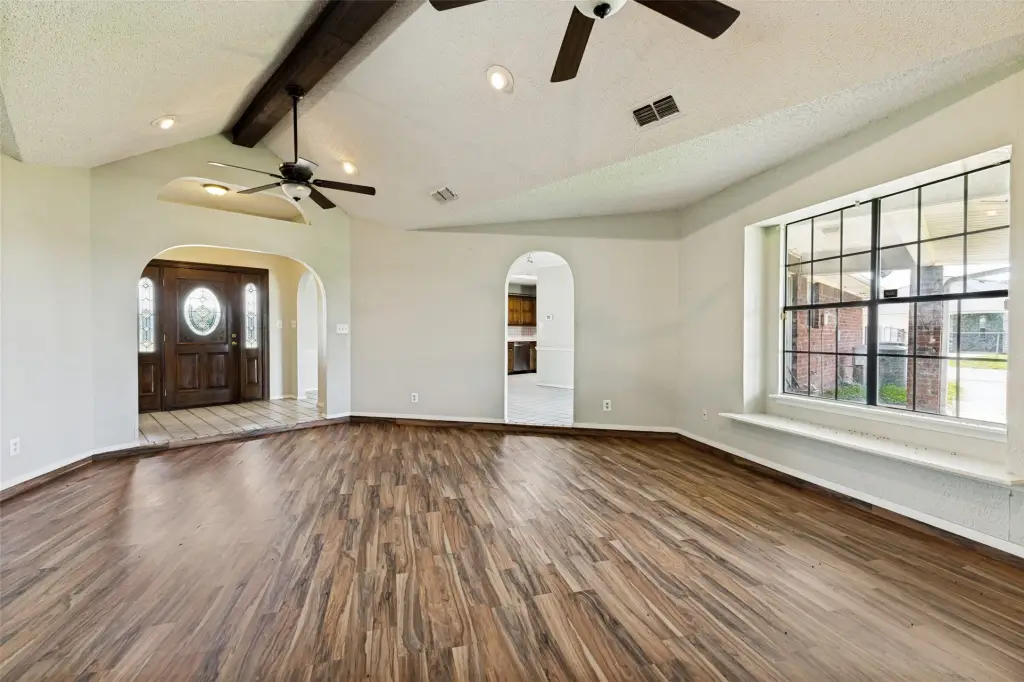
DecorativeDesignerLightingFixtures, GraniteCounters, HighSpeedInternet, MultipleMasterSuites, Pantry, CableTv, VaultedCeilings, WalkInClosets
Exterior features
RainGutters
Fencing
Fenced
Fireplace
1
Appliances
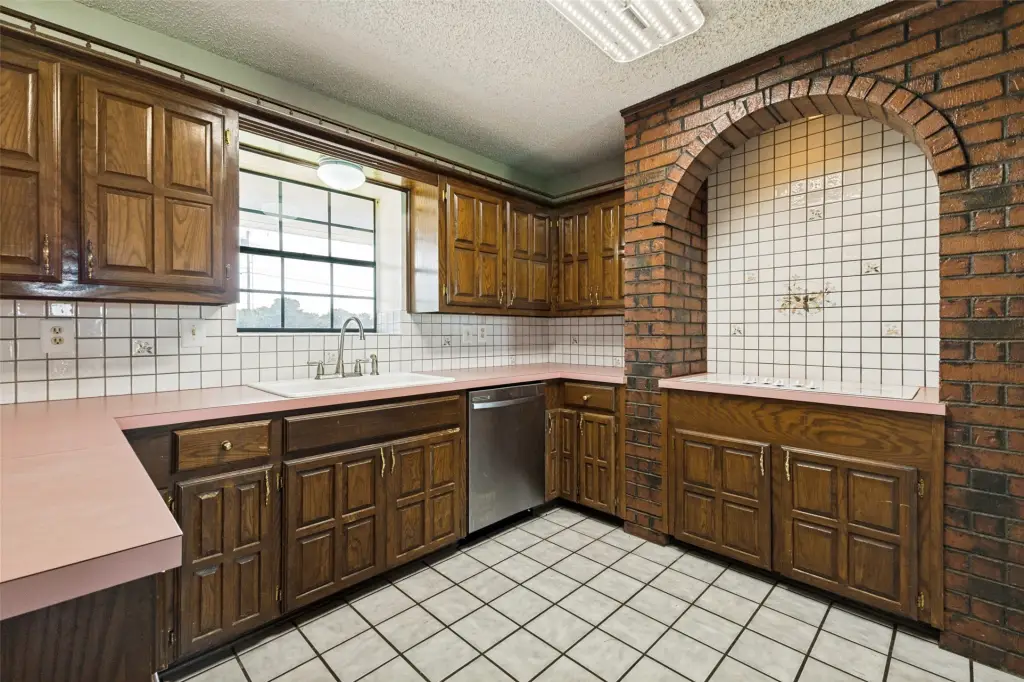
Dishwasher, ElectricCooktop, ElectricOven, ElectricWaterHeater, Disposal, Microwave, VentedExhaustFan
Lot features
Back Yard, Lawn, Landscaped, Sprinkler System, Few Trees
Elementary school
Kleberg
Middle school
Seagoville
High school
Seagoville
Elementary school district
Dallas ISD
Middle school district
Dallas ISD
High school district
Dallas ISD
Directions
GPS Friendly
Standard status
Active
APN
00000899825700000
Size
4,418 SF
Lot size
2.42 Acres
Taxes and HOA fees
Tax Description
BLK 8820 TR 289 ACS 2.42 VOL200600250336 DD06
Tax Annual Amount
15266
Legal Description
BLK 8820 TR 289 ACS 2.42 VOL200600250336 DD06
Utilities
Sewer type
Public Sewer
Heating system
Electric (Heating), Fireplace(s), Central
Cooling system
Ceiling Fan(s), Electric, Central Air
Water source
Public
Building Details
Year built
1989
Floors in Building
1
Number of units
2
Flooring type
Tile, Vinyl
Building materials
Brick
Roof type
Composition
Listing Agency:
Coldwell Banker Apex, REALTORS · Coldwell Banker Real Estate
(972) 772-9300
Listed By:
Shannon Haury · License #0535037
(469) 450-7355
Added: Aug 14
Changed: Oct 6
Last Checked: Oct 14 at 6:06PM
MLS# 21360259
Copyright © 2026 North Texas Real Estate Information Systems, Inc. All rights reserved. All information provided by the listing agent/broker is deemed reliable but is not guaranteed and should be independently verified.
Investment Insights
Based on property information with market context.
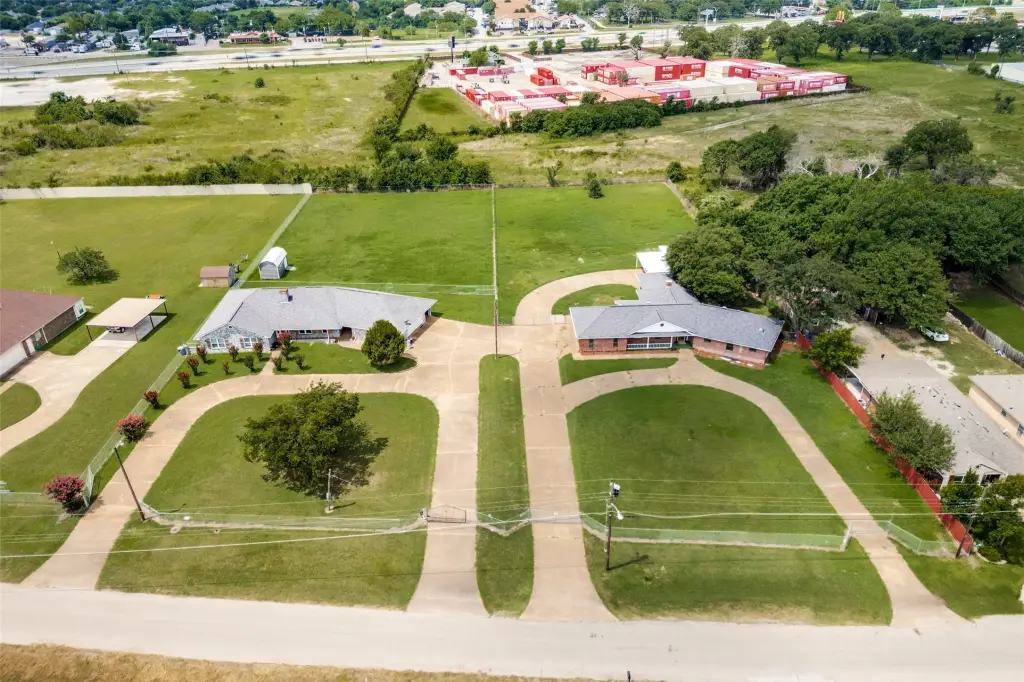
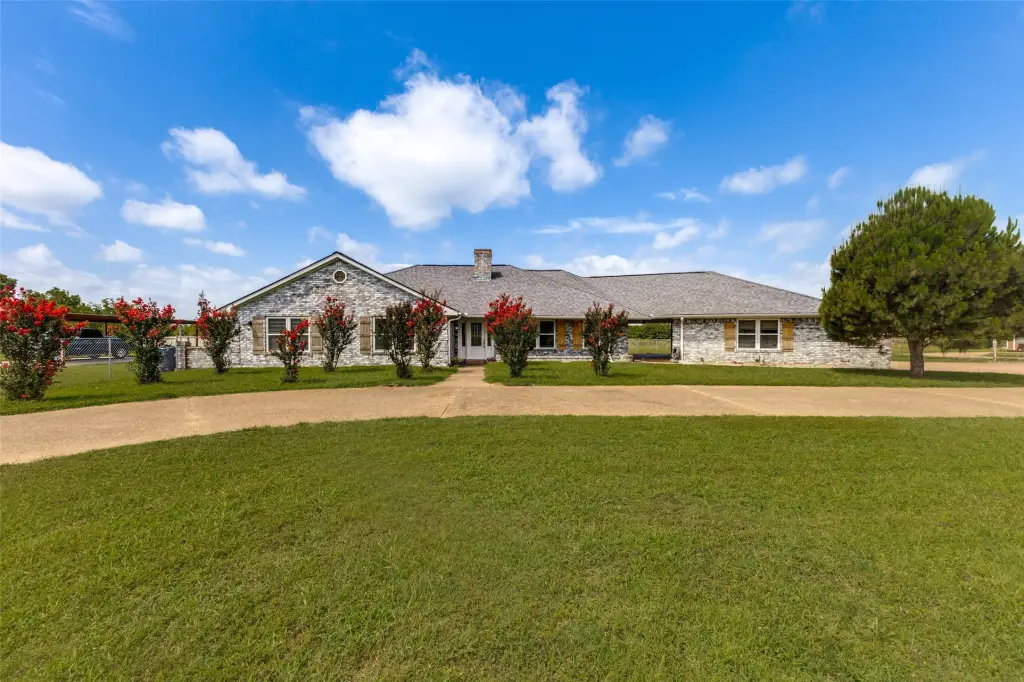
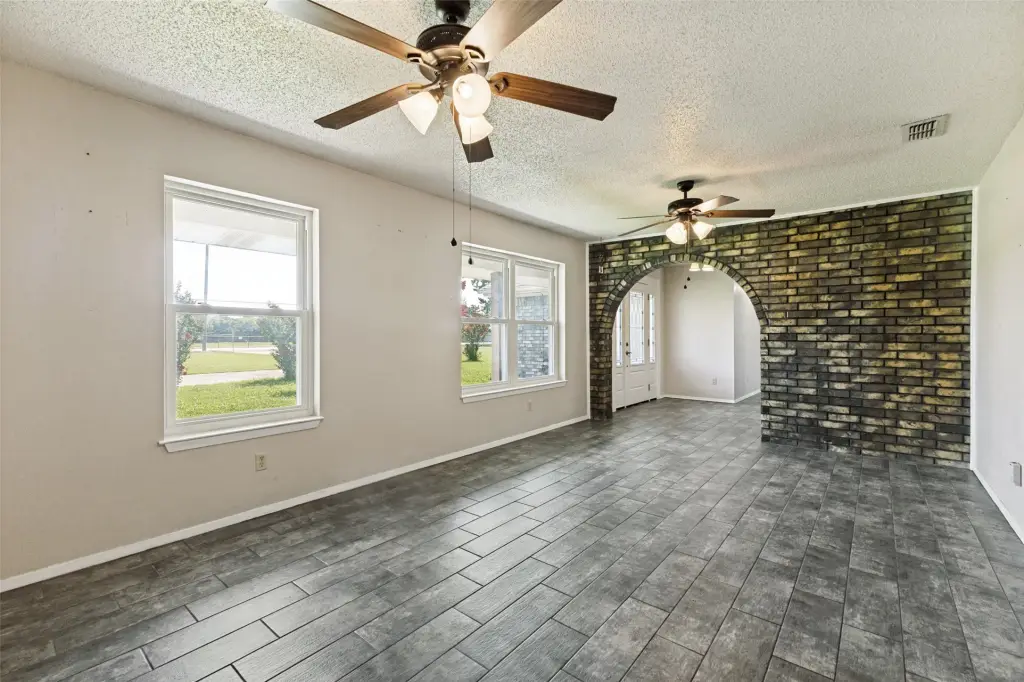
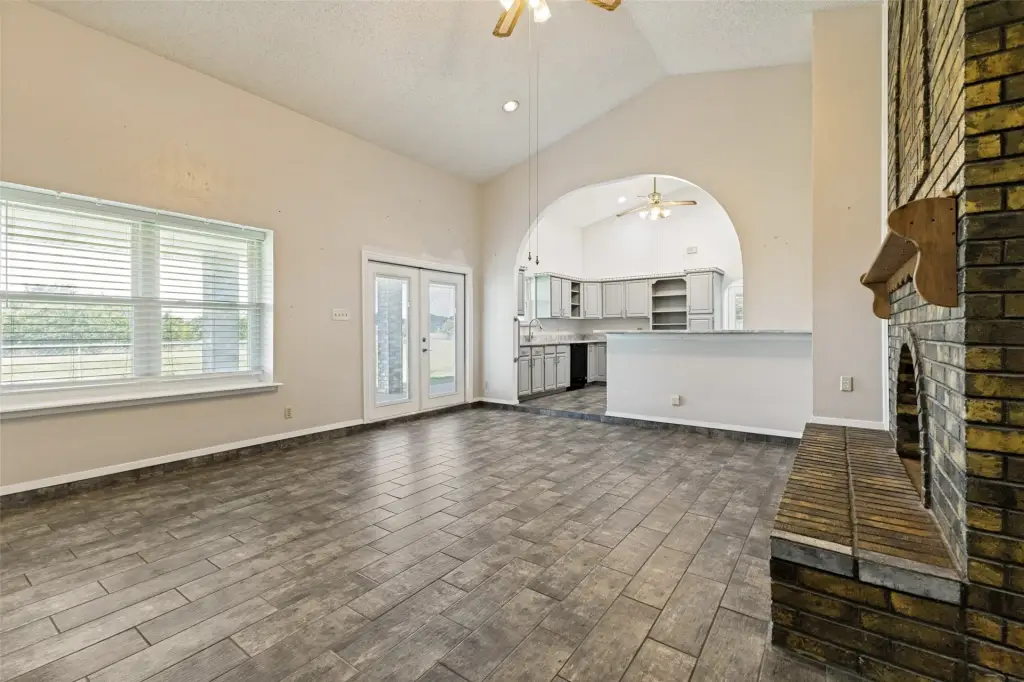
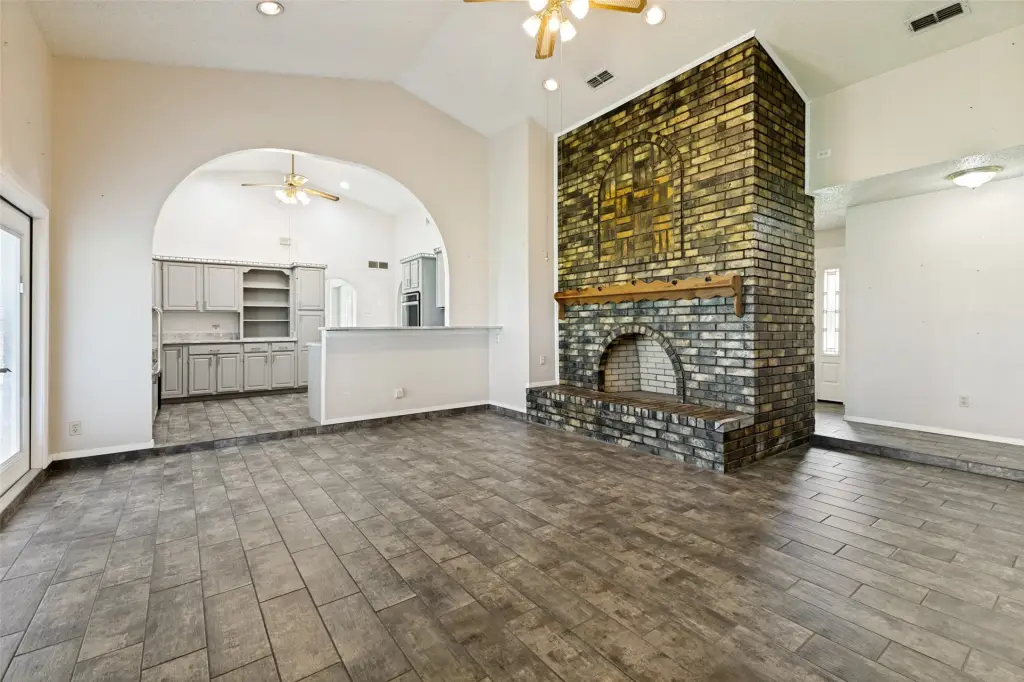
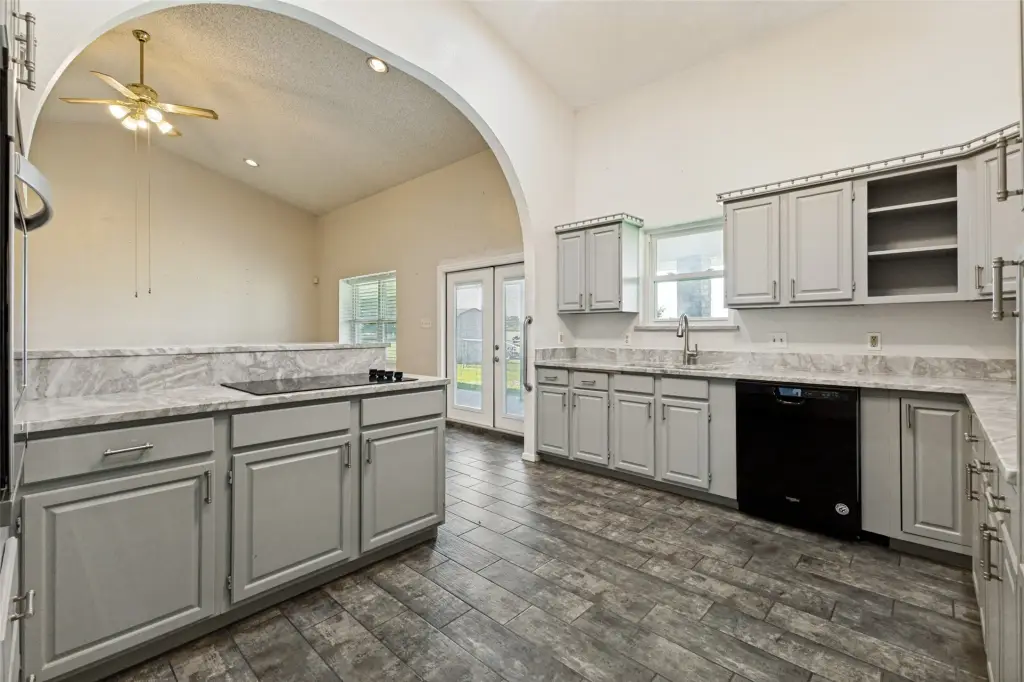
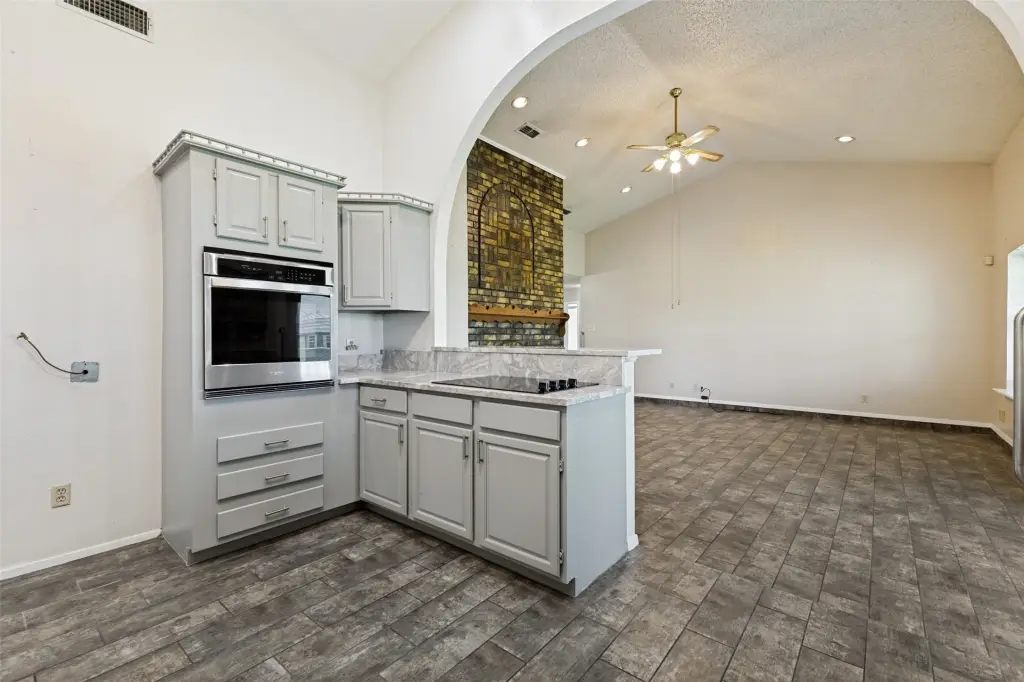
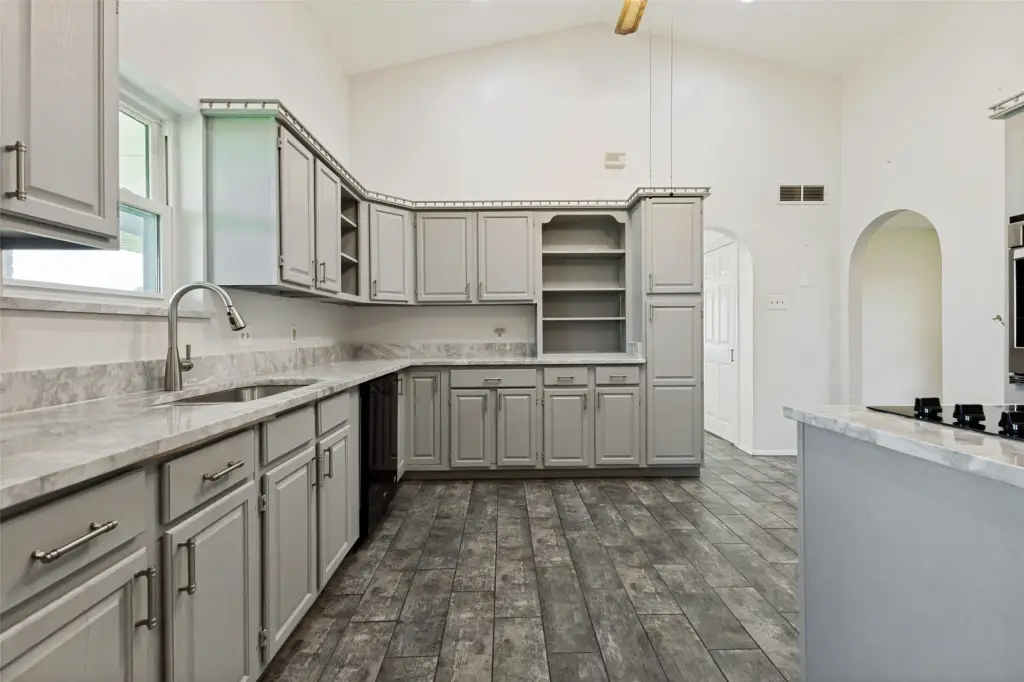
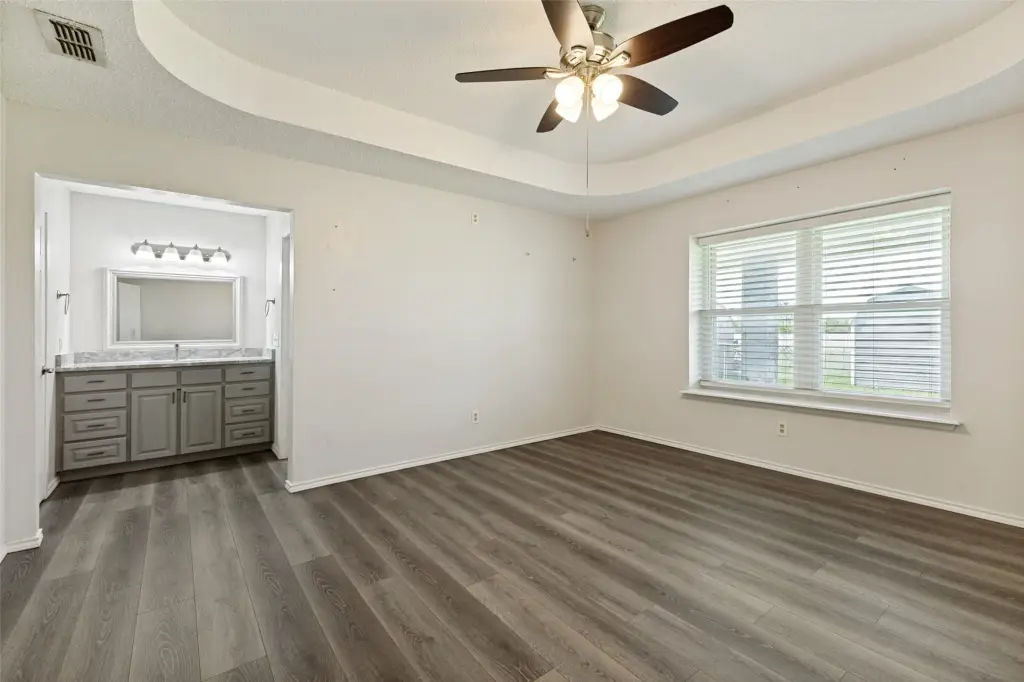
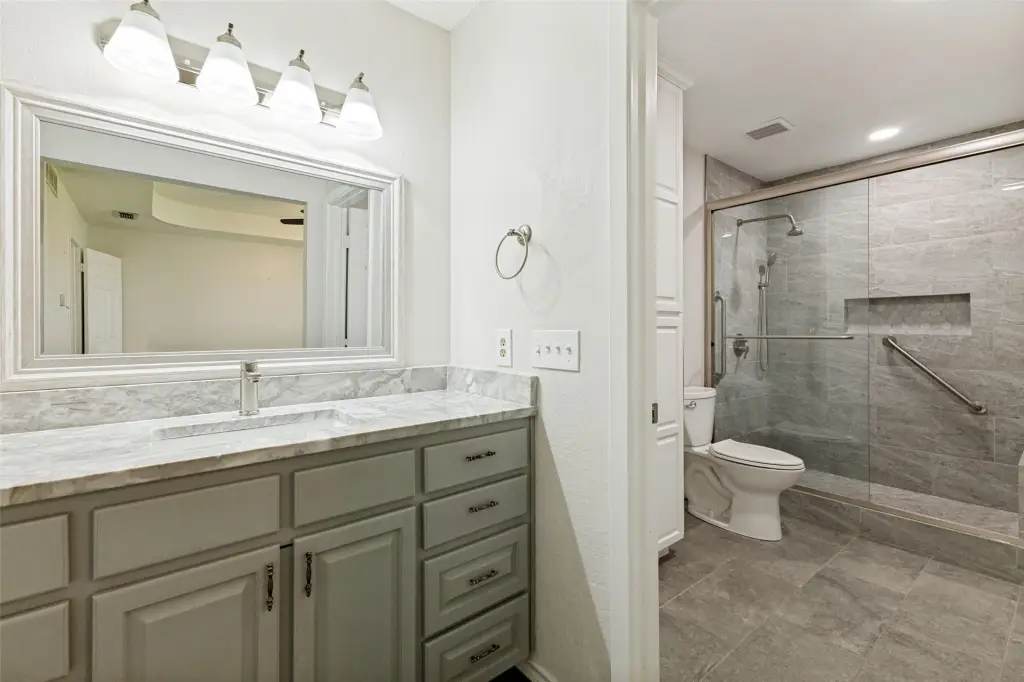
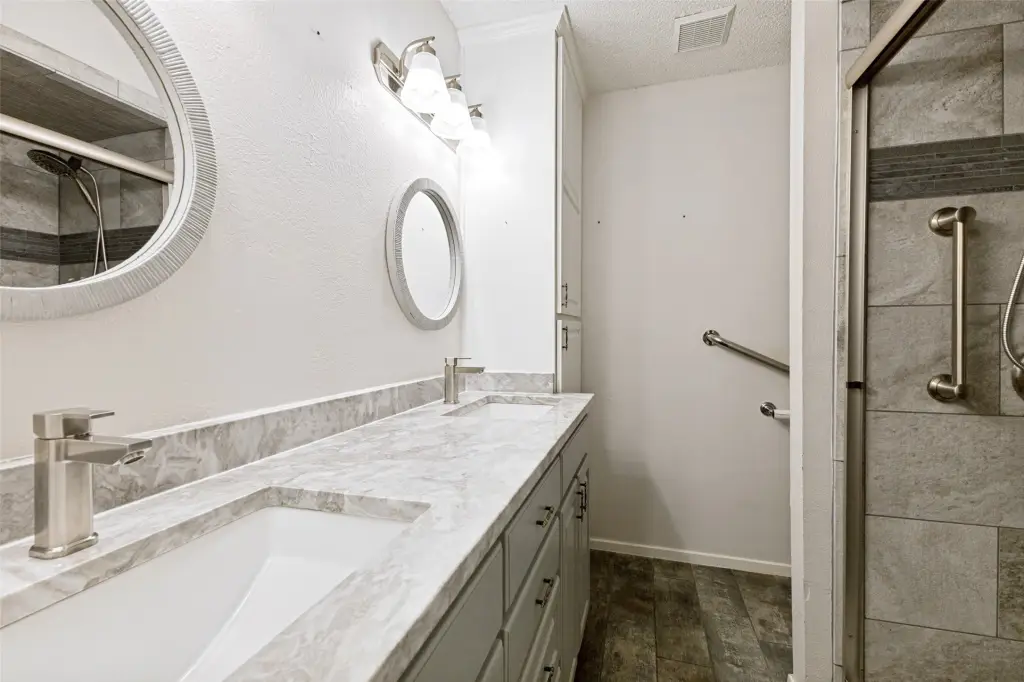
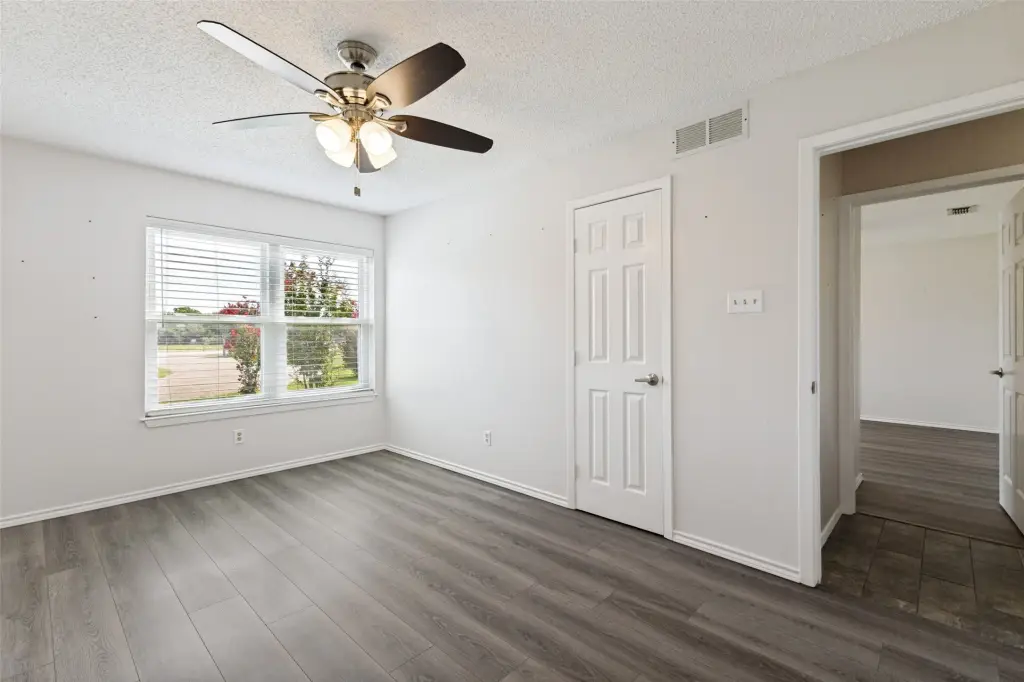
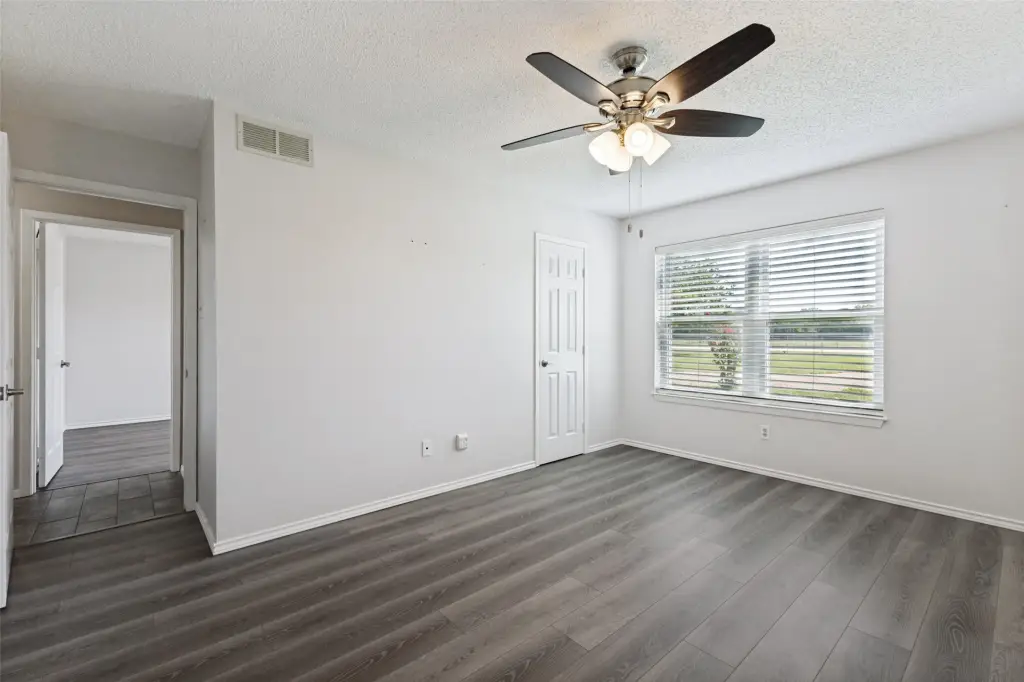
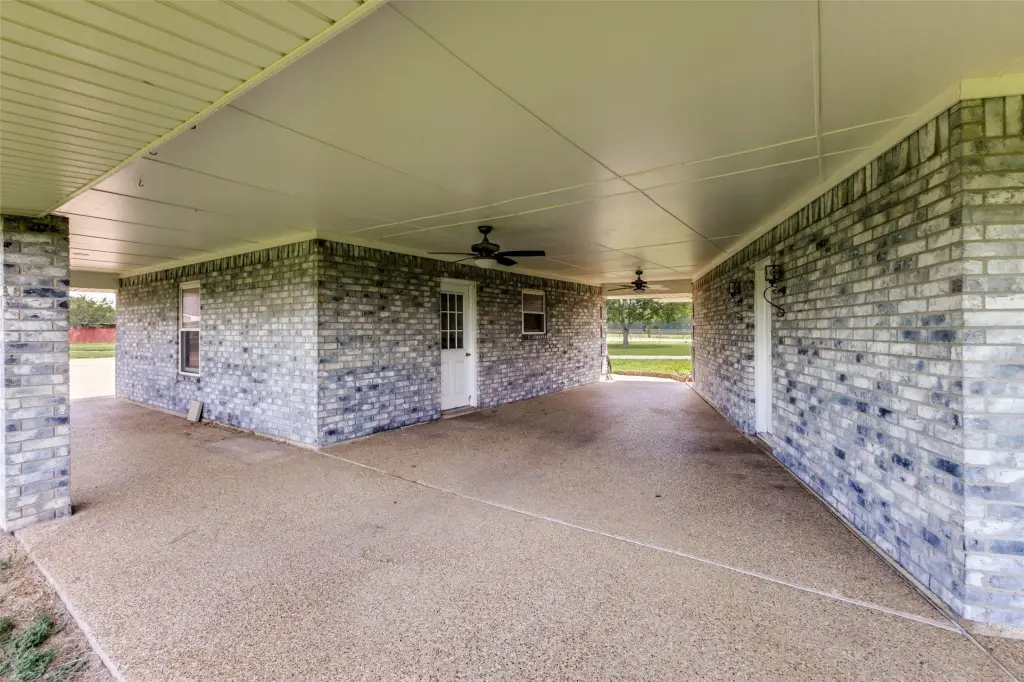
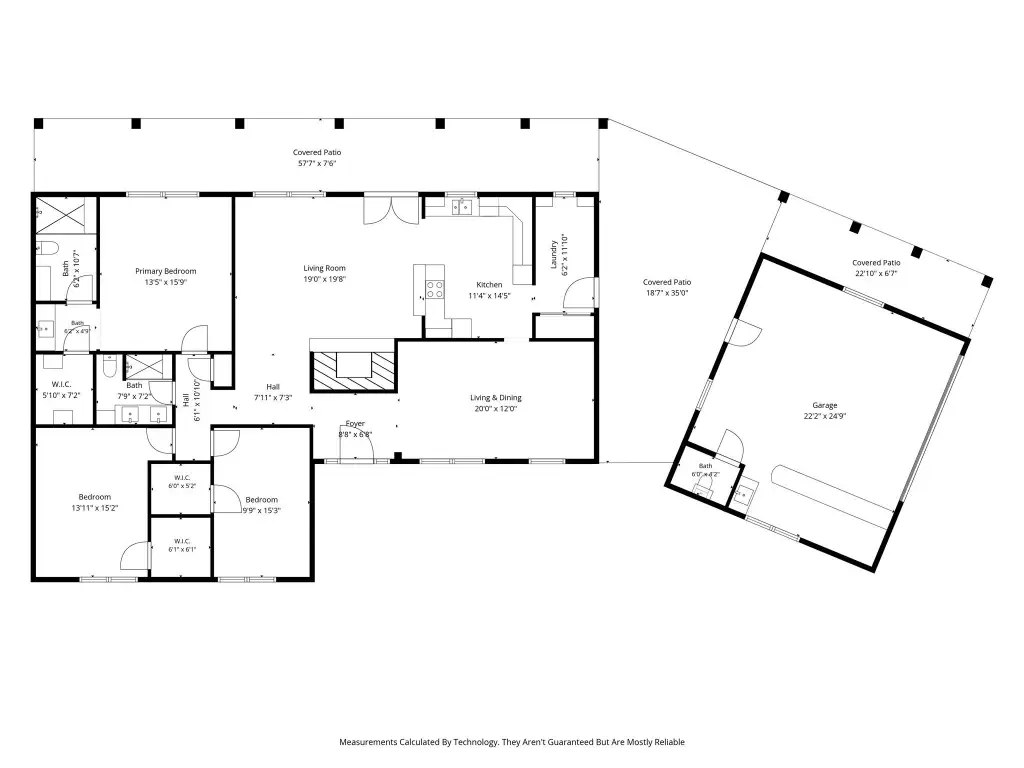
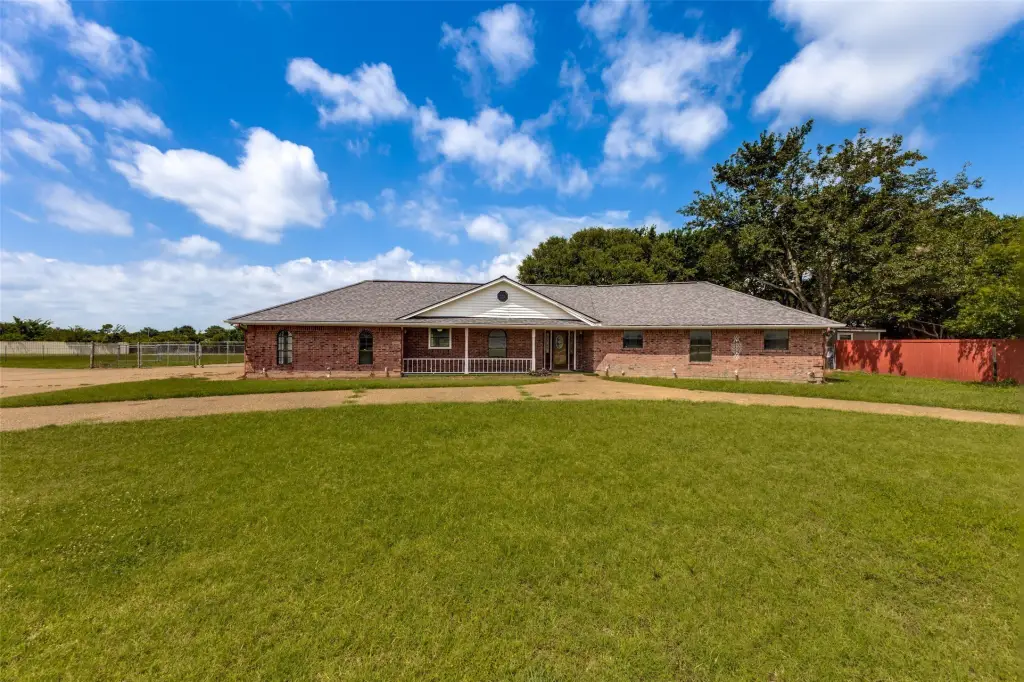
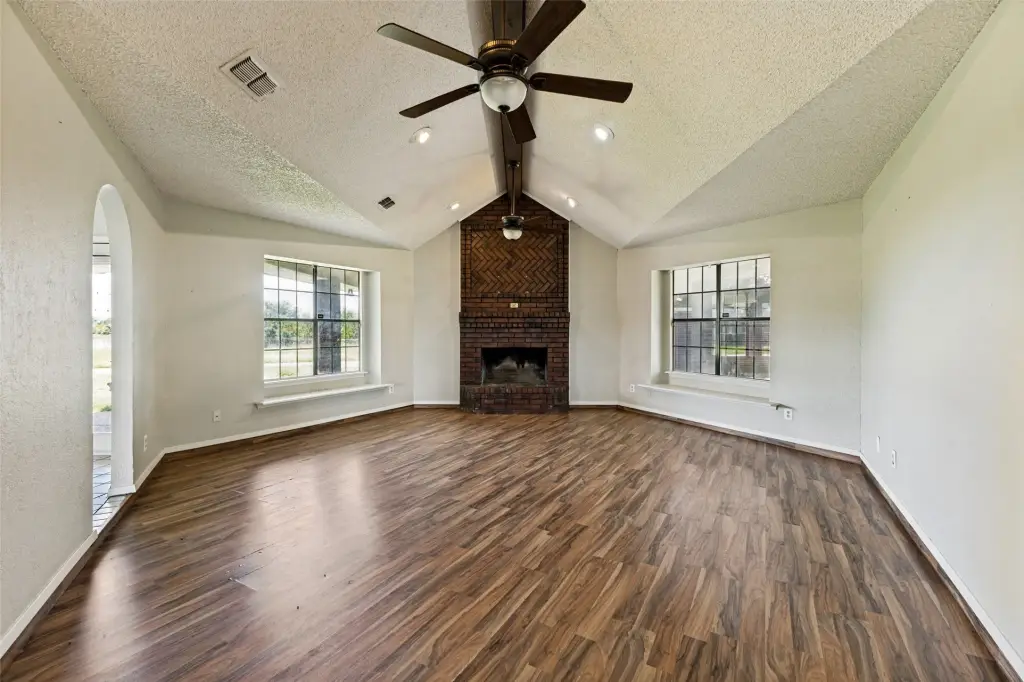
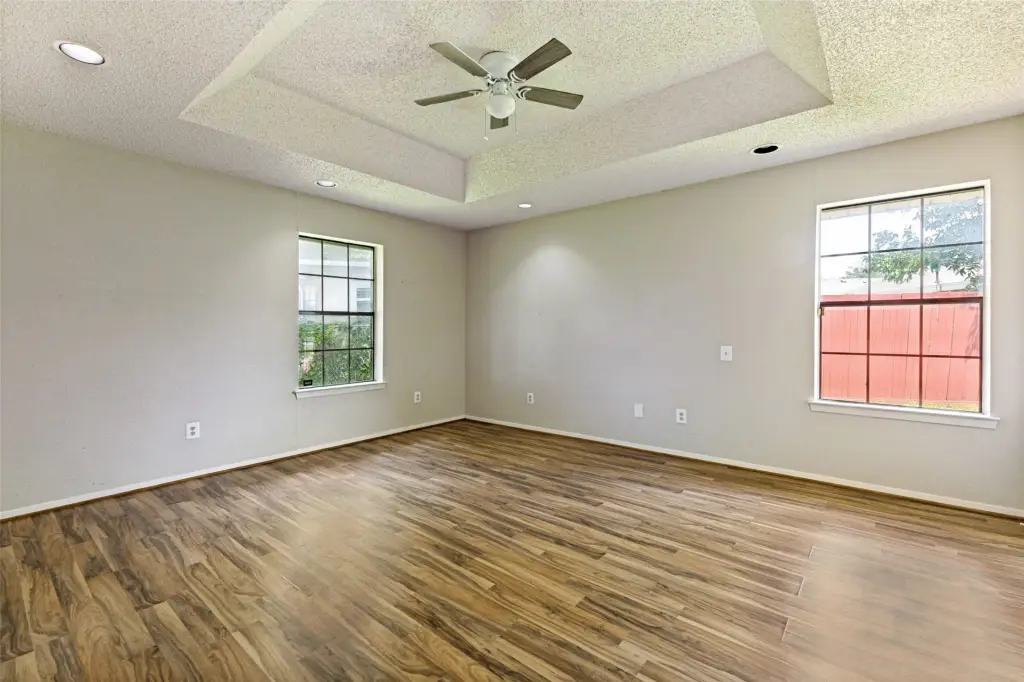
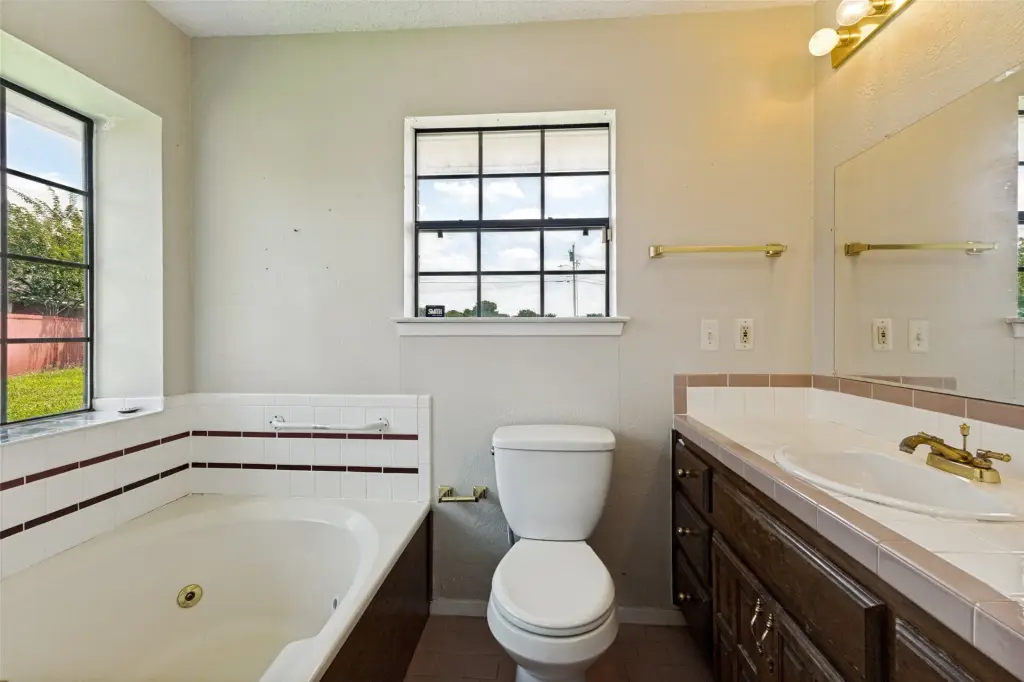
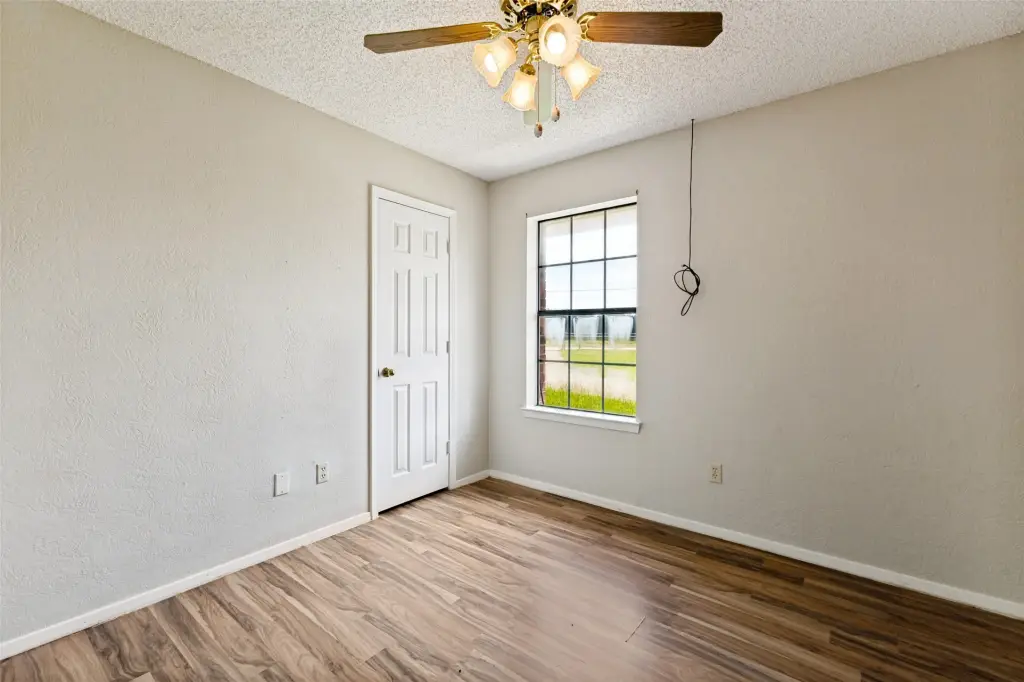
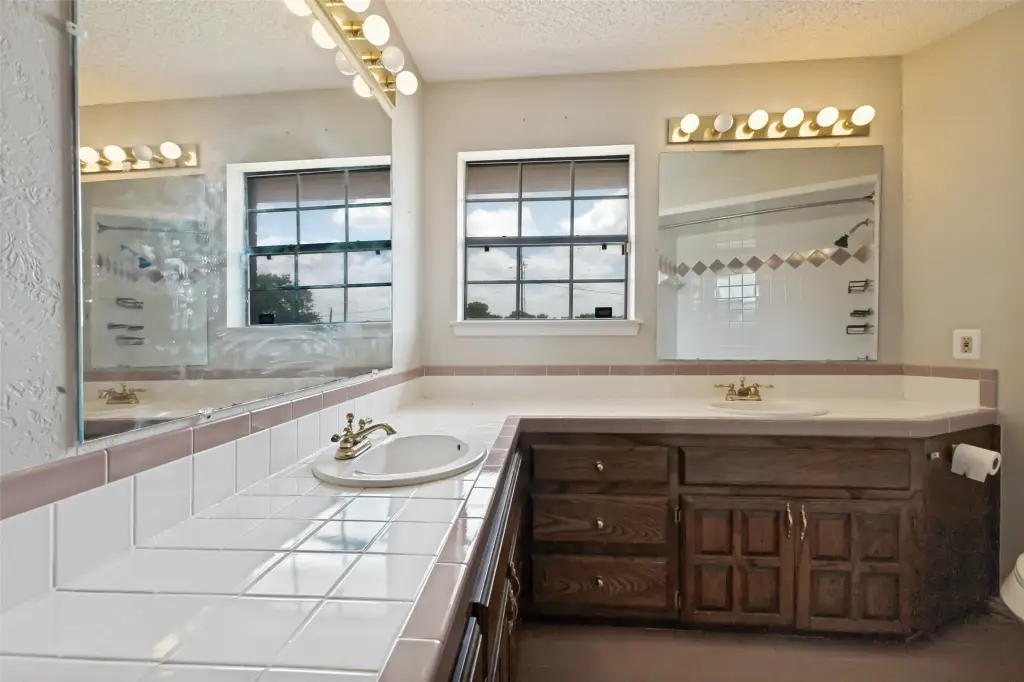
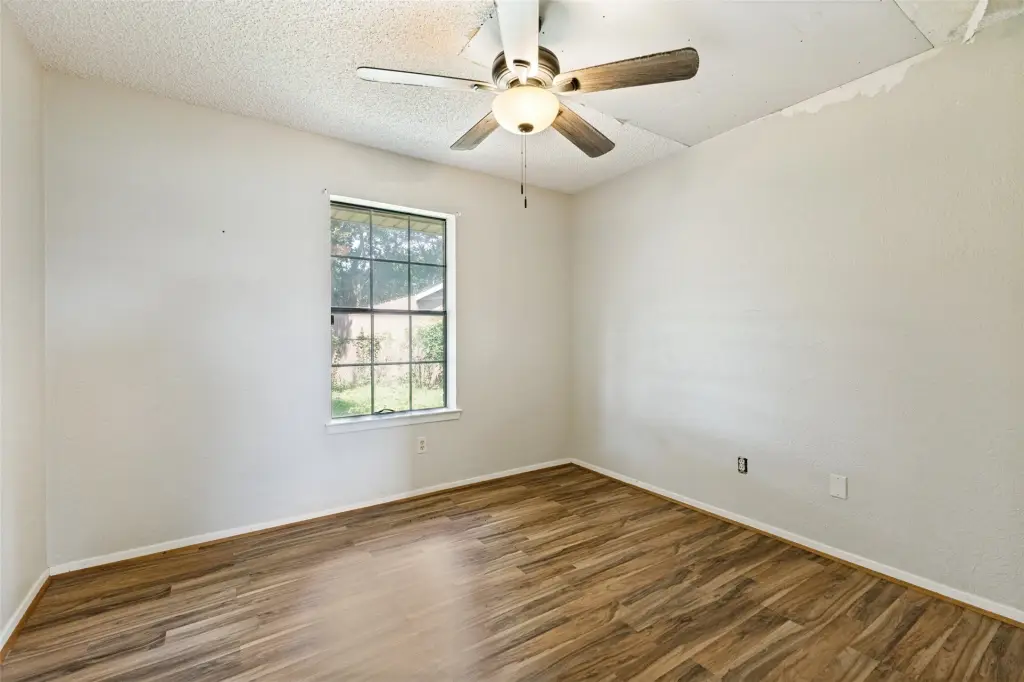
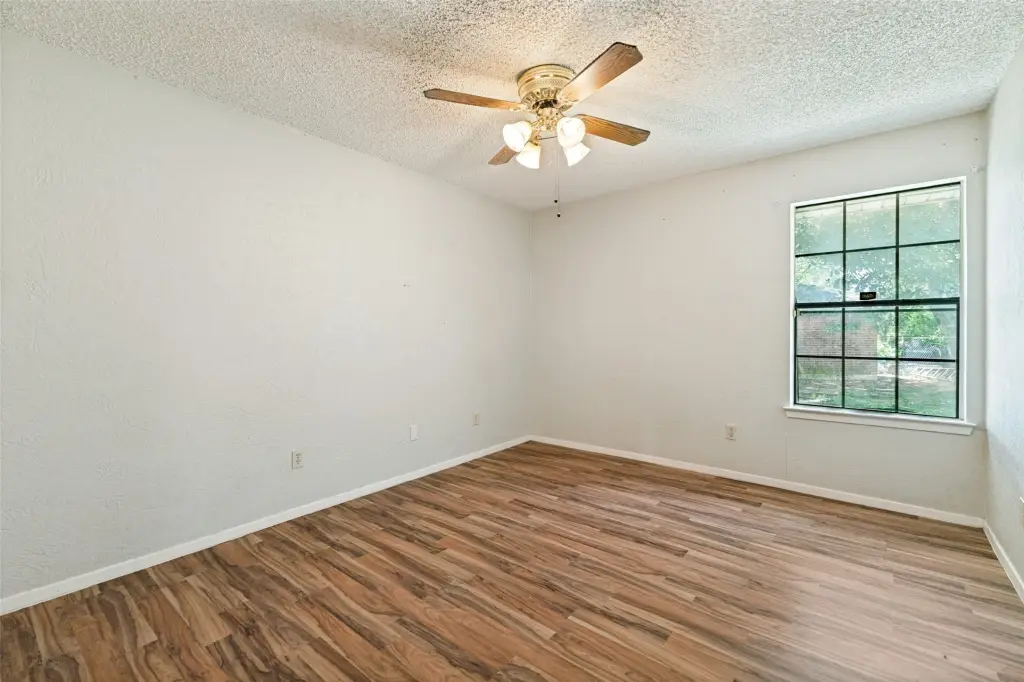
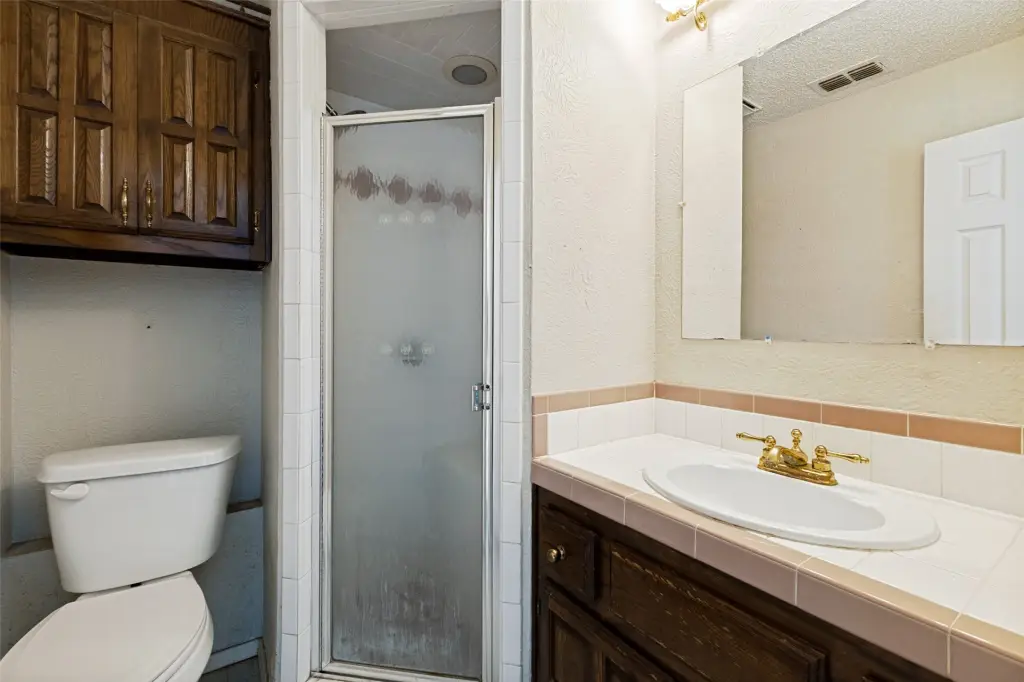
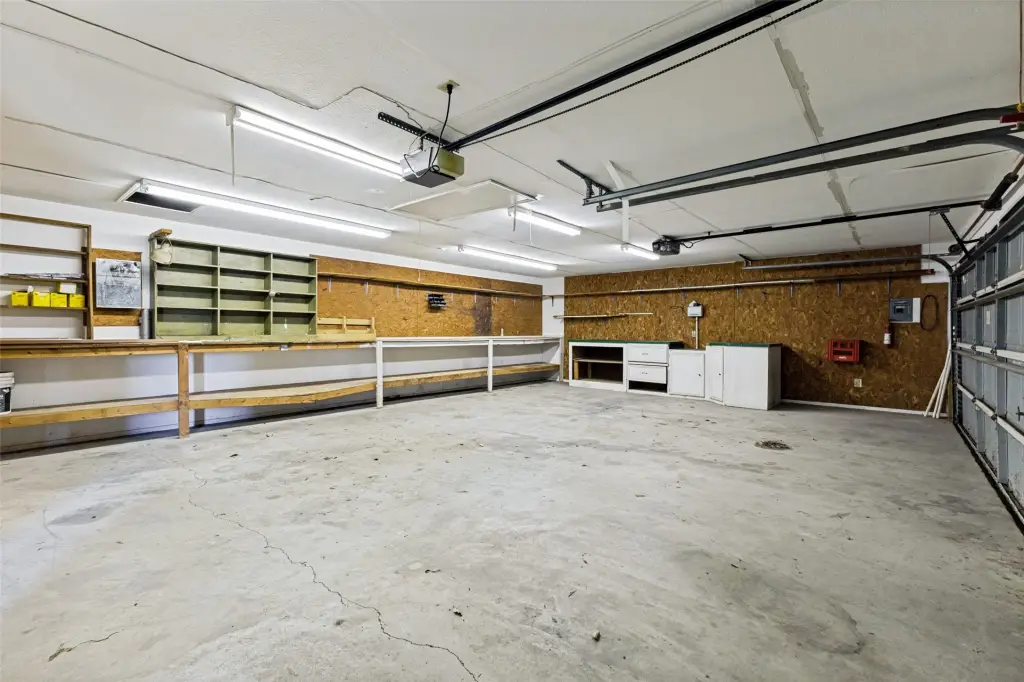
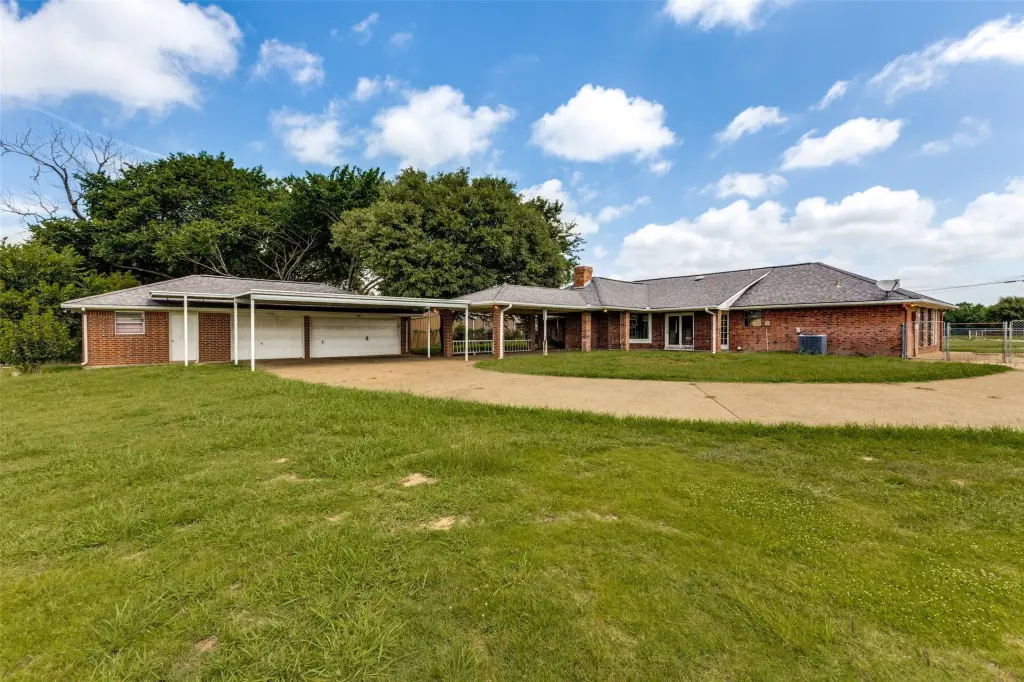
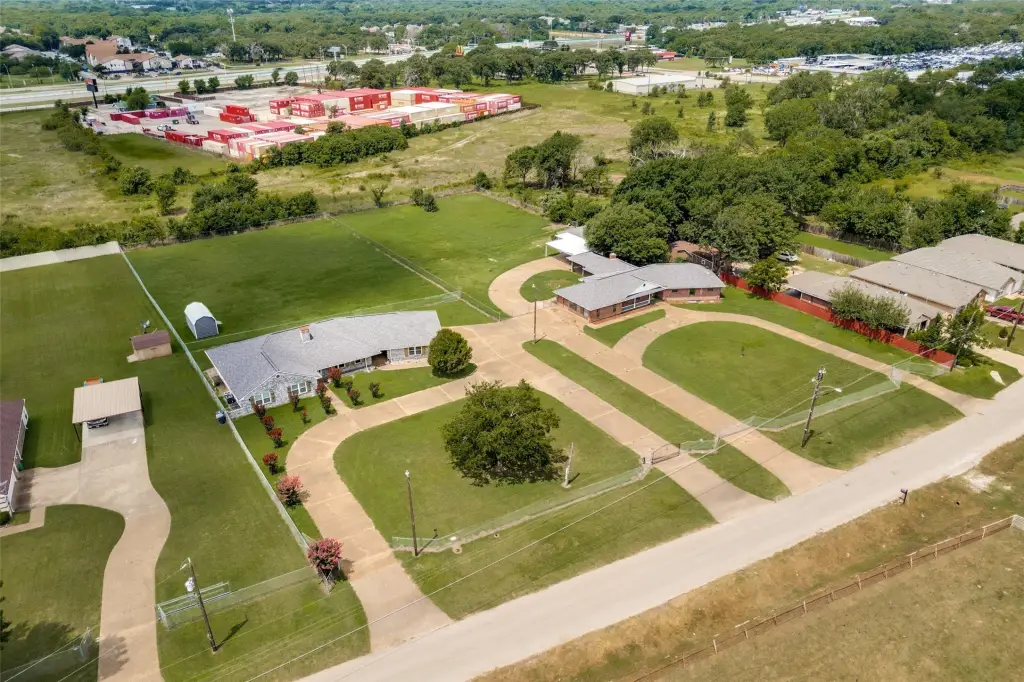
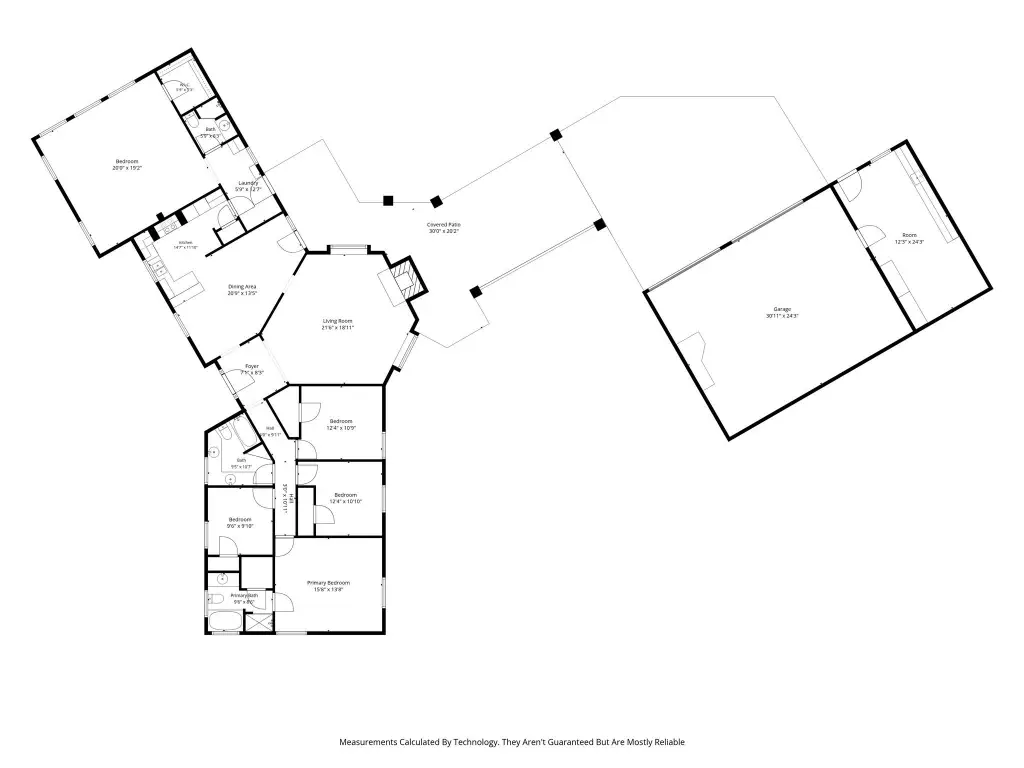
This duplex property contains two separate residences totaling 4,418 square feet on 2.42 acres. The primary home measures 1,992 square feet and was updated in 2025 with a modern kitchen, quartz countertops, stainless steel appliances, refreshed bathrooms, vaulted living space, a brick wood-burning fireplace, and luxury vinyl plank flooring in the bedrooms. It connects by breezeway to a two-car garage with a bar sink and toilet, along with covered patio space.
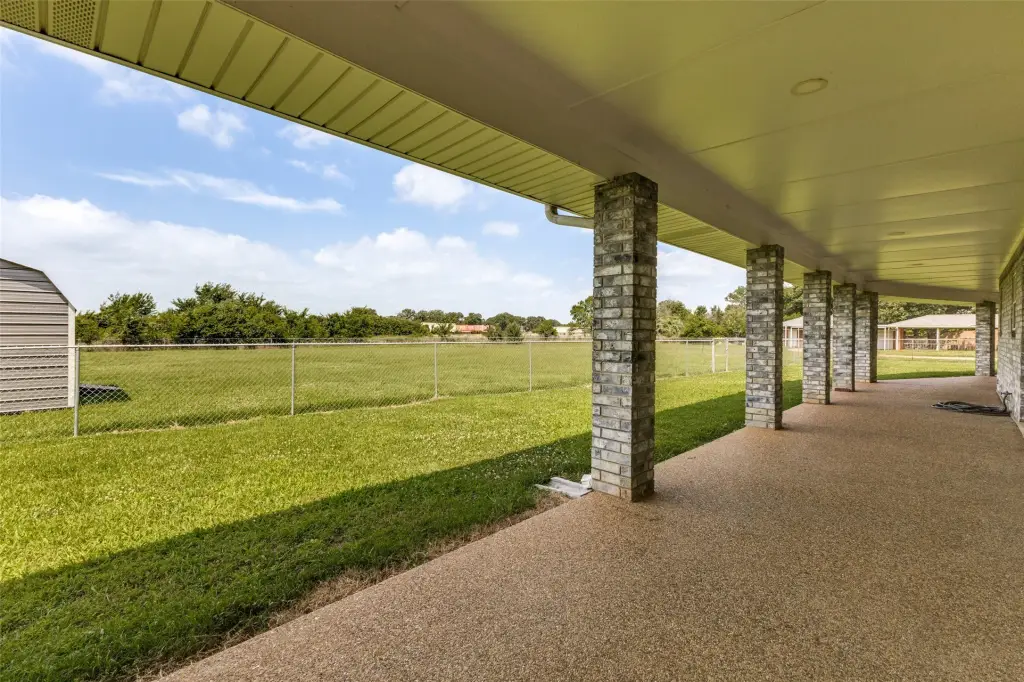
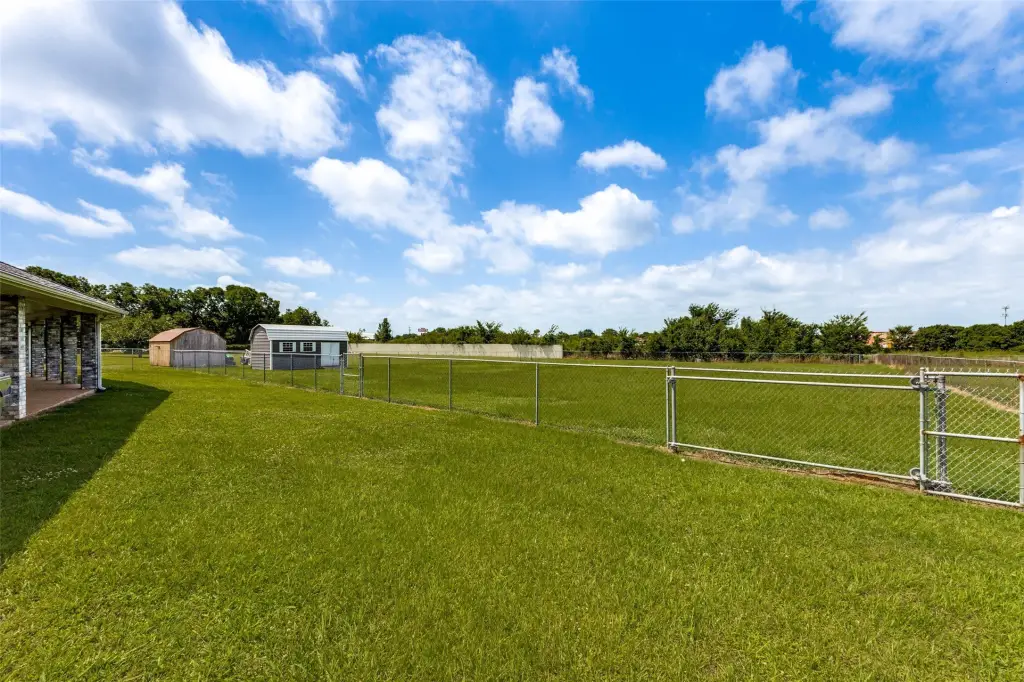
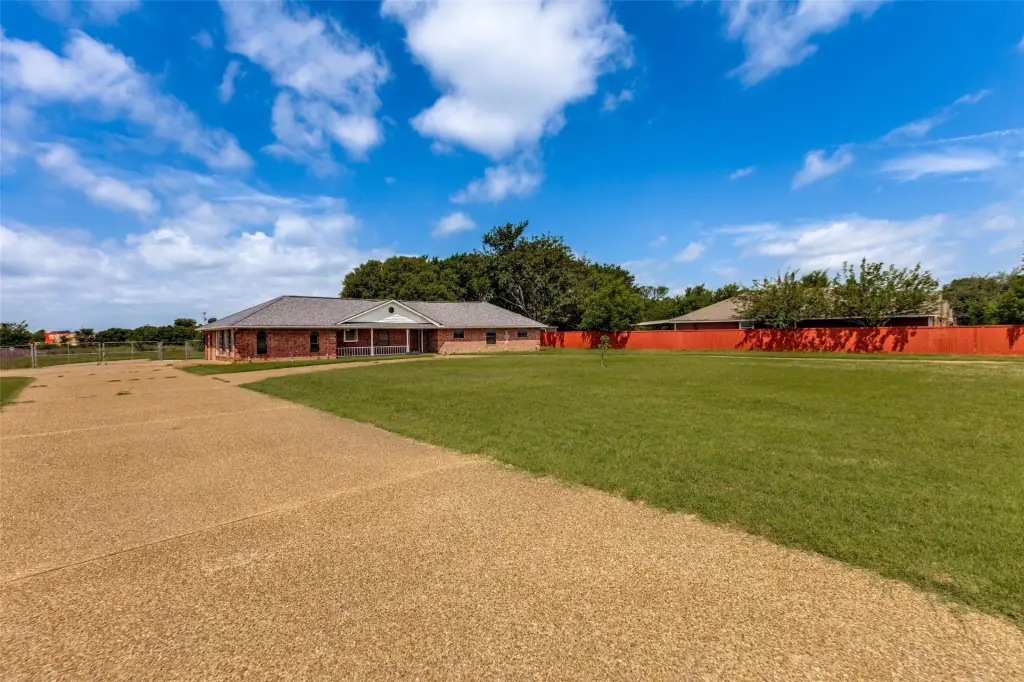
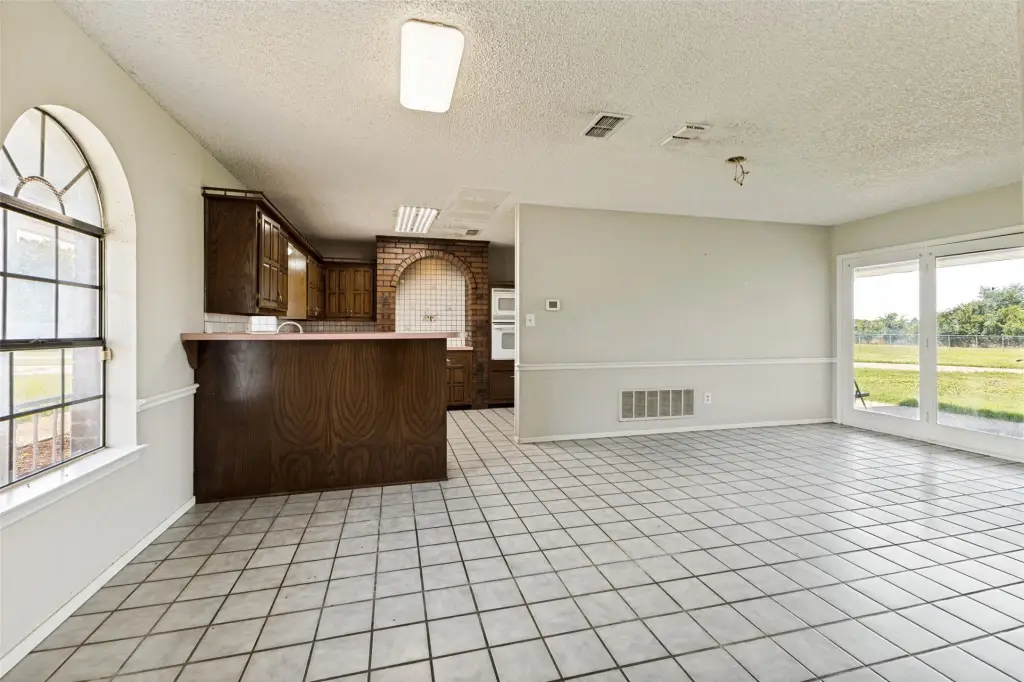
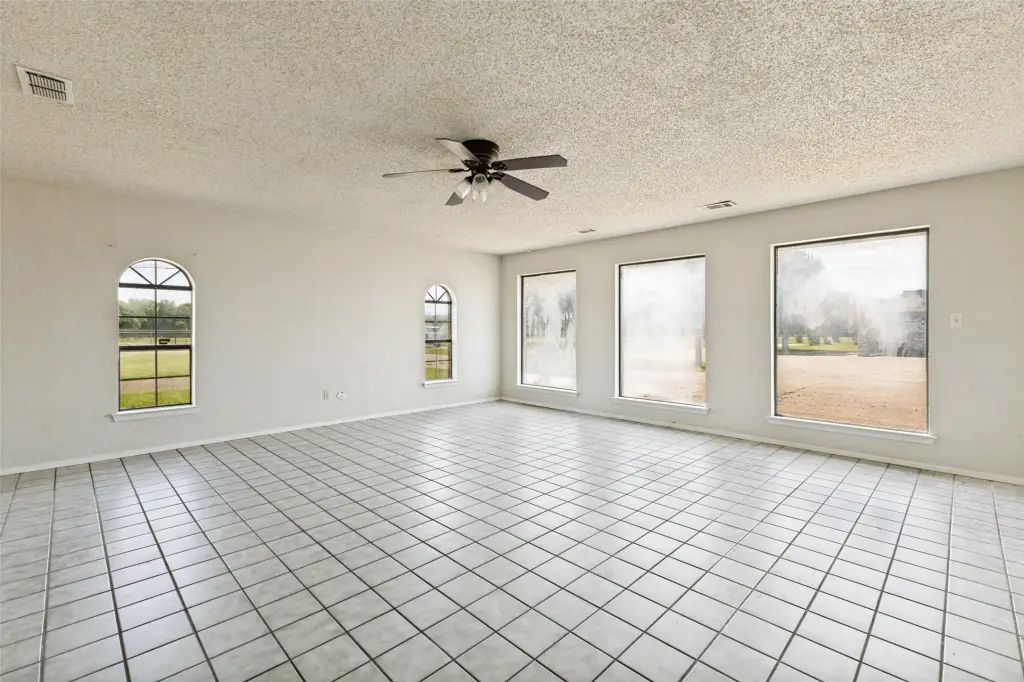
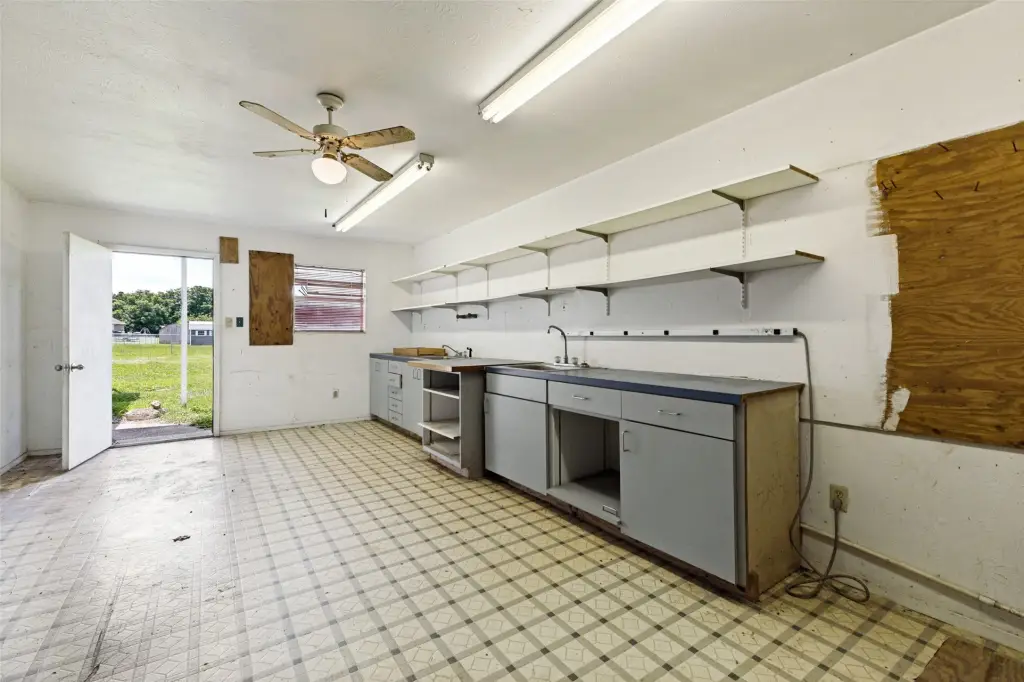
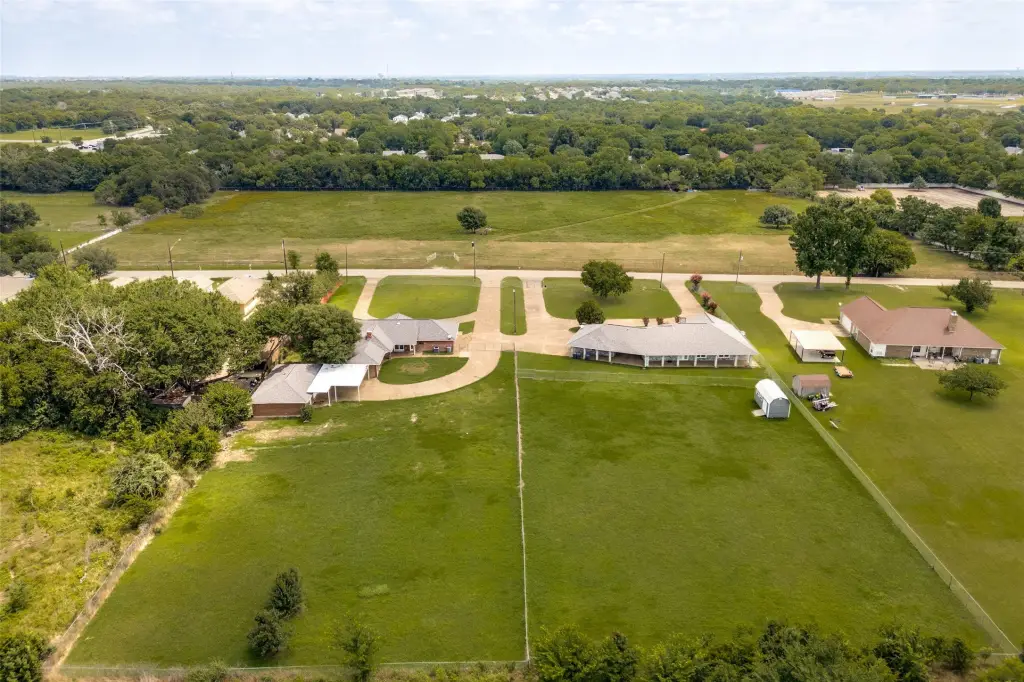
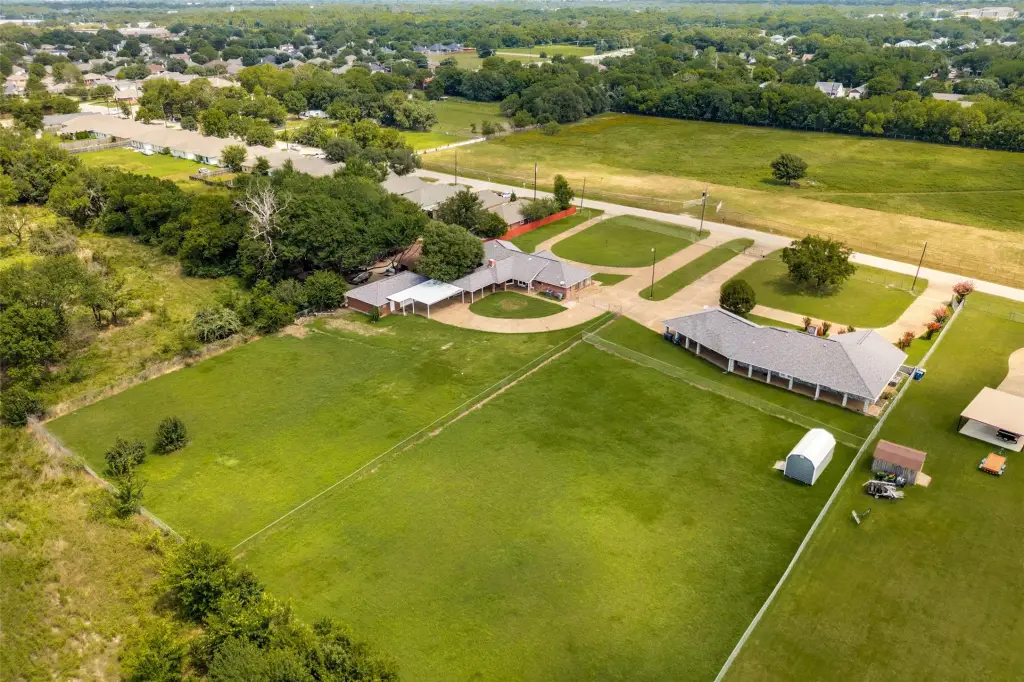
The second residence measures 2,426 square feet and includes a full kitchen, dining area, multiple living spaces, bedrooms, bathrooms, laundry facilities, and a large air-conditioned converted garage-flex room. Each home has a separate driveway, individual electric meter, gutters, covered patio, and privately fenced backyard. The entire property is fenced, with pea gravel drives, public water, and public sewer. Built in 1989, the property is located in Dallas, Texas.
The second residence measures 2,426 square feet and includes a full kitchen, dining area, multiple living spaces, bedrooms, bathrooms, laundry facilities, and a large air-conditioned converted garage-flex room. Each home has a separate driveway, individual electric meter, gutters, covered patio, and privately fenced backyard. The entire property is fenced, with pea gravel drives, public water, and public sewer. Built in 1989, the property is located in Dallas, Texas.
Key Highlights
- Two separate residences totaling 4,418 square feet on 2.42 acres
- Primary residence measures 1,992 square feet and was updated in 2025
- Second residence measures 2,426 square feet with an air‑conditioned converted garage‑flex room
Financial Insights
Estimated NOI and Cap Rate
NOI / Yr
$77,684
Cap Rate
8.40%
Suggested Prices Based on Cap Rates
Cap Rate 5%
$1,553,680
$1.6M
Cap Rate 7%
$1,109,771
$1.1M
Cap Rate 9%
$863,156
$863.2K
Market Conditions
NOI Build-Up for 4,418 SF
Gross rent
$123.5K $27.96/SF
− Vacancy
−$12.6K −$2.84/SF
EGI
$111.0K $25.12/SF
− OpEx
−$33.3K −$7.54/SF
NOI
$77.7K $17.58/SF
Area
Dallas, TX
Vacancy
10.16%
Lease Rate
$27.96 /SF/Yr
Expense Ratio
30.00%
Simulate Cap Rate and NOI
Suggested Prices Based on Cap Rates
Cap Rate 5%
$1,553,680
Cap Rate 7%
$1,109,771
Cap Rate 9%
$863,156
Alternative Uses
Best Use
Multifamily LT 5
$1.11M
$971.1K – $1.29M
NOI $77,684 @ 7.0% cap · market cap 8.40%
Second Best
Apartment 5plus
$959.7K
$839.8K – $1.12M
NOI $67,180 @ 7.0% cap · market cap 7.26%
Theoretical Best
Office A
$5.30M
$4.64M – $6.18M
NOI $371,087 @ 7.0% cap · market cap 40.12%
Zoning and permitted uses should be independently verified with authorities.
How Realmo checks its estimates
Property Analytics
Unlock full access to Insights
Subscribe to Realmo Intelligence
Open Analytics
Current Use
Lease Details
2
Residential units
Location Intelligence
Trade Area within ½ mile
177
Businesses Nearby
Explore this area
Business Placement
Demographics for 75253, TX
25,867
Population
7,374
Households
3.5
Avg Household Size
28
Median Age
10%
College-Educated
64%
High-School Grad
14.9 sq mi
ZIP Area
1,736
Density / Sq Mi
$56,519
Median Household Income
$33,361
Median Earnings
$1,338
Median Rent
$121,400
Median Home Value
Check the figures for this property
Cap Rate, Value Estimation, Potential NOI and more
View Realmo Analytics
Market
Vacancy Rate% for Multifamily in South region

Questions? Ask Rey
Realmo’s AI knows this listing — price, zoning, demand, history. Ask anything.







Frequently Asked Questions
What type of property is this?
Duplex - Separate homes provide flexible living arrangements, private outdoor areas, and independent utility metering on a fenced parcel.
Where is this duplex located?
The property is located at 13740 Vida Lane Dallas, TX.
What is the asking price?
The asking price for this property is $924,900.
What are key features of this property?
This property features: Two separate residences totaling 4,418 square feet on 2.42 acres; Primary residence measures 1,992 square feet and was updated in 2025; Second residence measures 2,426 square feet with an air‑conditioned converted garage‑flex room


