Corner Gas Station
For Sale
$390,900
1327 E SILVER SPRINGS Boulevard, Ocala, FL 34470
Commercial Sale, OCALA, FL
Property Size3,083 SF
Lot Size0.30 Acres
Price / SF$126.79
Days on Market330
Property Features for 1327 E SILVER SPRINGS Boulevard
General Information
Property type
Commercial Sale
Property subtype
Other
Zoning
B2
Subdivision
LYNWOOD PARK
Directions
Head north on I-75 N. Take exit 352 to merge onto FL-40 E/W Silver Springs Blvd. Destination will be on the left
Standard status
Active
APN
2833-011-133
Size
3,083 SF
Lot size
0.30 Acres
Taxes and HOA fees
Tax Year
2024
Tax Description
SEC 17 TWP 15 RGE 22 PLAT BOOK A PAGE 182 LYNWOOD PARK LOTS 133.134 EXC ST RD 40 RWY
Tax Annual Amount
2991
Legal Description
SEC 17 TWP 15 RGE 22 PLAT BOOK A PAGE 182 LYNWOOD PARK LOTS 133.134 EXC ST RD 40 RWY
Utilities
Cooling system
Central Air
Amenities
open-interior space
large display windows
covered pump canopy
Building Details
Year built
1950
Floors in Building
1
Building materials
Block, Stucco
Listing Agency:
PREFERRED SHORE LLC
(941) 999-1179
Listed By:
Lauren Rivera
(813) 458-9117
Added: Nov 14, 2025
Changed: Sep 30
Last Checked: Oct 10 at 10:06AM
MLS# O6361647
Copyright © 2026 Stellar MLS. All rights reserved. All information provided by the listing agent/broker is deemed reliable but is not guaranteed and should be independently verified.
Investment Insights
Based on property information with market context.
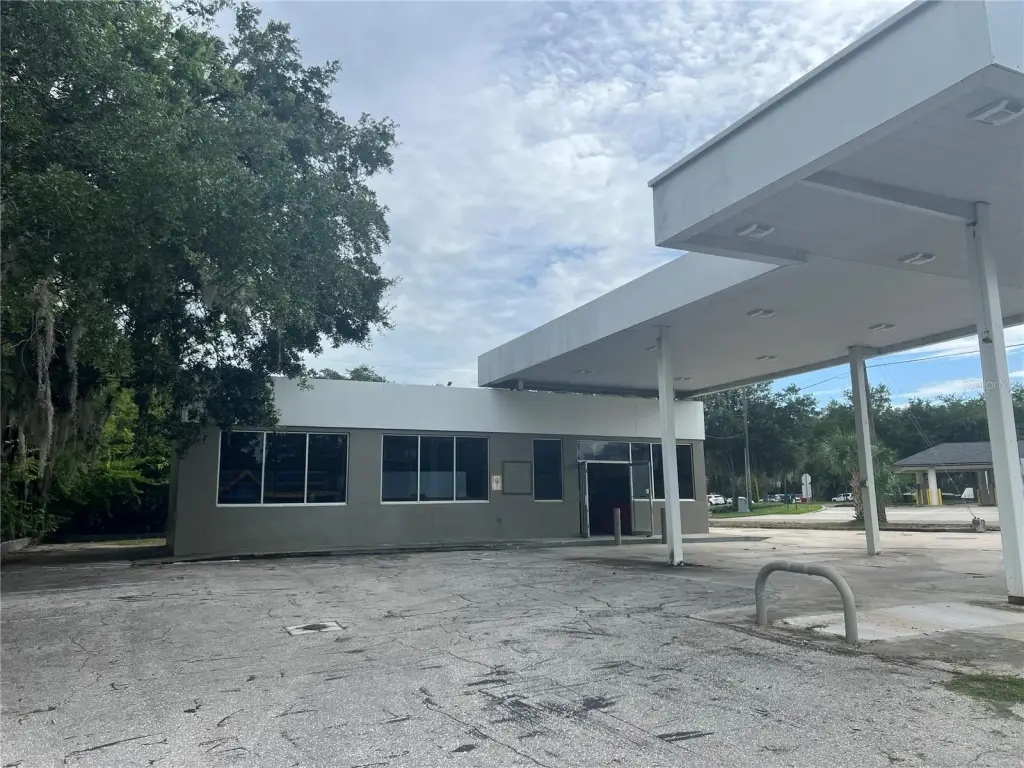
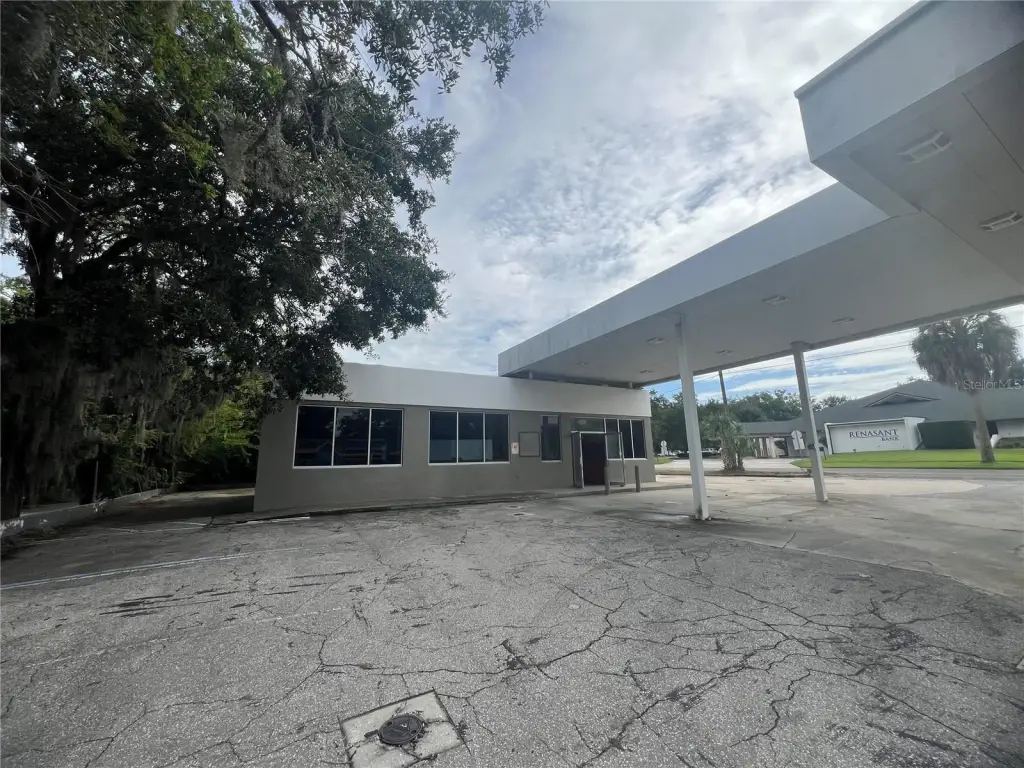
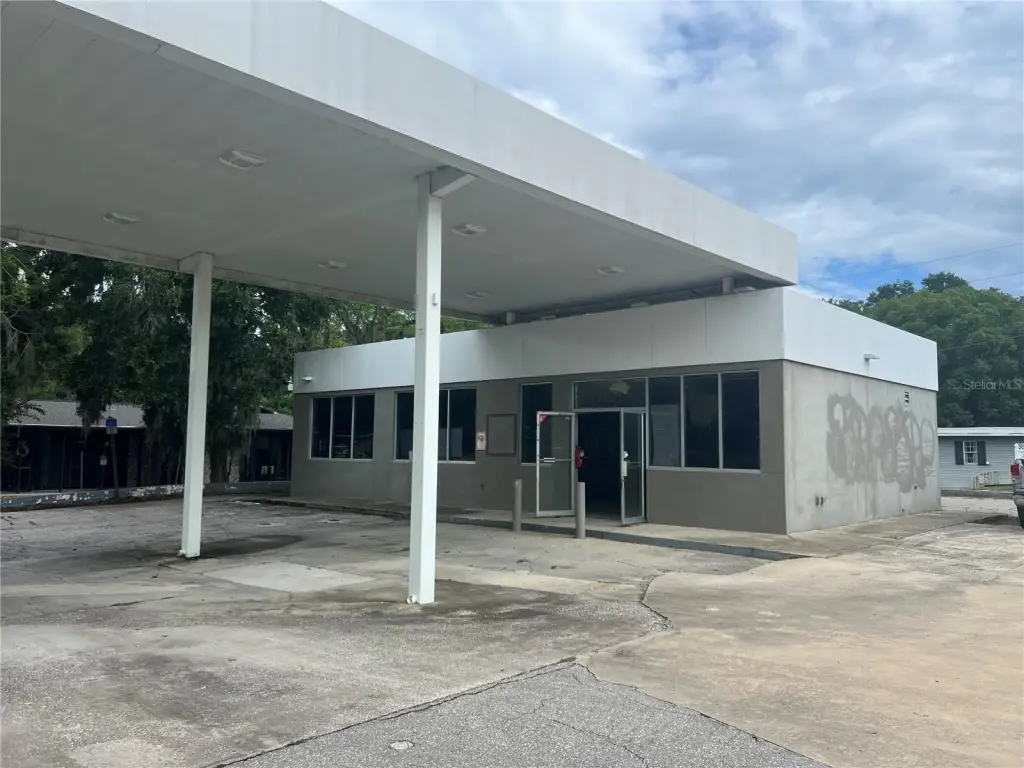
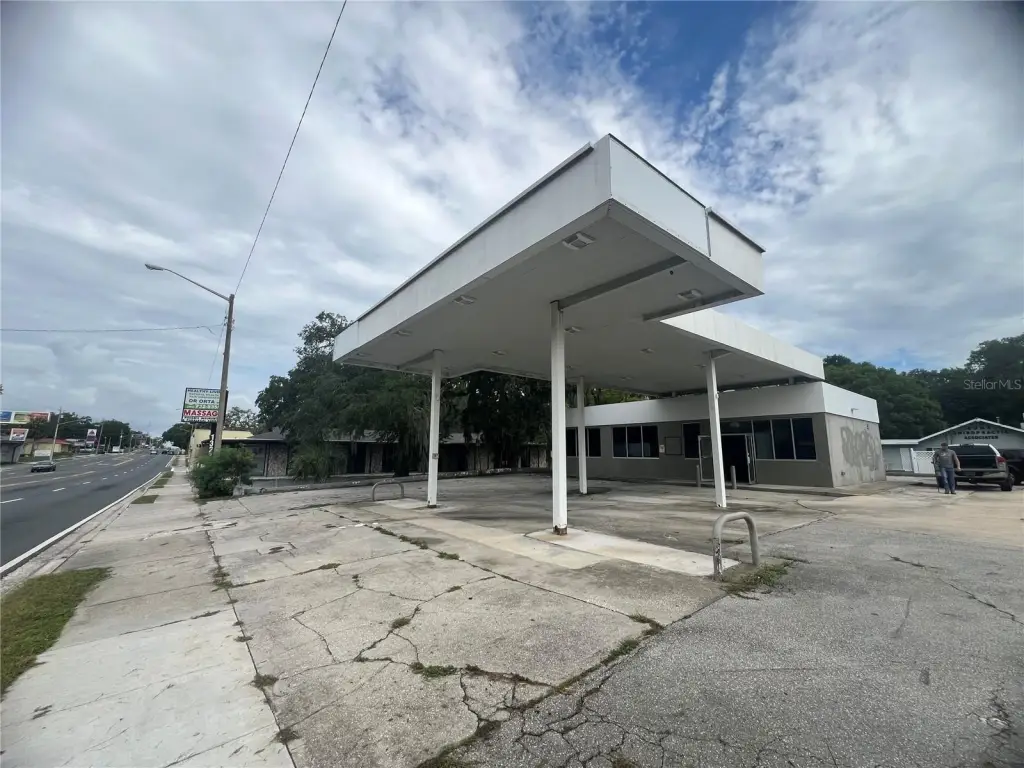
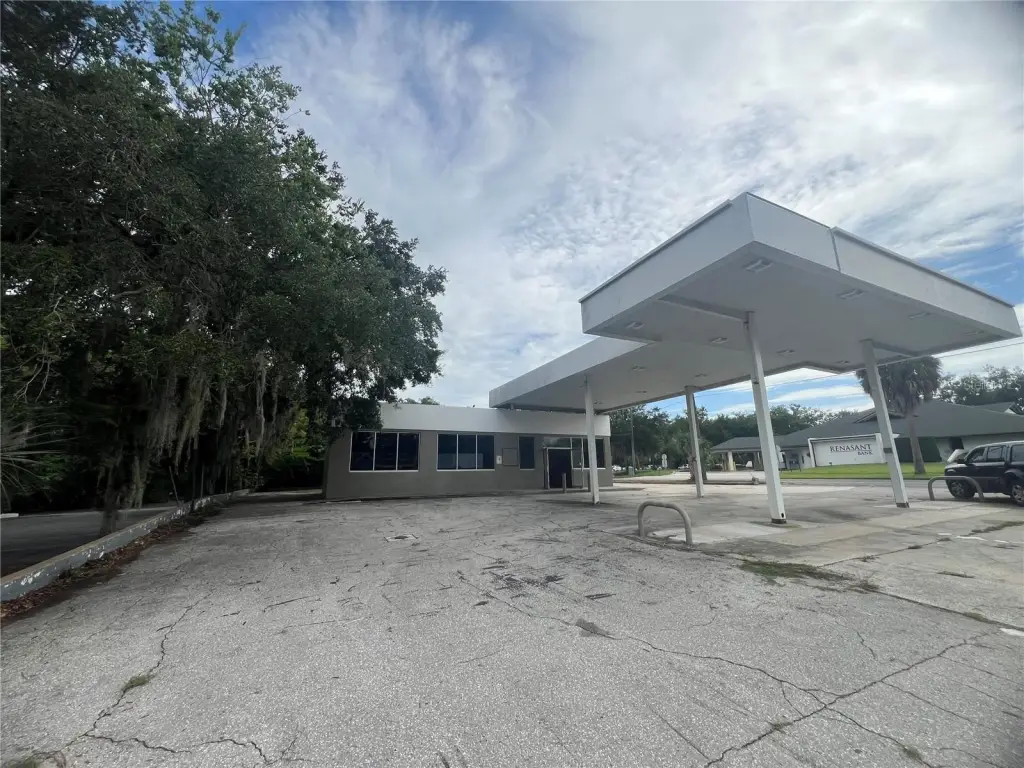
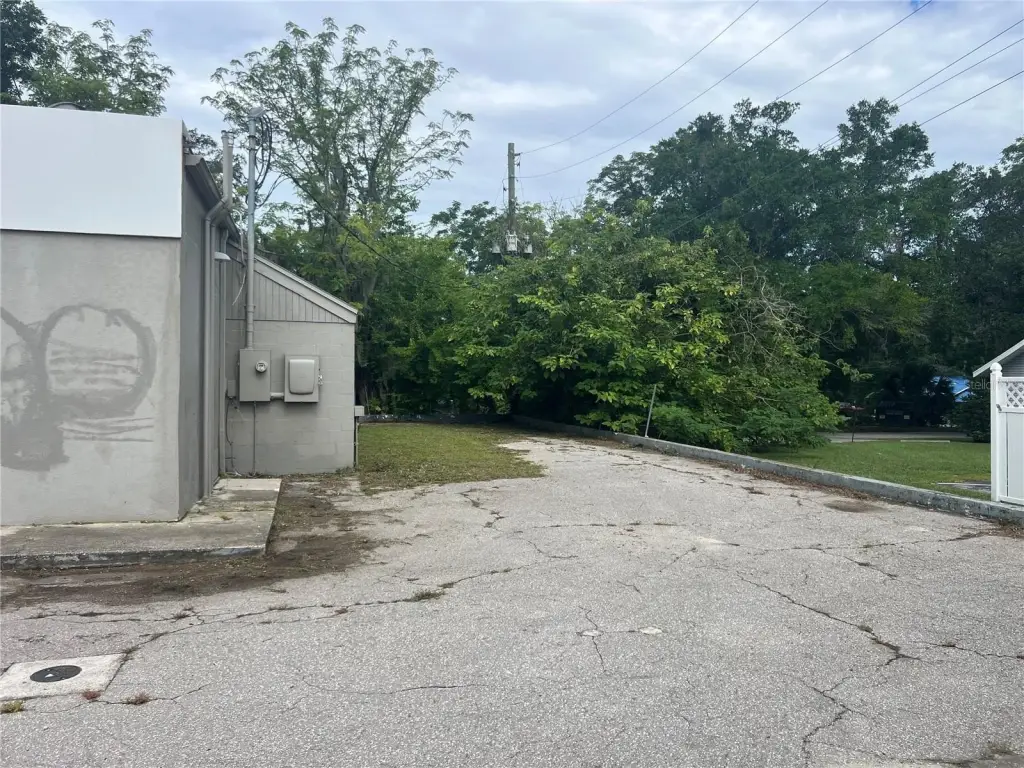
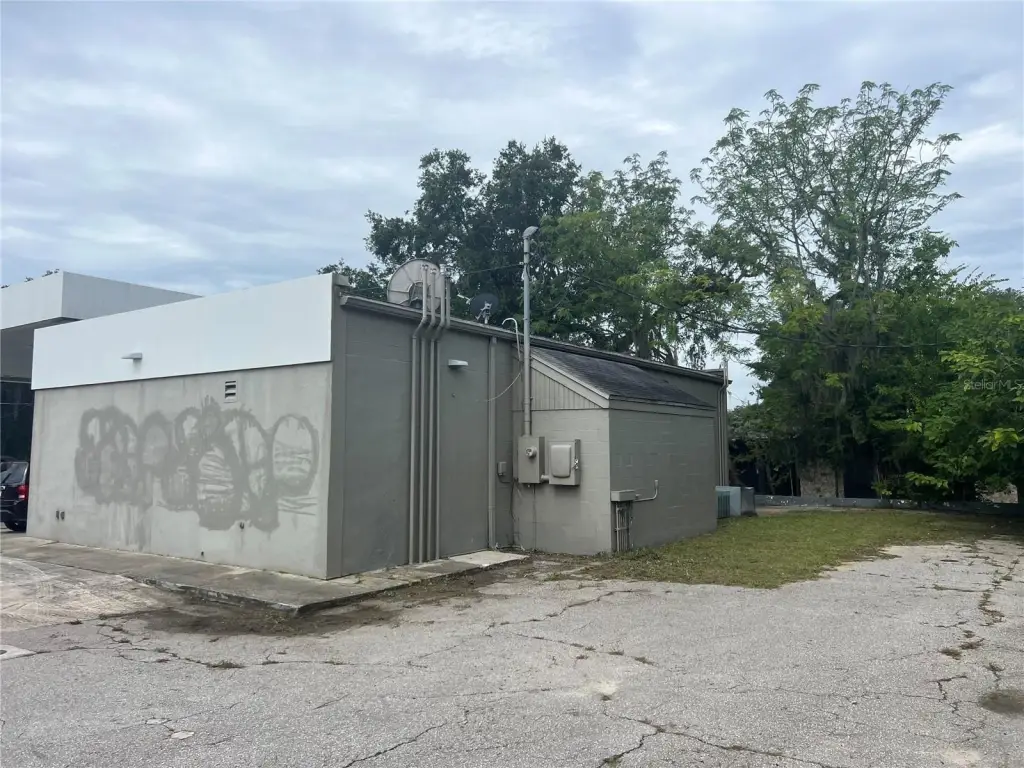
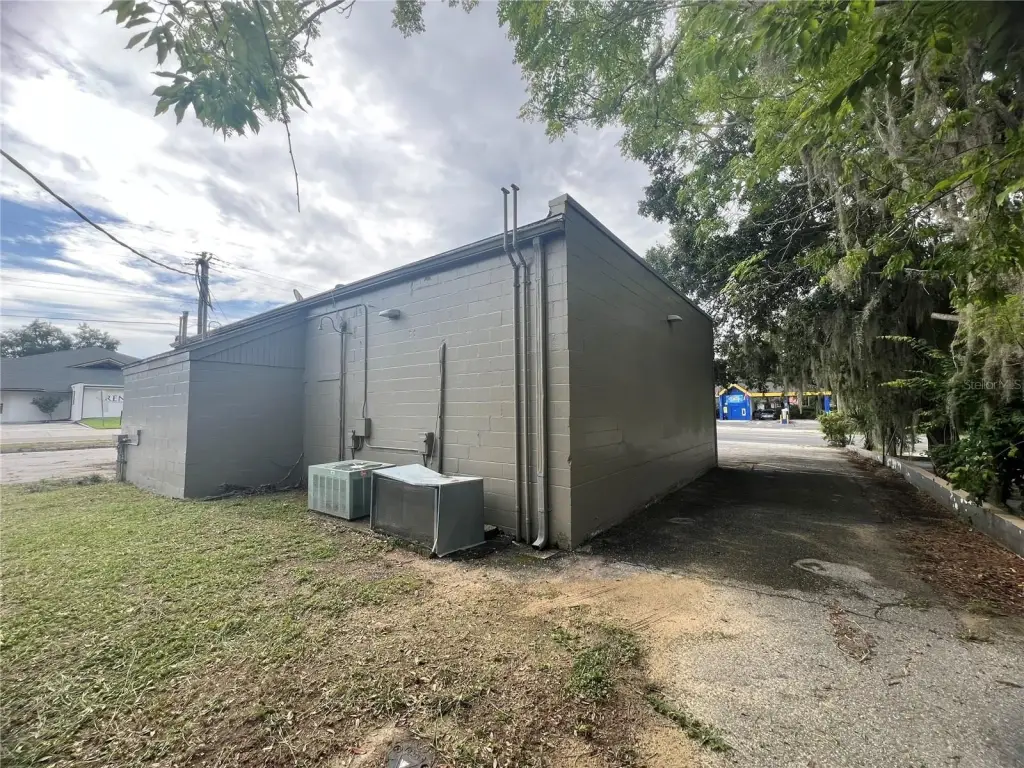
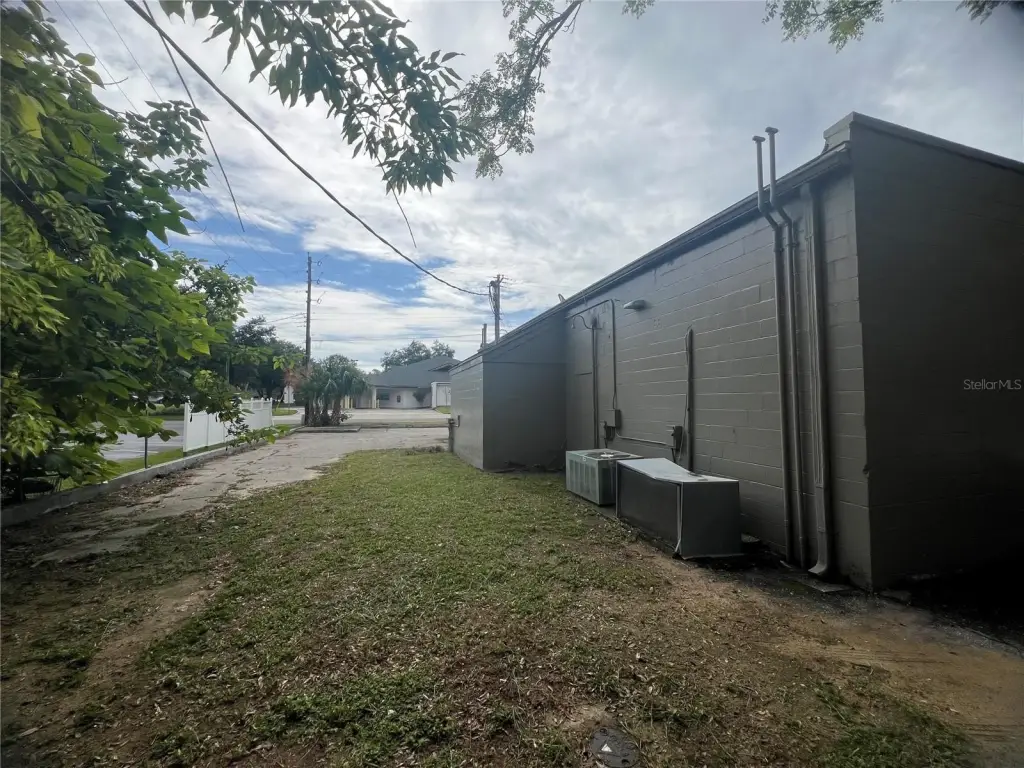
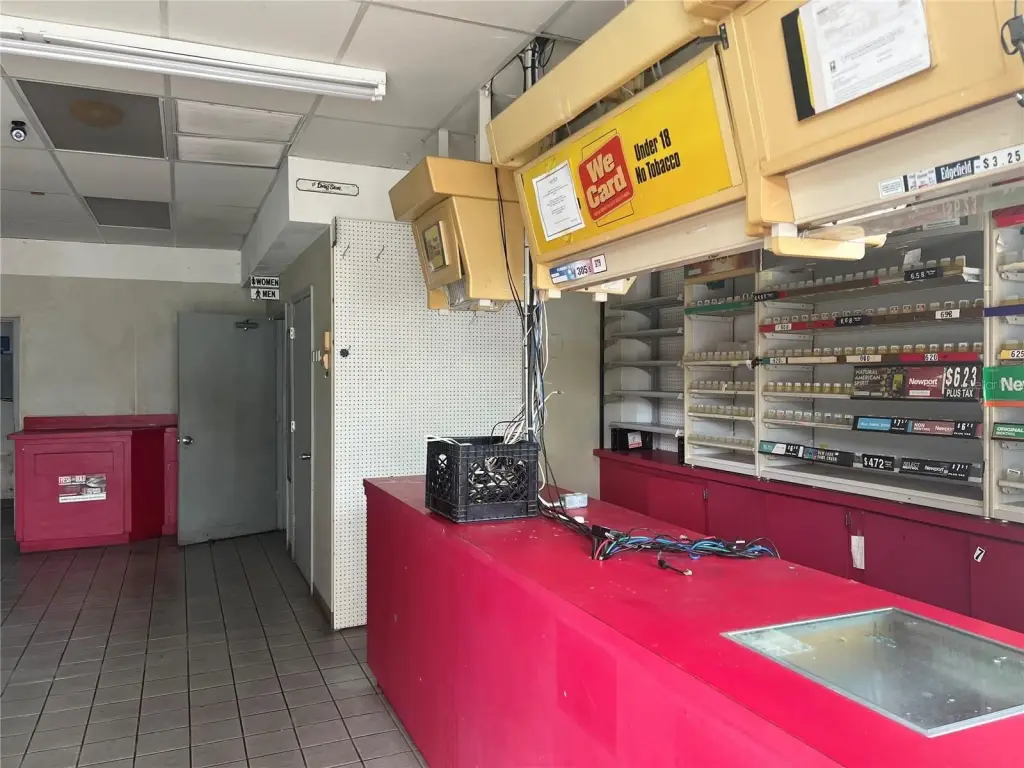
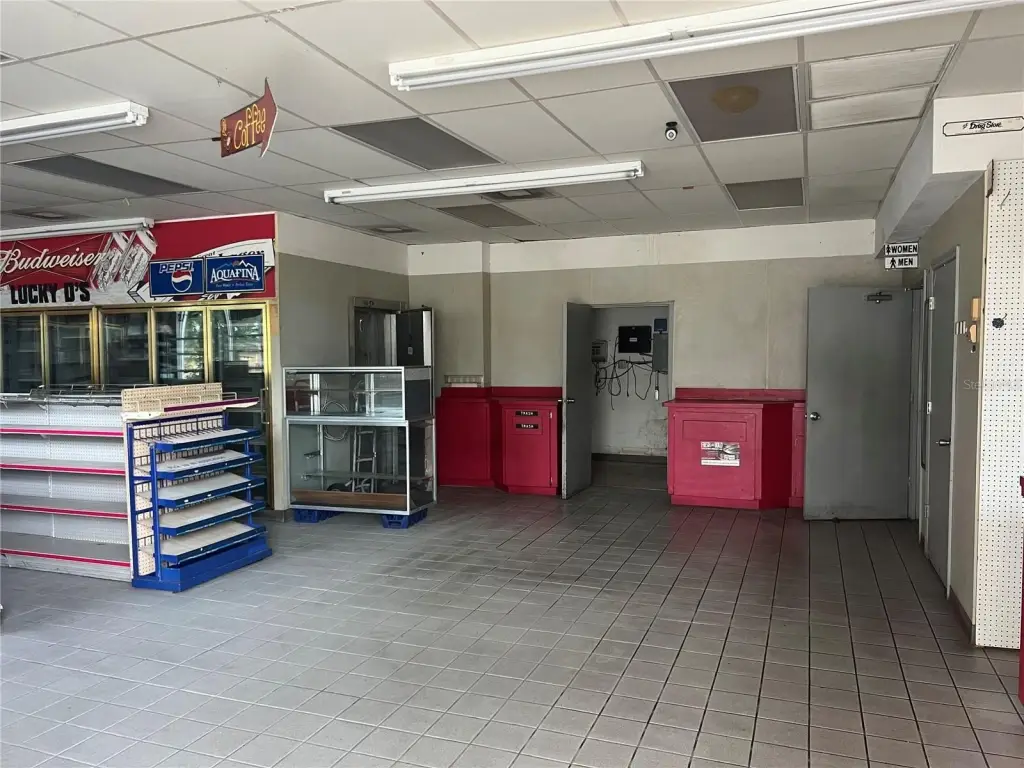
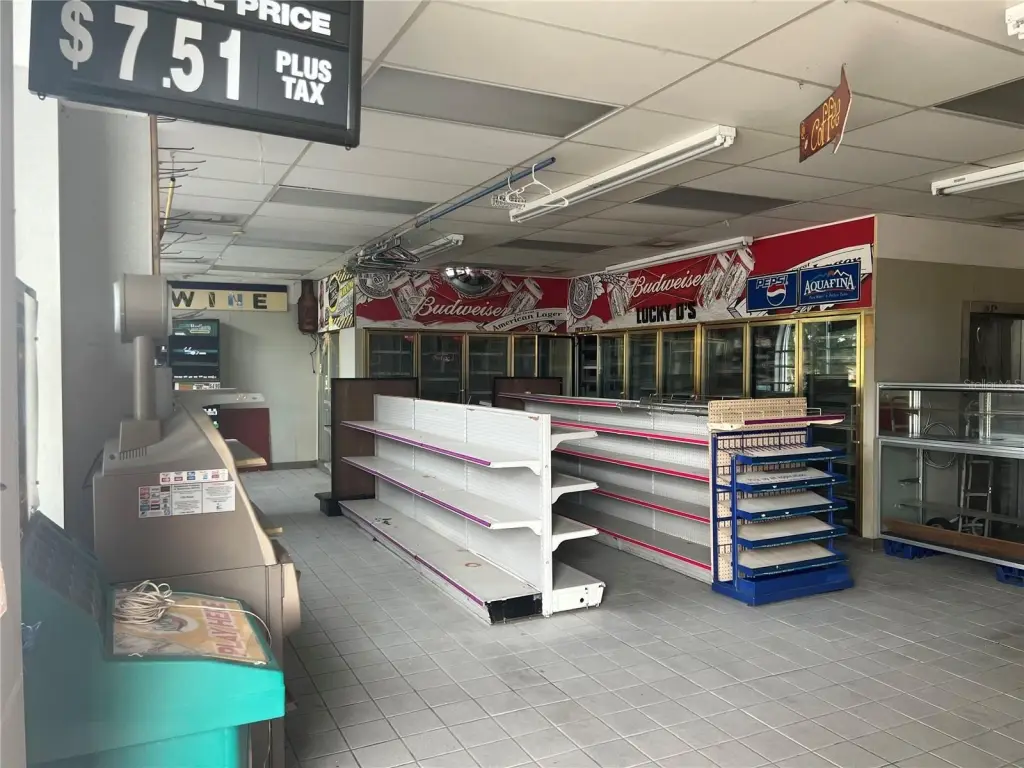
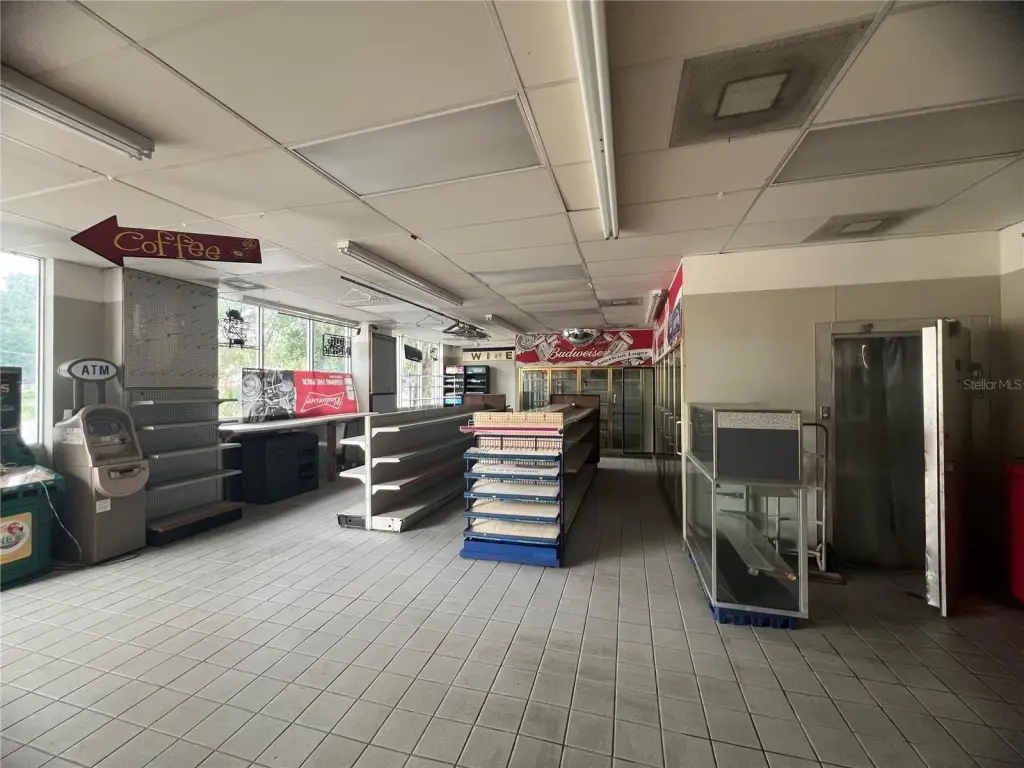
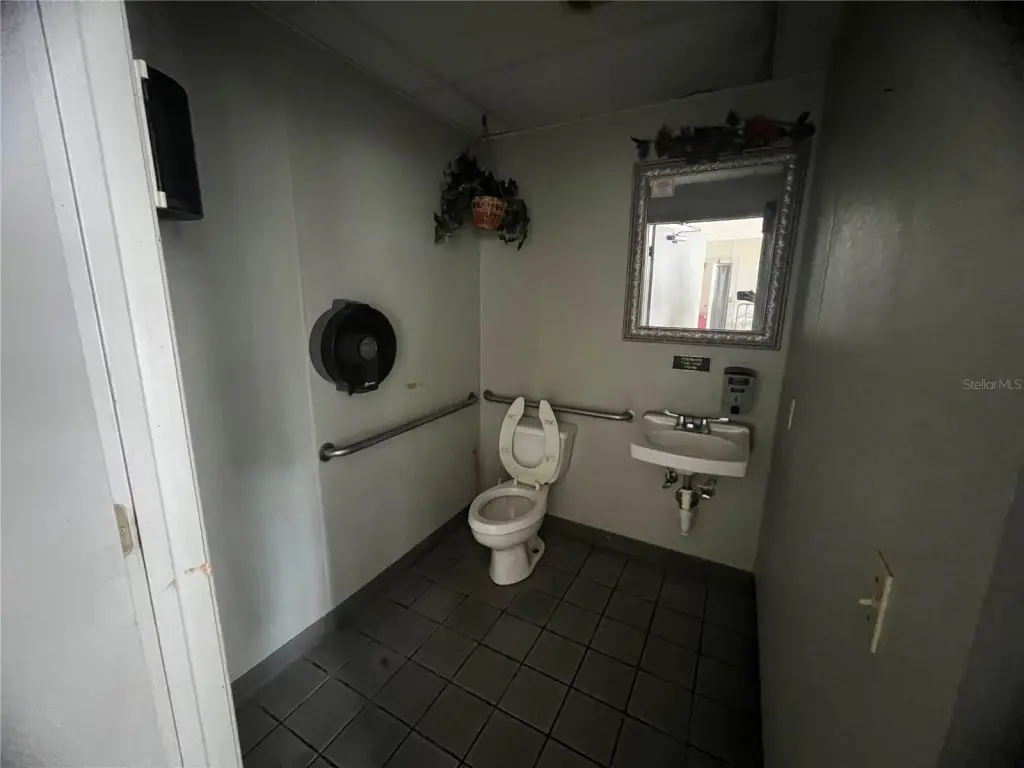
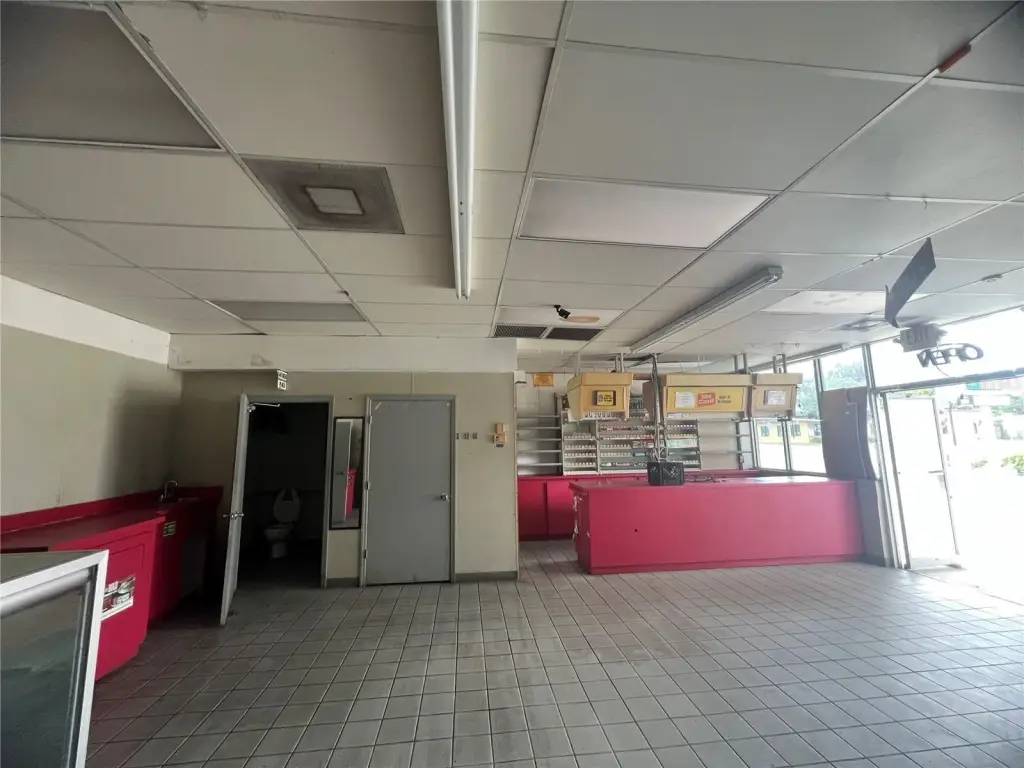
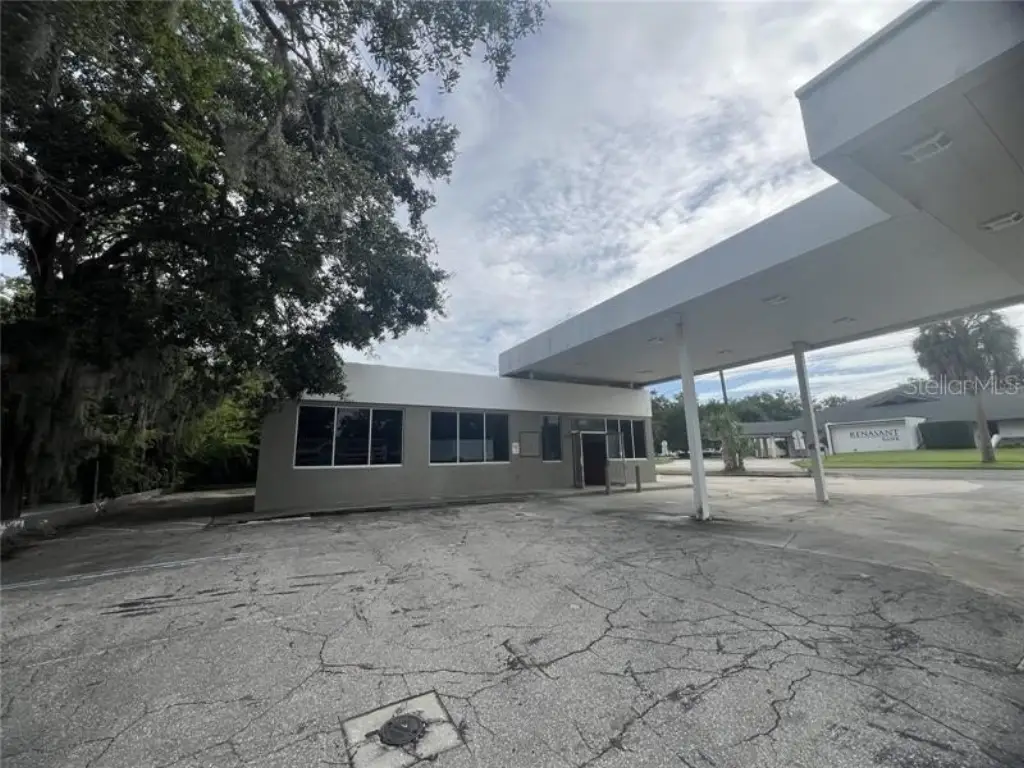
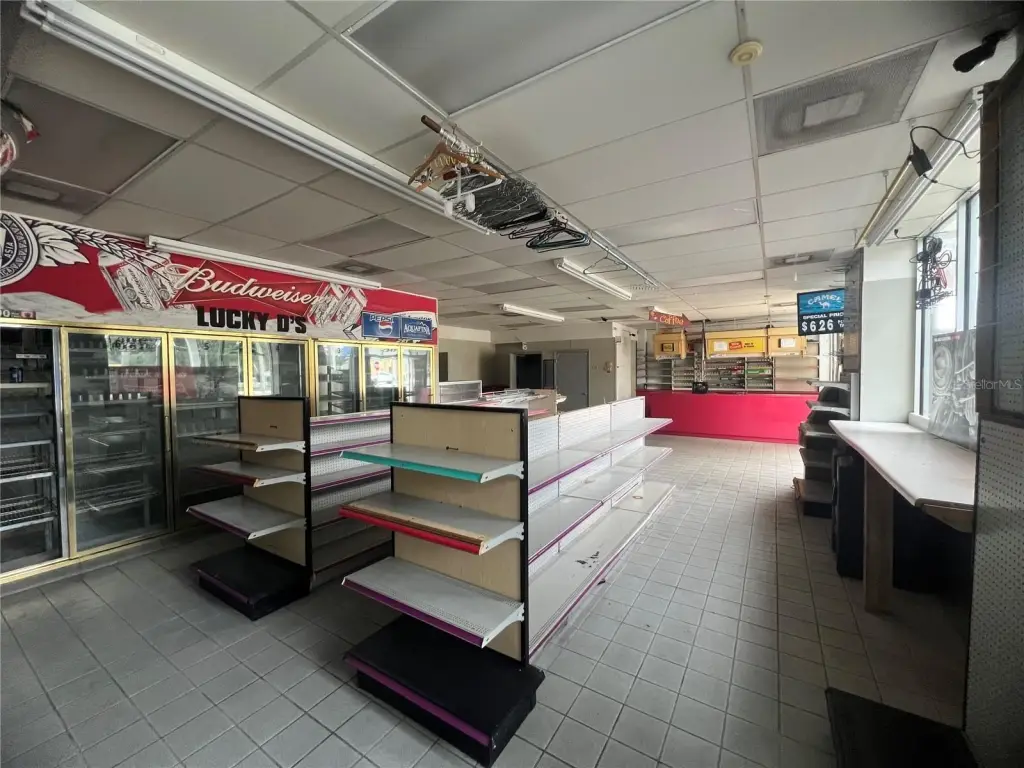
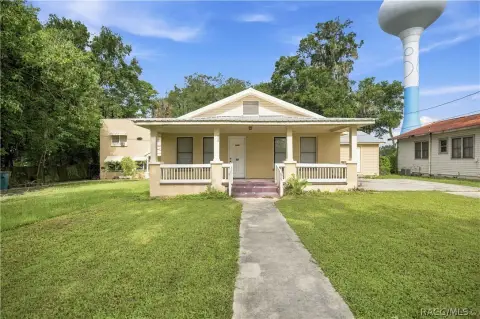
This former gas station includes a 1,555-square-foot block and stucco building with open interior space, large display windows, and central air. A covered 1,525-square-foot pump canopy remains on the property, supporting consideration of retail, food service, salon, or other commercial concepts subject to applicable approvals. The site is zoned B2 and includes city utilities.
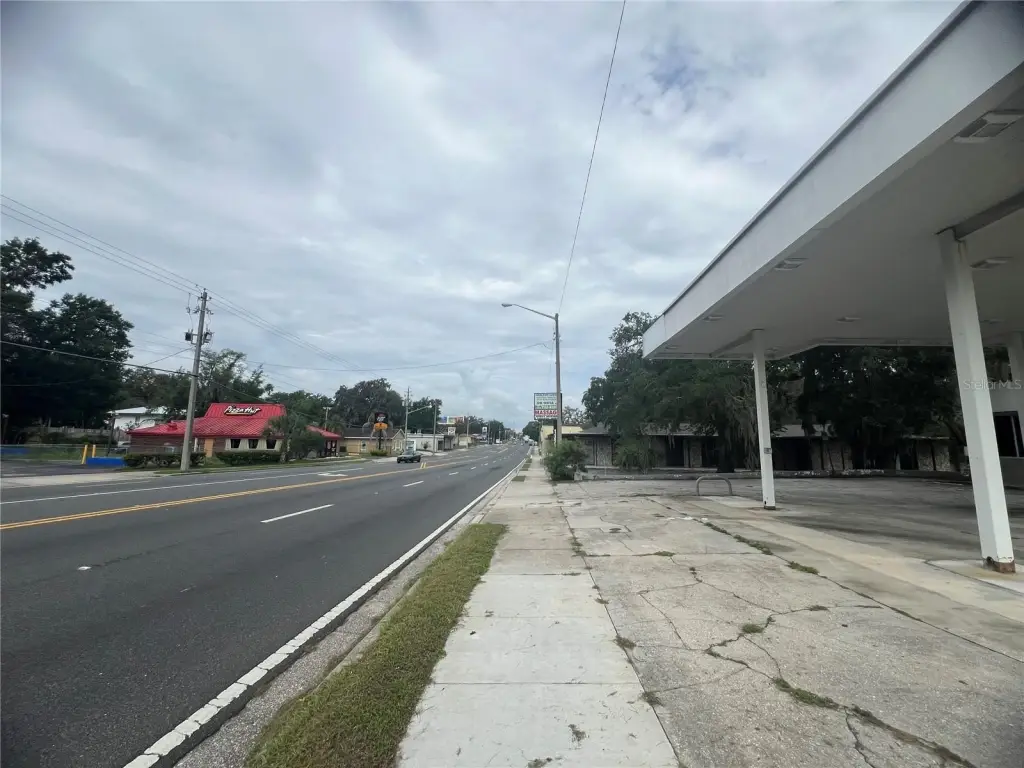
Positioned on a corner along E Silver Springs Boulevard, the property is approximately one mile from historic downtown Ocala and benefits from both vehicle and pedestrian activity identified in the property information. The underground fuel tank is closed in place, filled with grout, and not usable. The seller will provide the latest environmental reports and state-agency contacts for additional information. The property is offered as-is.
Positioned on a corner along E Silver Springs Boulevard, the property is approximately one mile from historic downtown Ocala and benefits from both vehicle and pedestrian activity identified in the property information. The underground fuel tank is closed in place, filled with grout, and not usable. The seller will provide the latest environmental reports and state-agency contacts for additional information. The property is offered as-is.
Key Highlights
- 1,555‑square‑foot building with open interior space and large display windows
- Covered 1,525‑square‑foot pump canopy
- B2 commercial zoning with city utilities in place
Financial Insights
Estimated NOI and Cap Rate
NOI / Yr
$35,367
Cap Rate
9.05%
Suggested Prices Based on Cap Rates
Cap Rate 5%
$707,340
$707.3K
Cap Rate 7%
$505,243
$505.2K
Cap Rate 9%
$392,967
$393.0K
Market Conditions
NOI Build-Up for 3,083 SF
Gross rent
$52.9K $17.16/SF
− Vacancy
−$2.4K −$0.77/SF
EGI
$50.5K $16.39/SF
− OpEx
−$15.2K −$4.92/SF
NOI
$35.4K $11.47/SF
Area
Marion County, FL
Vacancy
4.50%
Lease Rate
$17.16 /SF/Yr
Expense Ratio
30.00%
Simulate Cap Rate and NOI
Suggested Prices Based on Cap Rates
Cap Rate 5%
$707,340
Cap Rate 7%
$505,243
Cap Rate 9%
$392,967
Alternative Uses
Best Use
Retail
$1.11M
$969.3K – $1.29M
NOI $77,542 @ 7.0% cap · market cap 19.84%
Second Best
Specialty Retail
$533.6K
$466.9K – $622.5K
NOI $37,352 @ 7.0% cap · market cap 9.56%
Theoretical Best
Office A
$1.68M
$1.47M – $1.96M
NOI $117,849 @ 7.0% cap · market cap 30.15%
Zoning and permitted uses should be independently verified with authorities.
Property Analytics
Unlock full access to Insights
Subscribe to Realmo Intelligence
Open Analytics
Current Use
Lease Details
Yes
Paved road access
Yes
Utilities to site
Location Intelligence
Trade Area within ½ mile
1,128
Businesses Nearby
Explore this area
Business Placement
Demographics for 34470, FL
20,483
Population
10,121
Households
2
Avg Household Size
42
Median Age
23%
College-Educated
90%
High-School Grad
13.4 sq mi
ZIP Area
1,529
Density / Sq Mi
$49,592
Median Household Income
$36,957
Median Earnings
$1,124
Median Rent
$171,500
Median Home Value
Check the figures for this property
Cap Rate, Value Estimation, Potential NOI and more
View Realmo Analytics
Market
Vacancy Rate% for Retail in South region

Questions? Ask Rey
Realmo’s AI knows this listing — price, zoning, demand, history. Ask anything.





Frequently Asked Questions
What type of property is this?
Gas station - Former fuel-service property with a flexible commercial layout, covered canopy, and established city utility connections.
Where is this gas station located?
The property is located at 1327 E SILVER SPRINGS Boulevard Ocala, FL.
What is the asking price?
The asking price for this property is $390,900.
What are key features of this property?
This property features: 1,555‑square‑foot building with open interior space and large display windows; Covered 1,525‑square‑foot pump canopy; B2 commercial zoning with city utilities in place


