Bed & Breakfast with
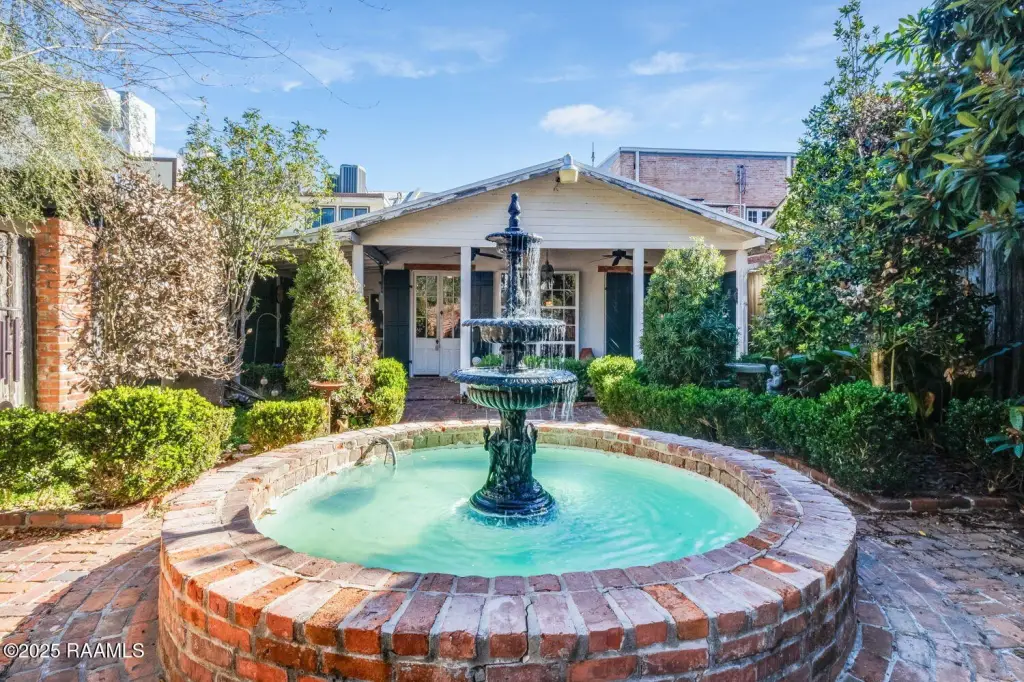
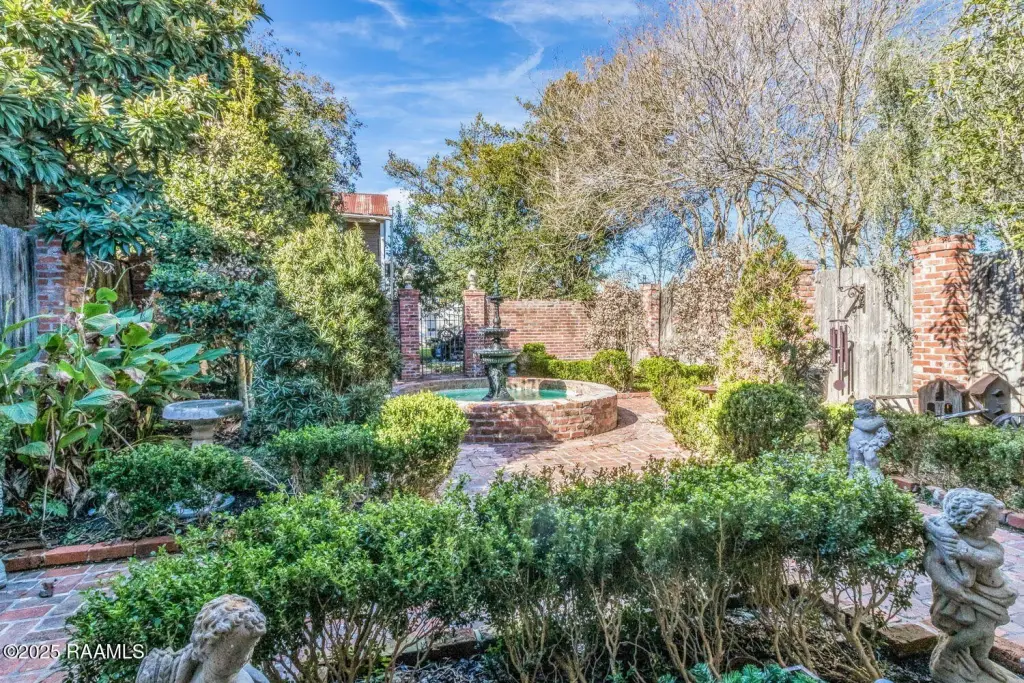
For Sale
$399,500
130 S Main Street, Saint Martinville, LA 70582
Commercial Sale, St. Martinville, LA
Property Size3,835 SF
Lot Size0.35 Acres
Price / SF$104.17
Days on Market528
Property Features for 130 S Main Street
General Information
Property type
Commercial Sale
Property subtype
Other
Zoning
C
Exterior features
Door Sign, Fully Fenced, Roof Sign
Fencing
Full
Lot features
Level, Interior Lot
Directions
Take Hwy 90 to LA-182 and exit. Merge onto E Main Street. Turn left onto LA-96 E. Turn left onto S Main Street. Home will be on your left.
Subdivision
M2
Standard status
Active
APN
45064
Size
3,835 SF
Lot size
0.35 Acres
Taxes and HOA fees
Tax Description
LOT: BOULET ALS, MAIN ST., BIENVENU ALS, WASHINGTON ST.COB: 709-088-168394 1213-433-274603 1752-243-505299 1889-047-562861
Legal Description
LOT: BOULET ALS, MAIN ST., BIENVENU ALS, WASHINGTON ST.COB: 709-088-168394 1213-433-274603 1752-243-505299 1889-047-562861
Utilities
Heating system
Central, Electric (Heating)
Cooling system
Window Unit(s), Ceiling Fan(s)
Water source
Public
Amenities
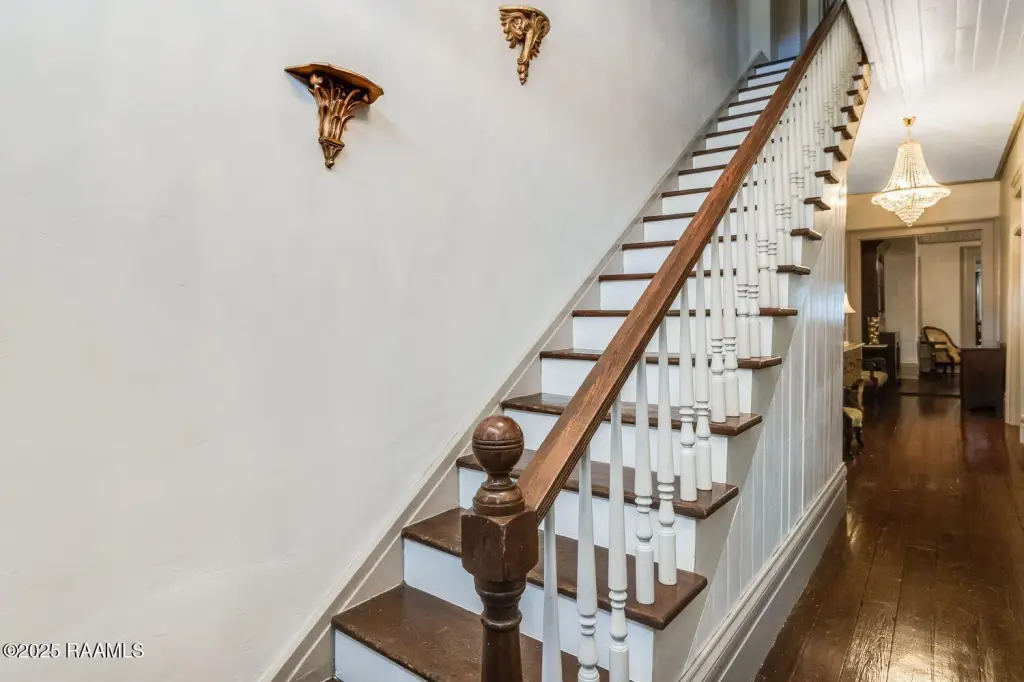
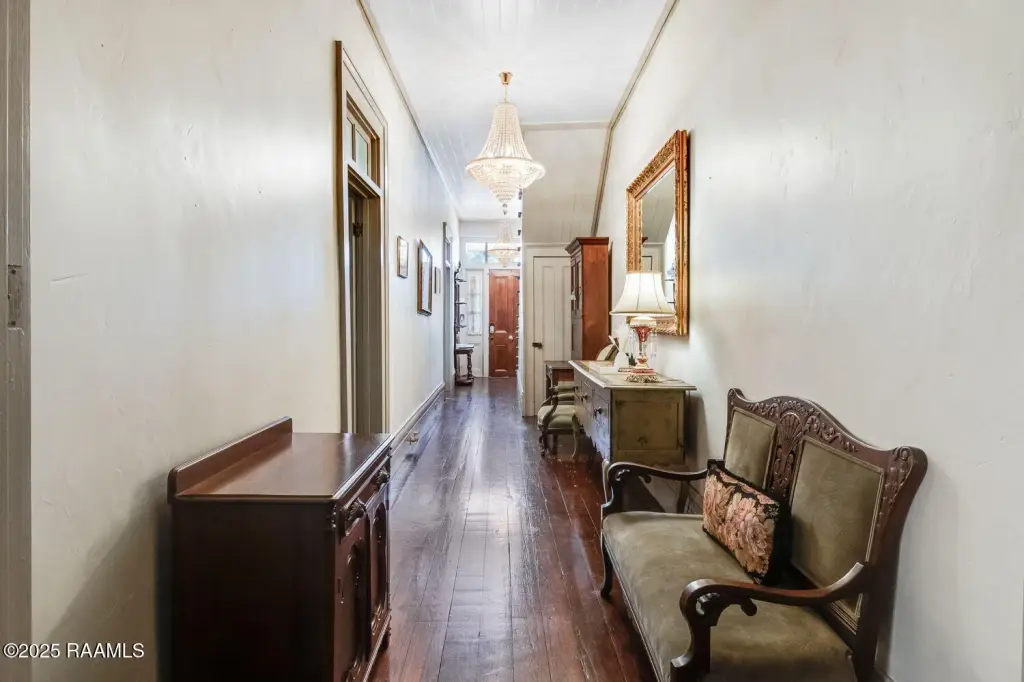
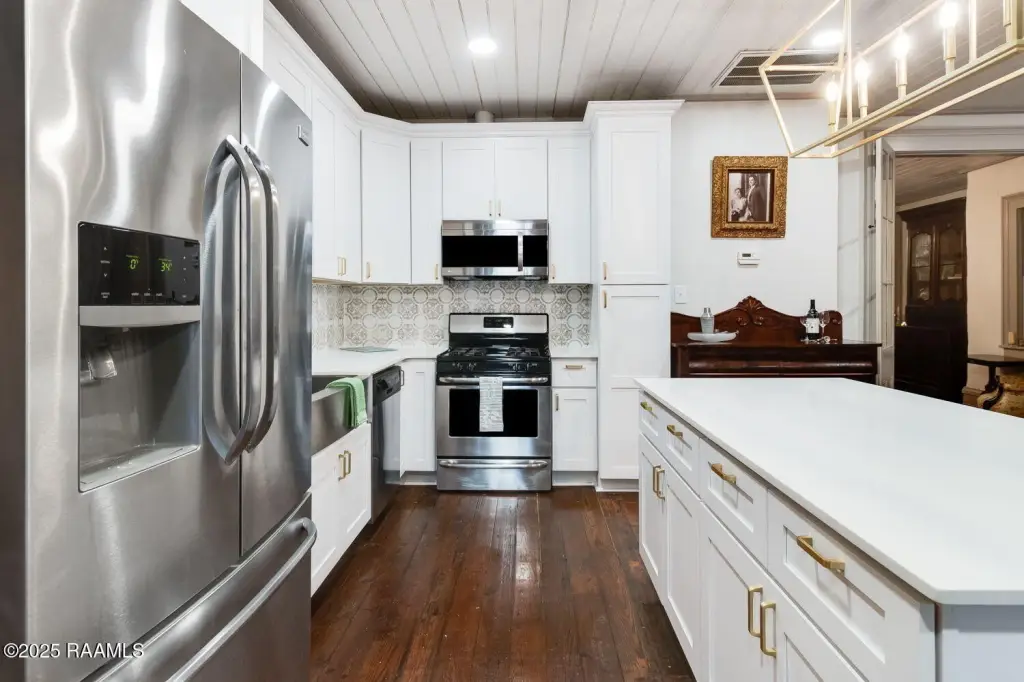
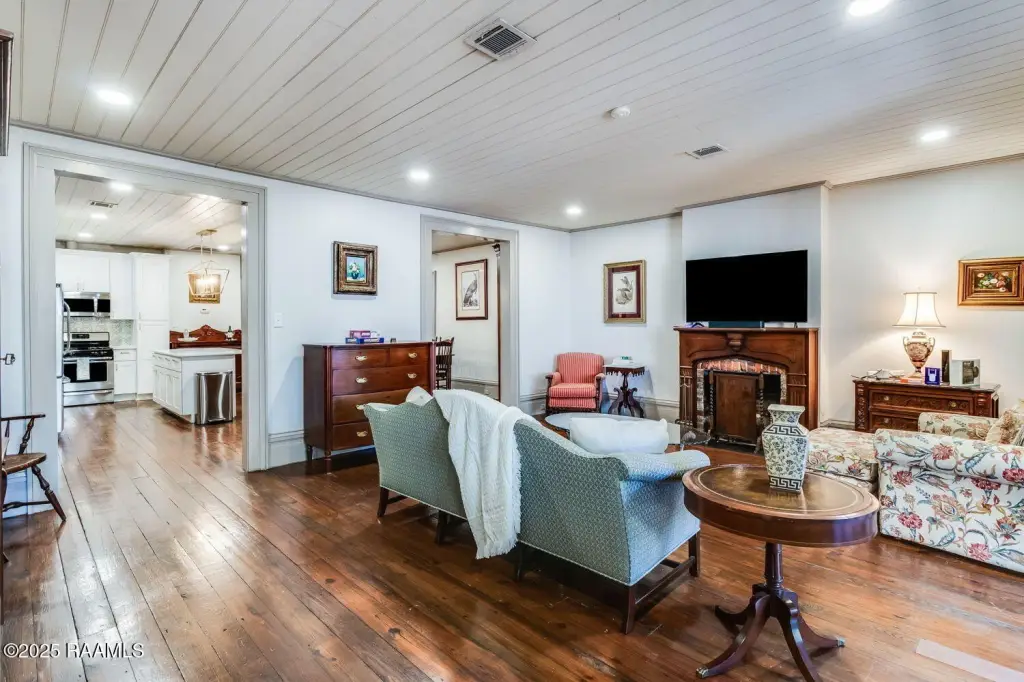
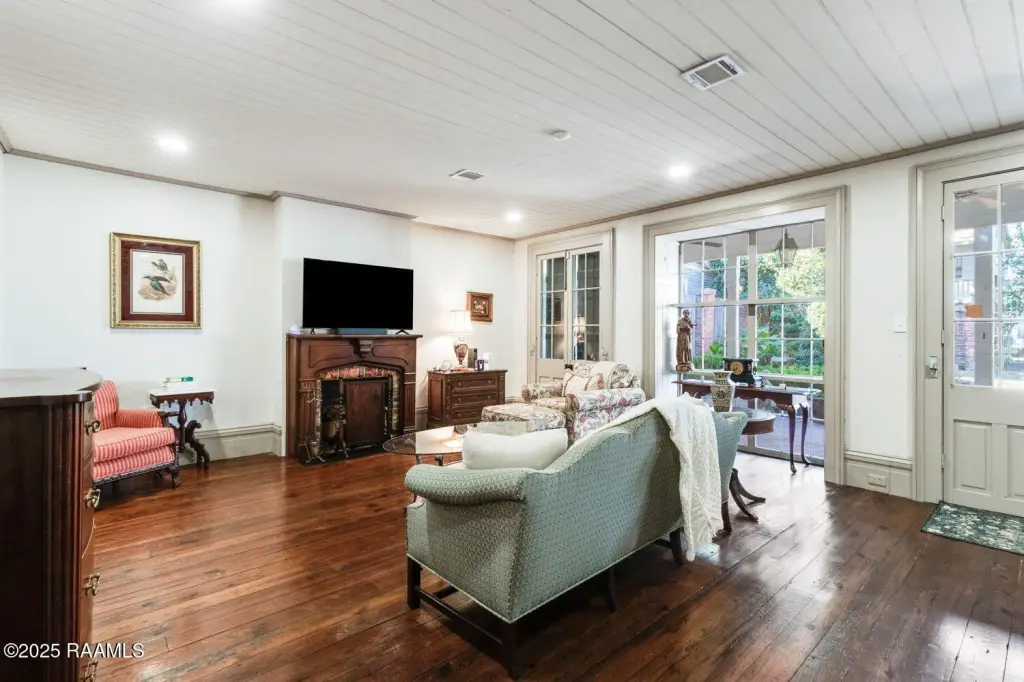
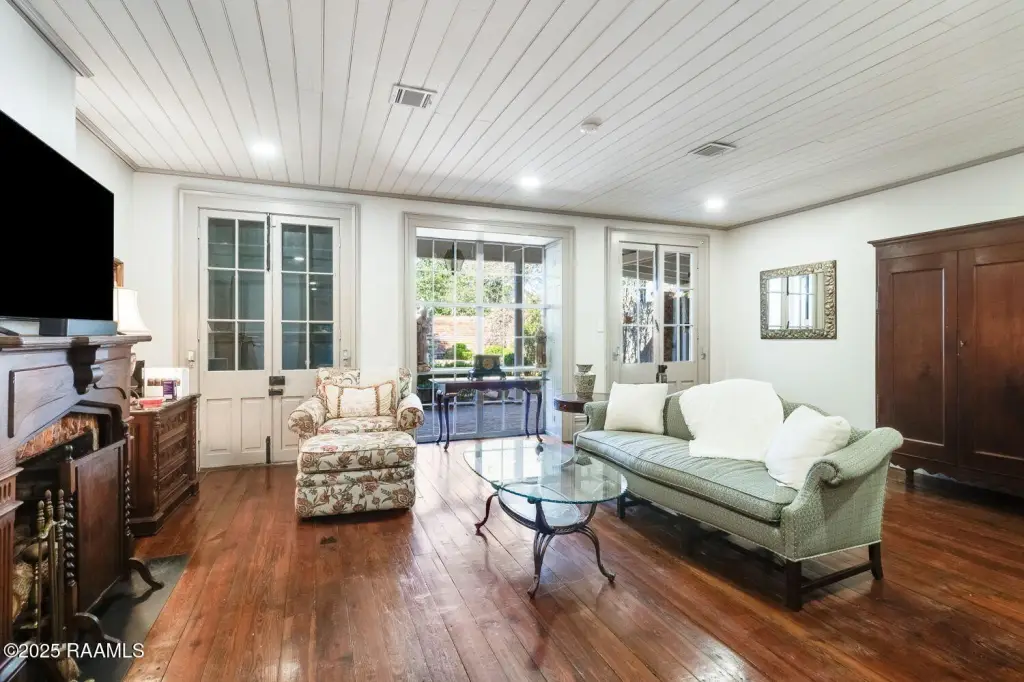
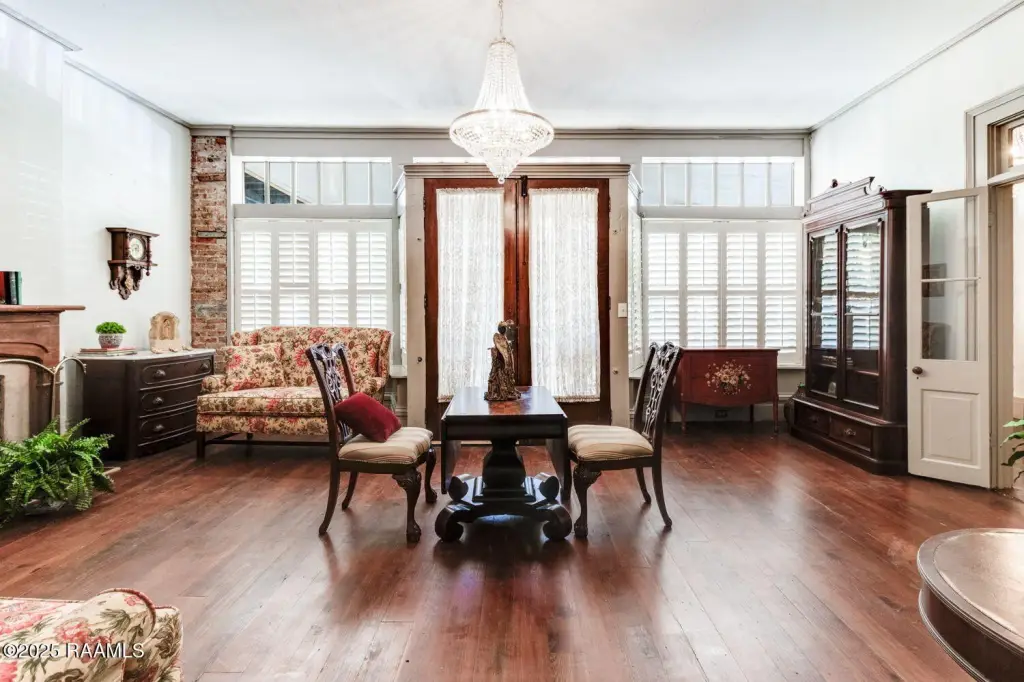
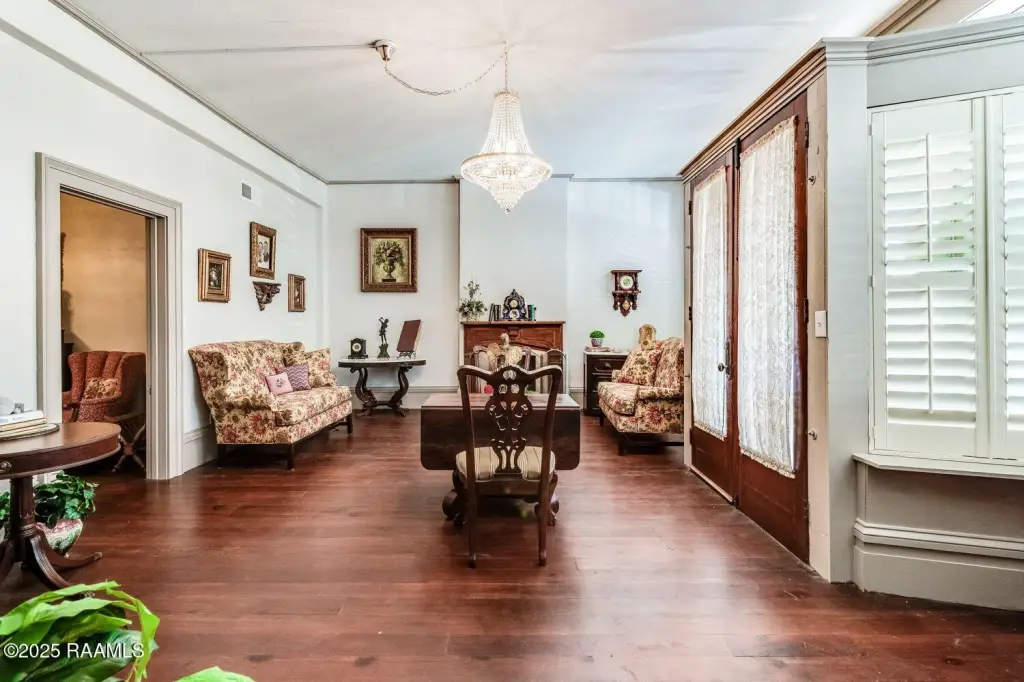
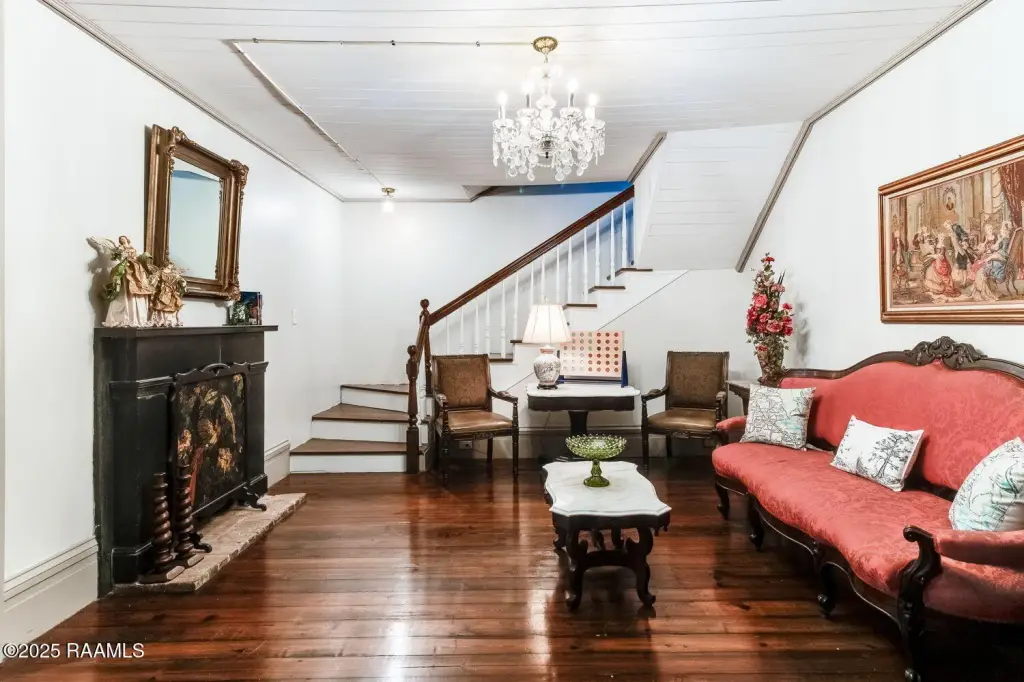
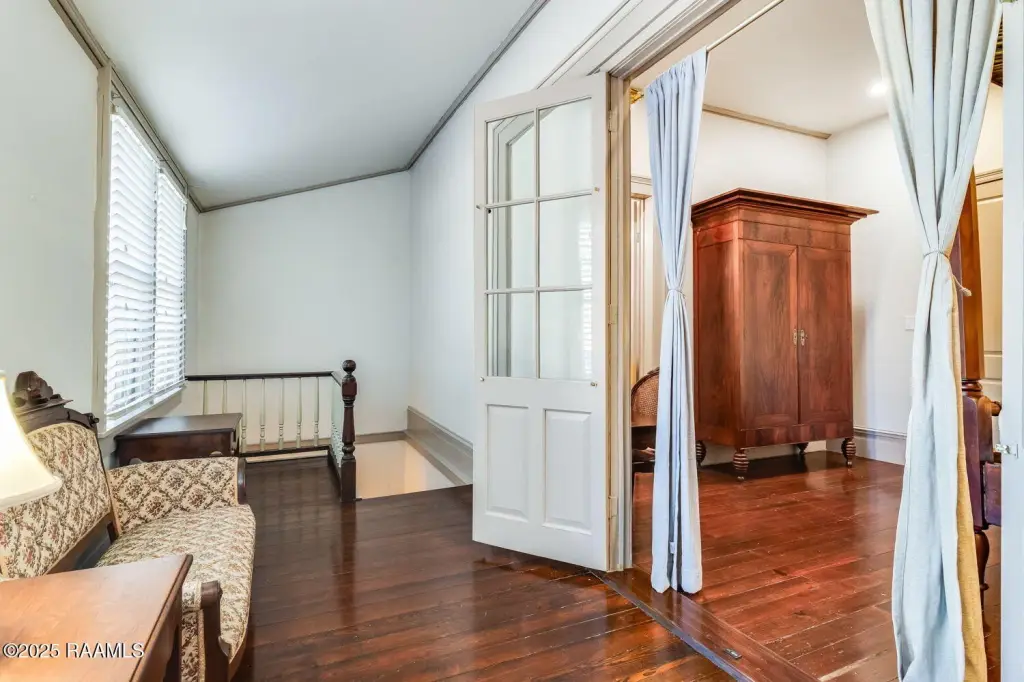
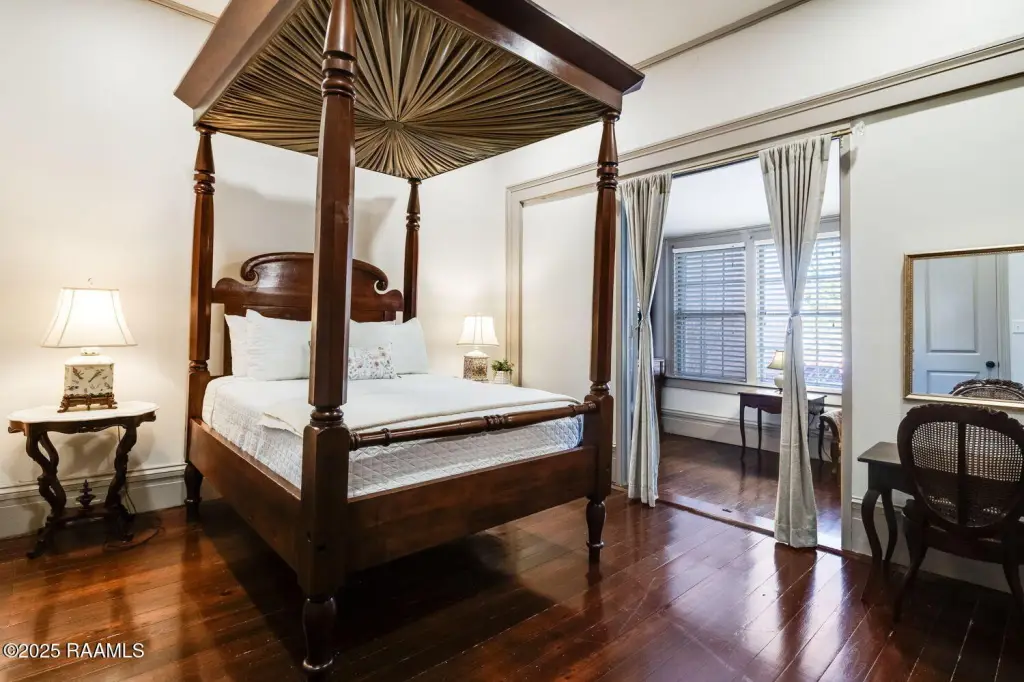
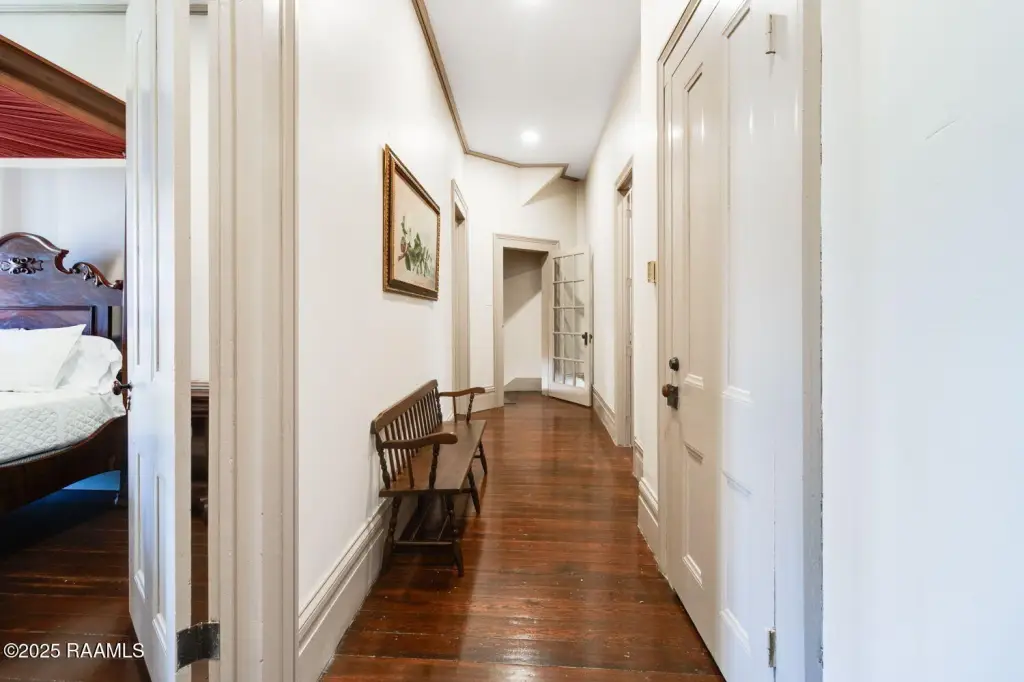
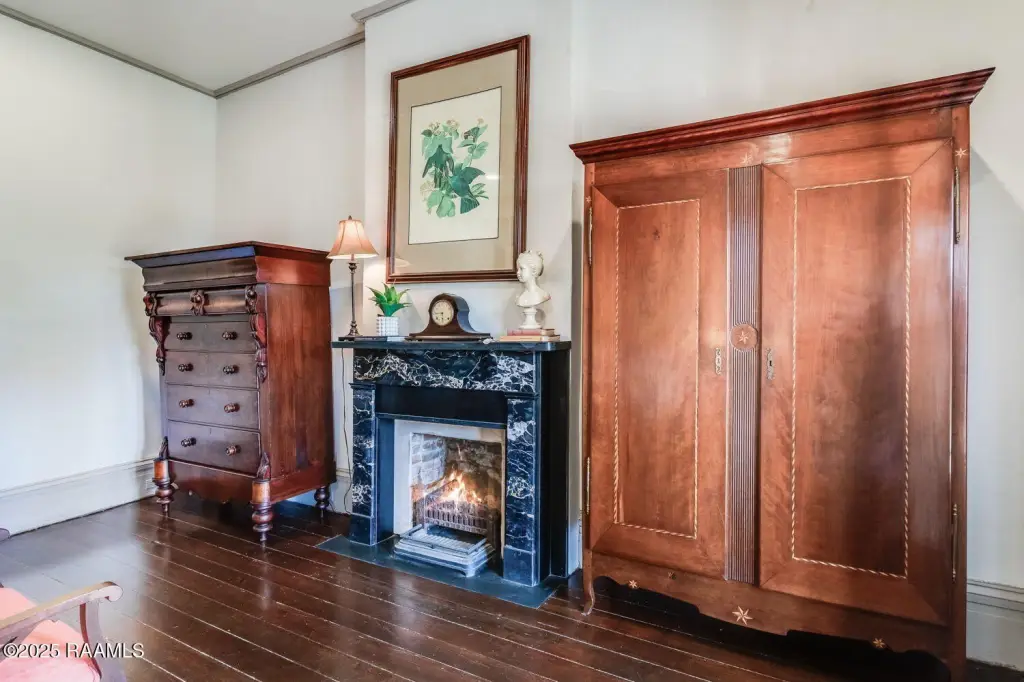
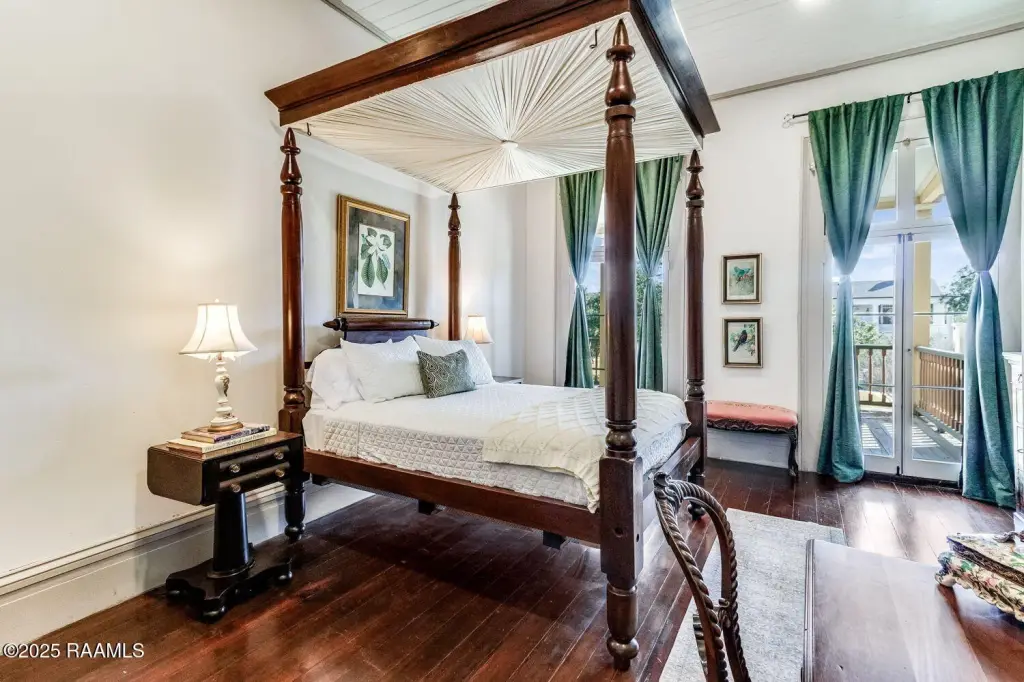
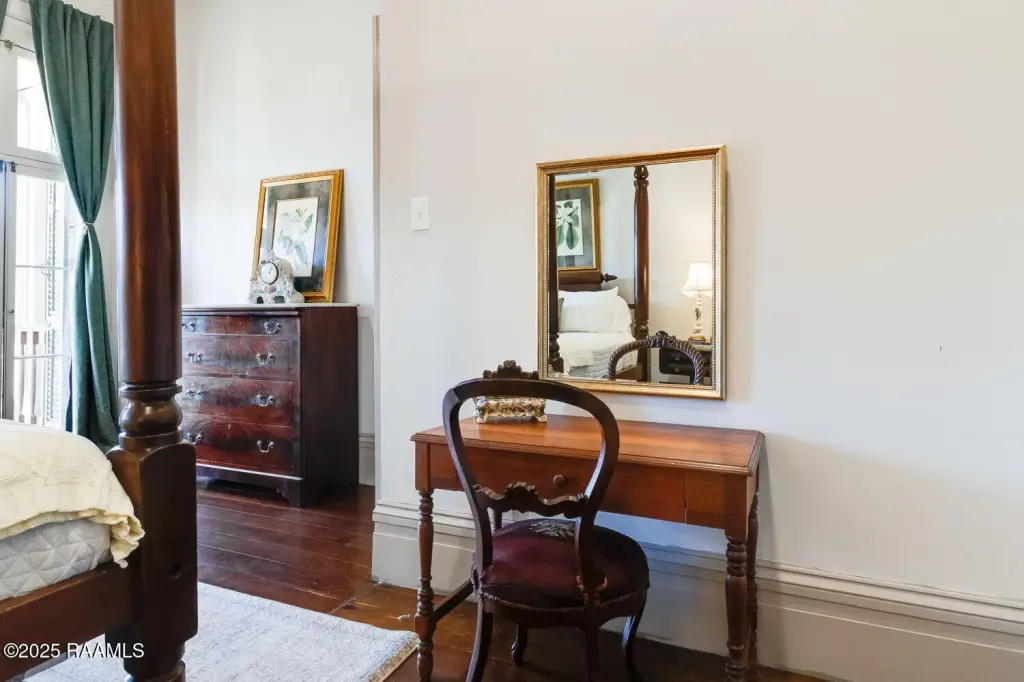
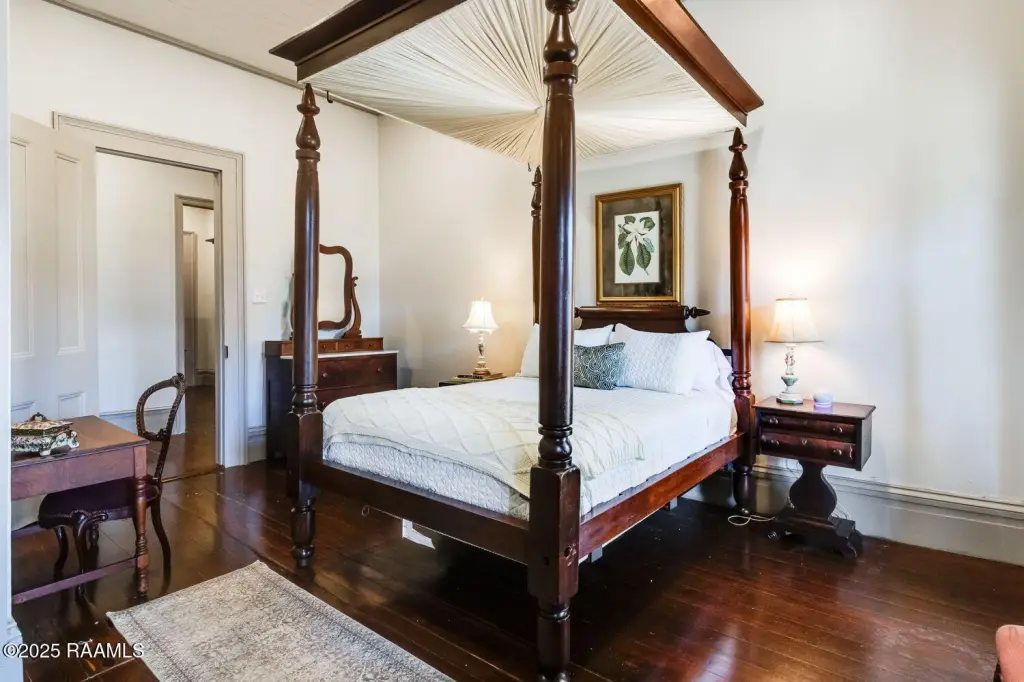
original wood floors
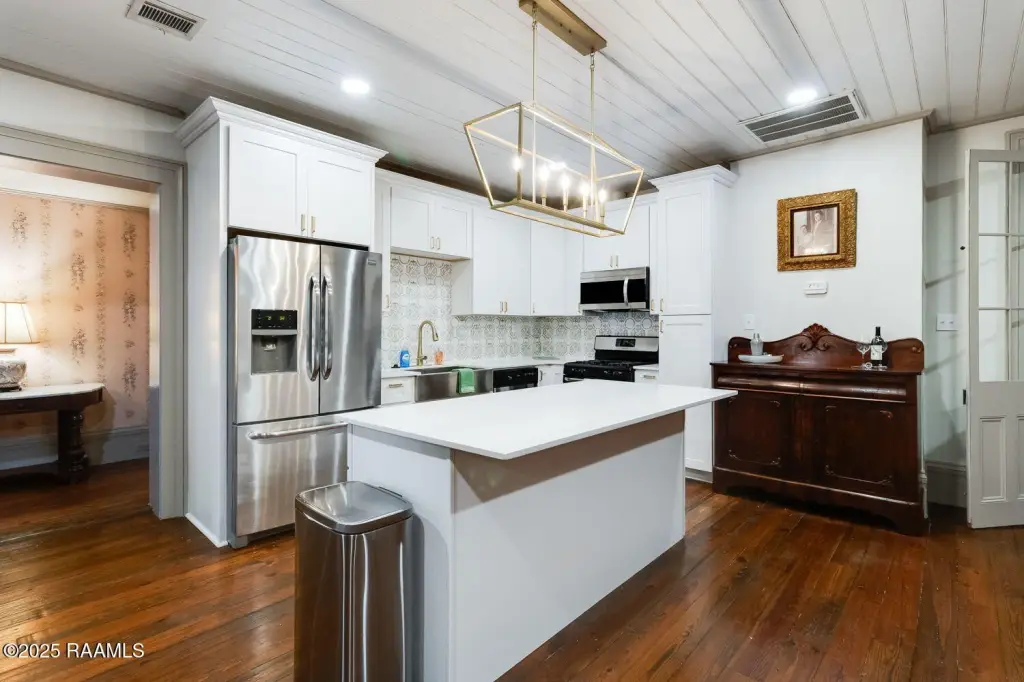
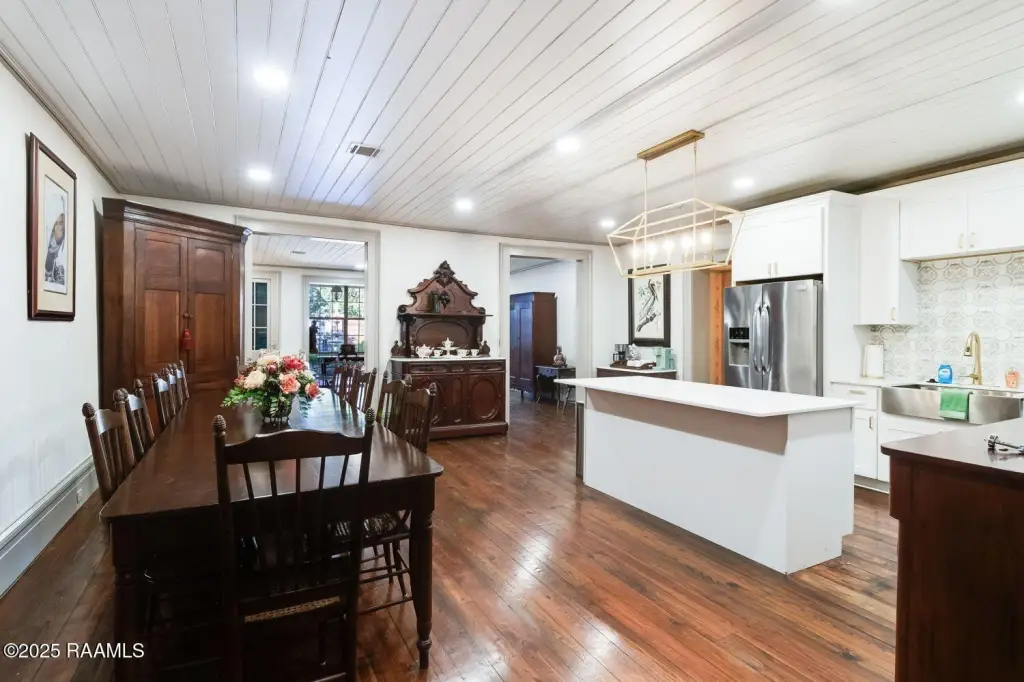
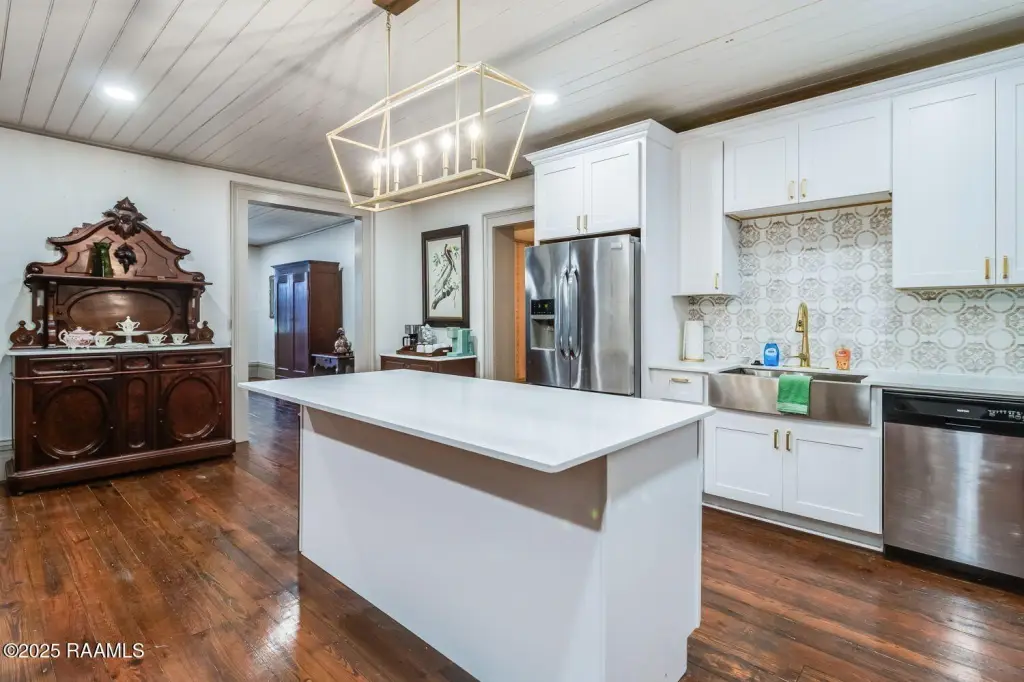
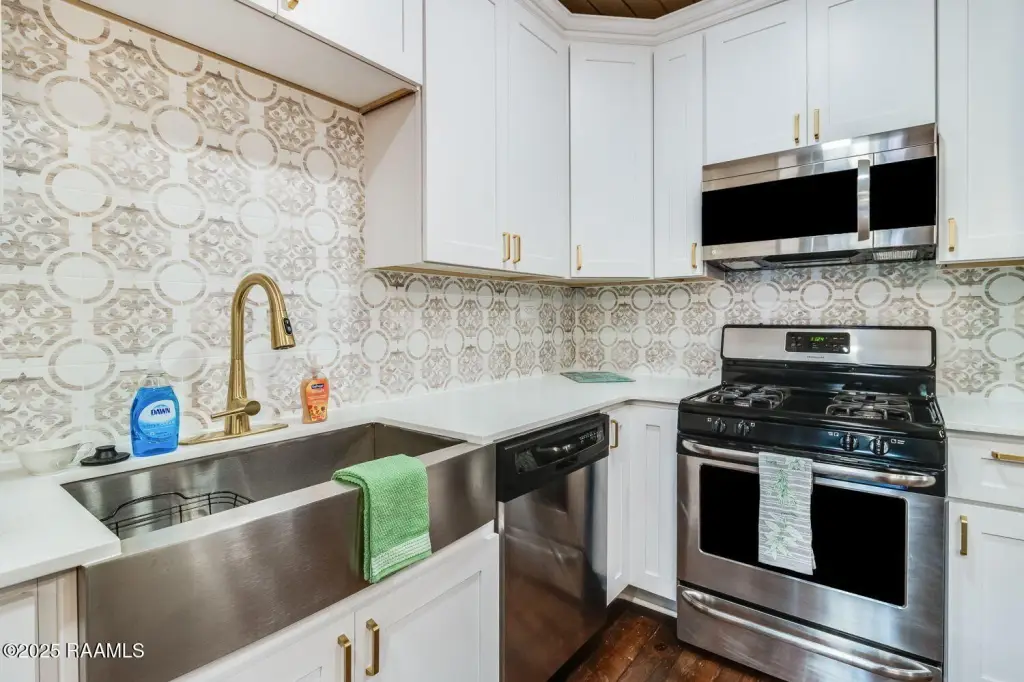
fully renovated kitchen
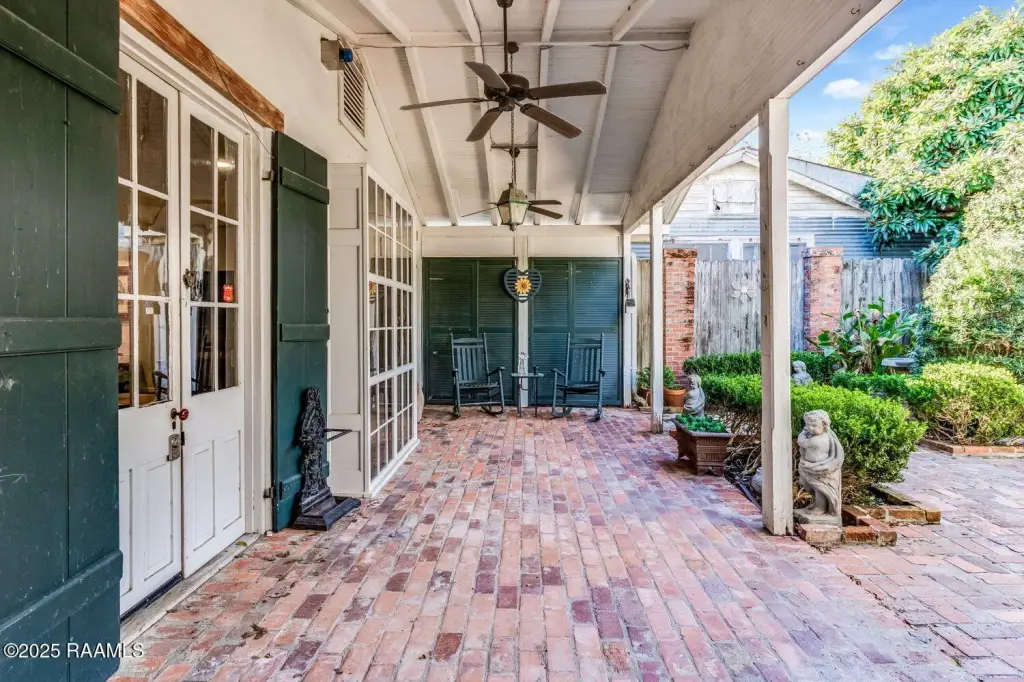
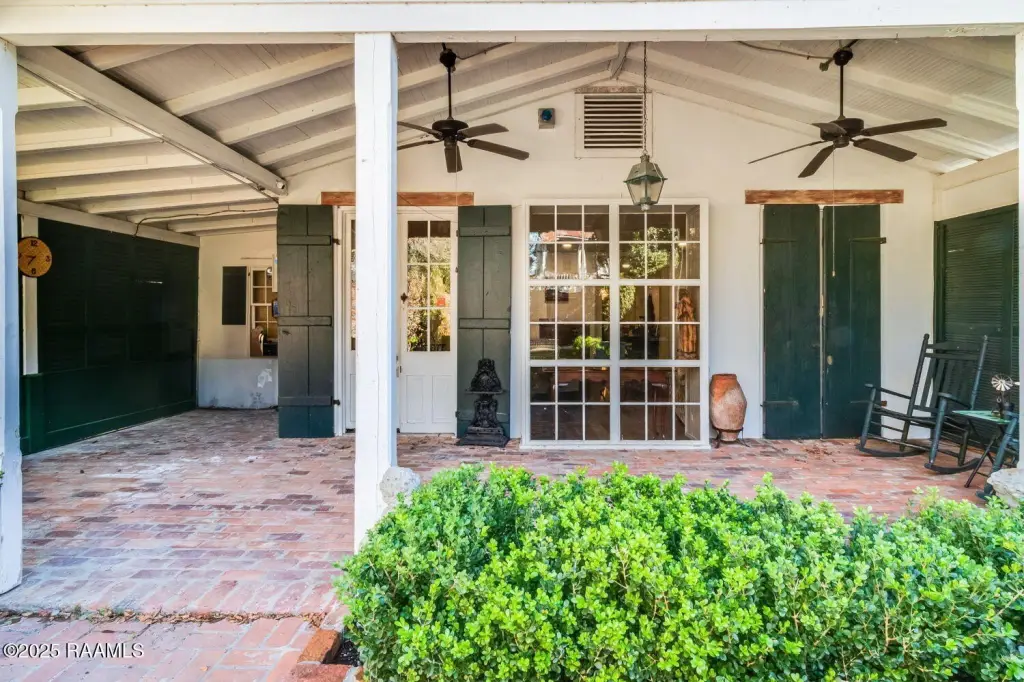
private courtyard
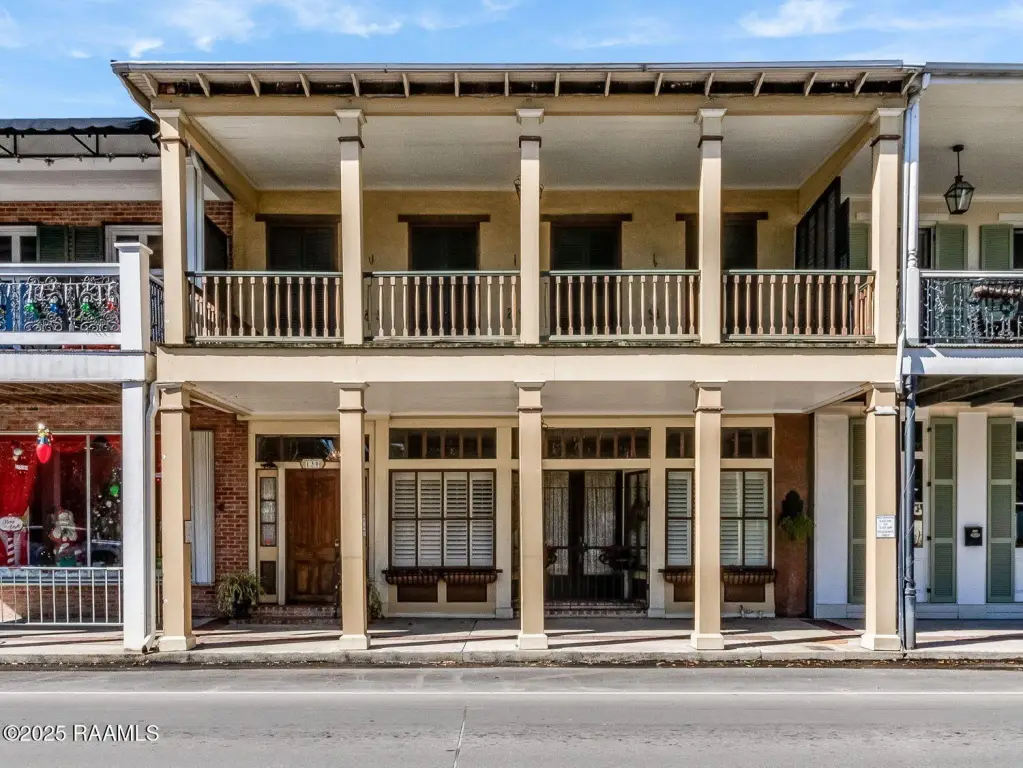
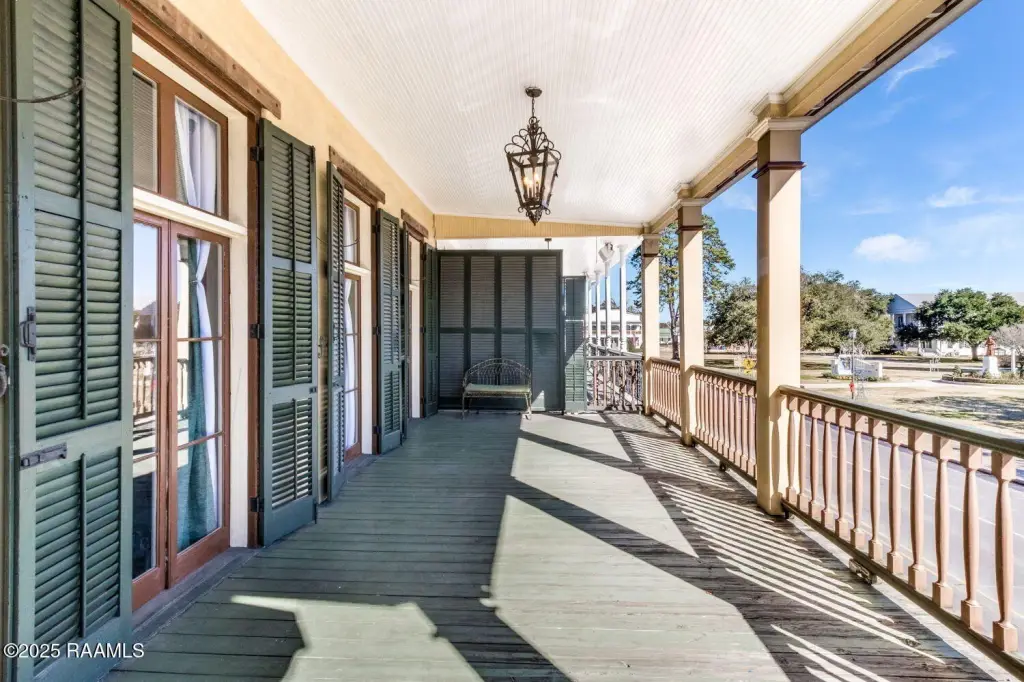
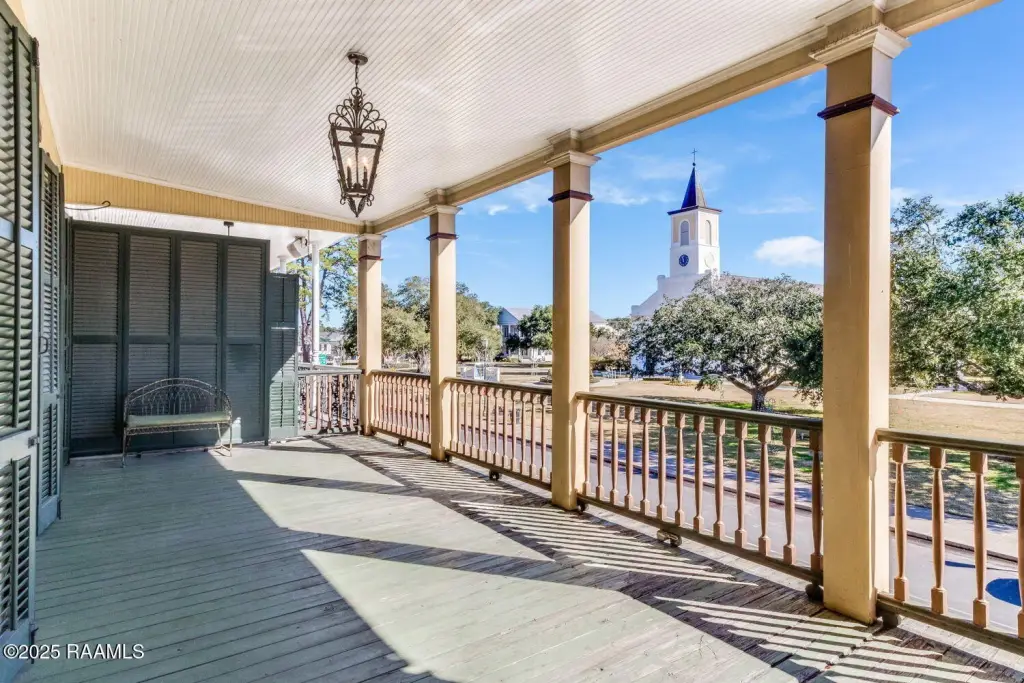
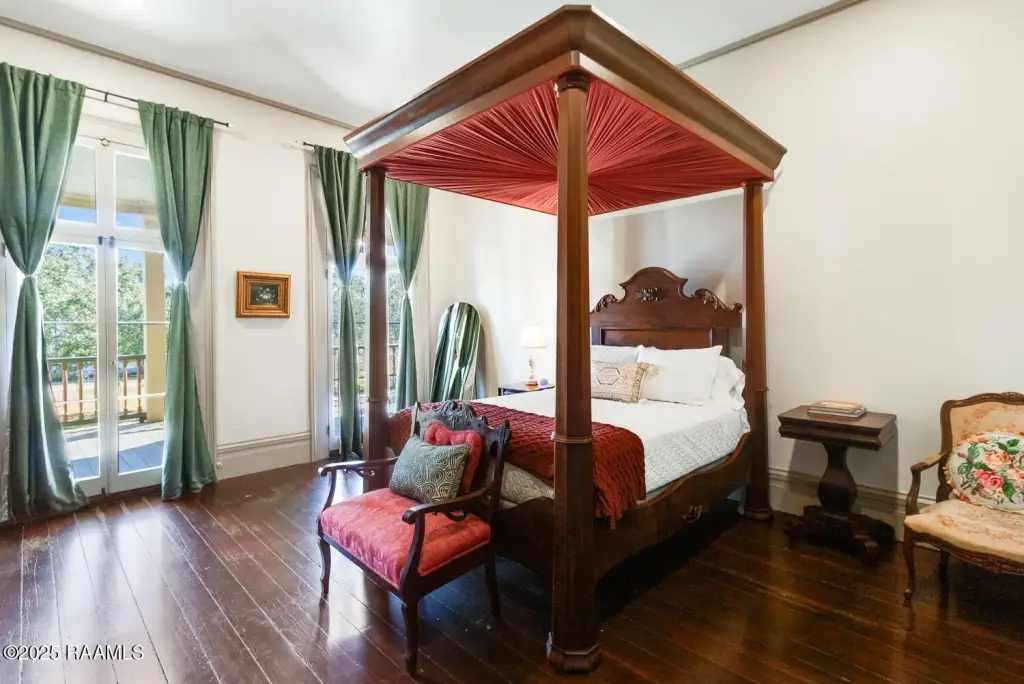
upstairs balcony
large display windows
Building Details
Floors in Building
2
Flooring type
Tile, Wood
Roof type
Metal
Listing Agency:
Real Broker, LLC
(337) 534-0555
Listed By:
Teresa W Rainey · License #0995691537
(337) 366-1454
Added: Apr 28, 2025
Changed: Sep 12
Last Checked: Oct 7 at 9:06AM
MLS# 2020023385
Copyright © 2026 Realtor Association of Acadiana. All rights reserved. All information provided by the listing agent/broker is deemed reliable but is not guaranteed and should be independently verified.
Investment Insights
Based on property information with market context.
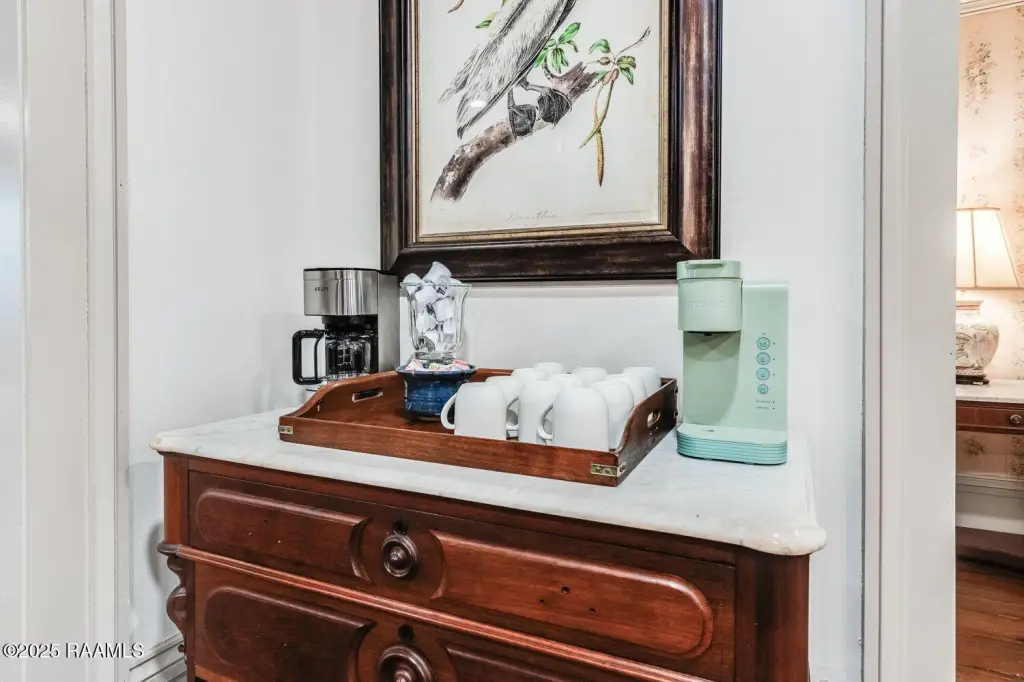
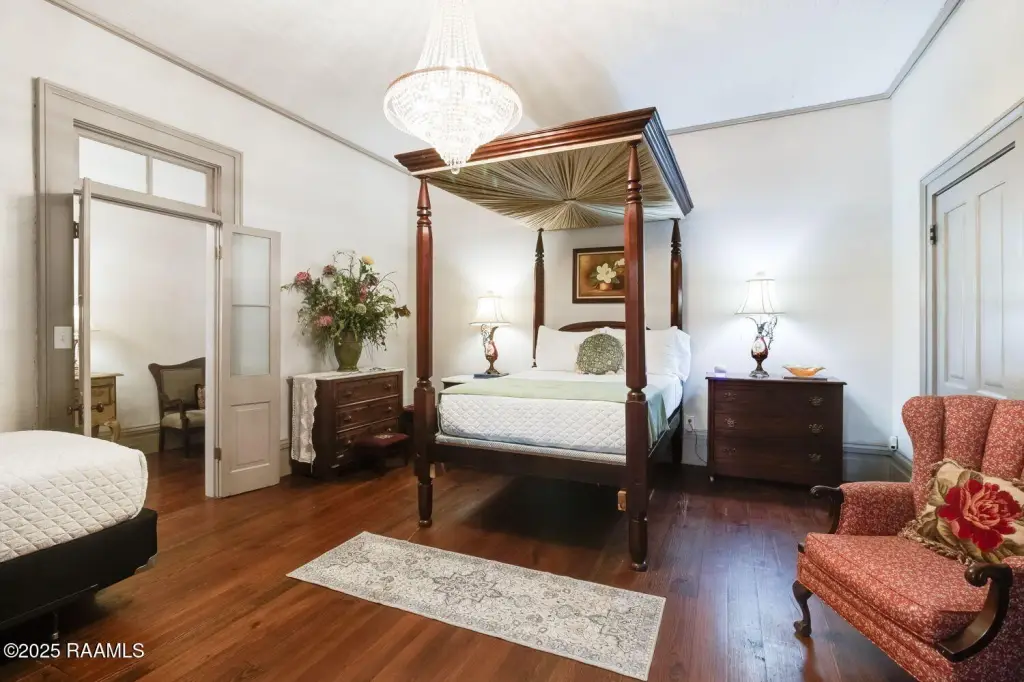
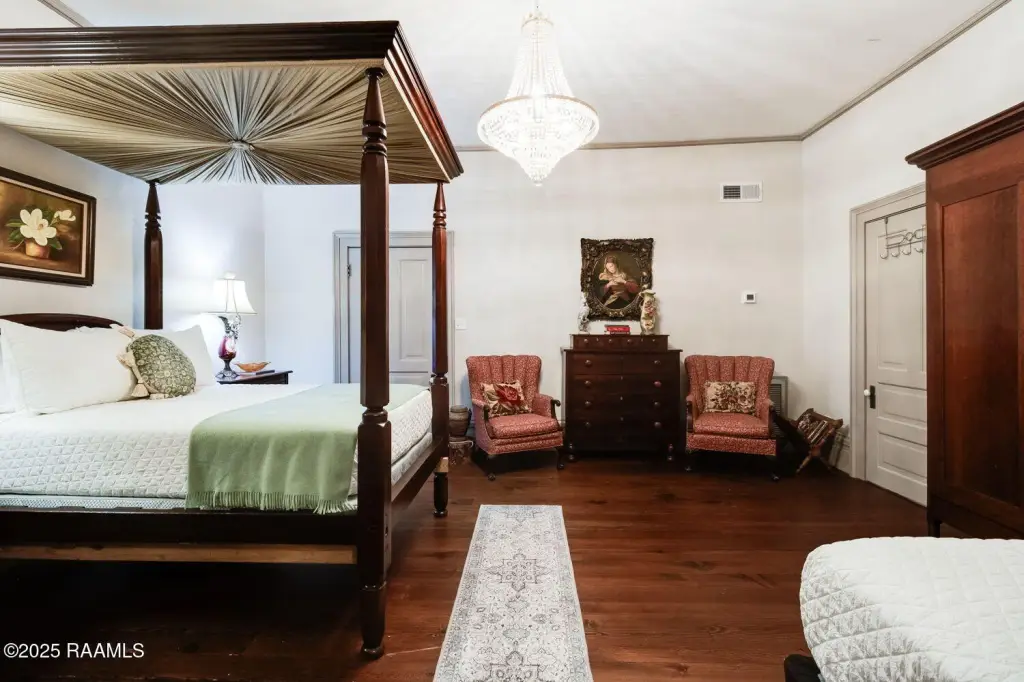
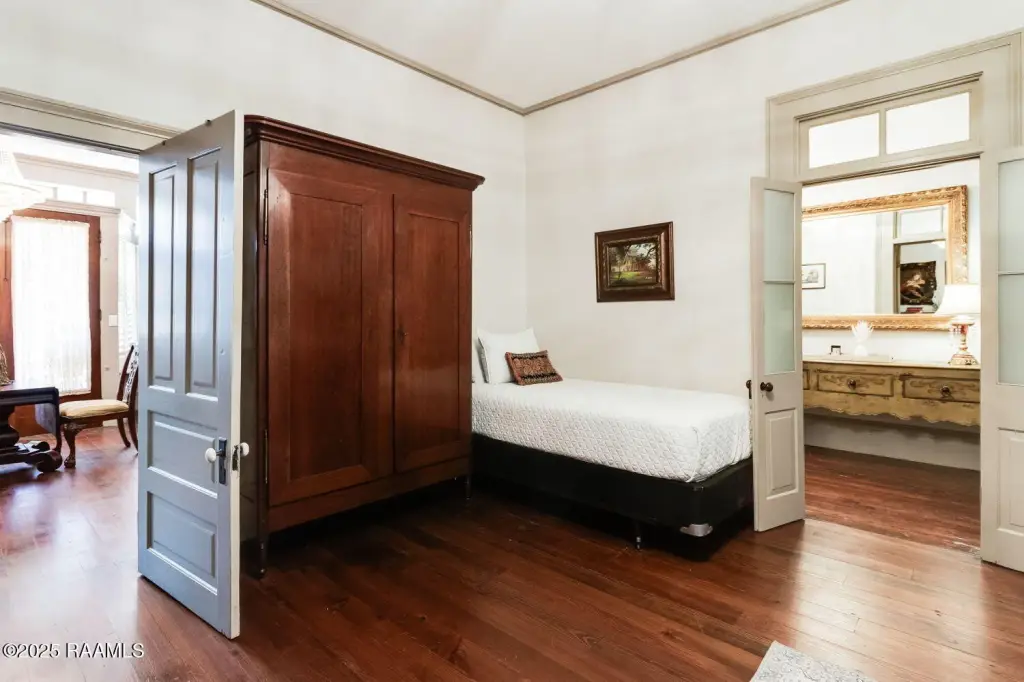
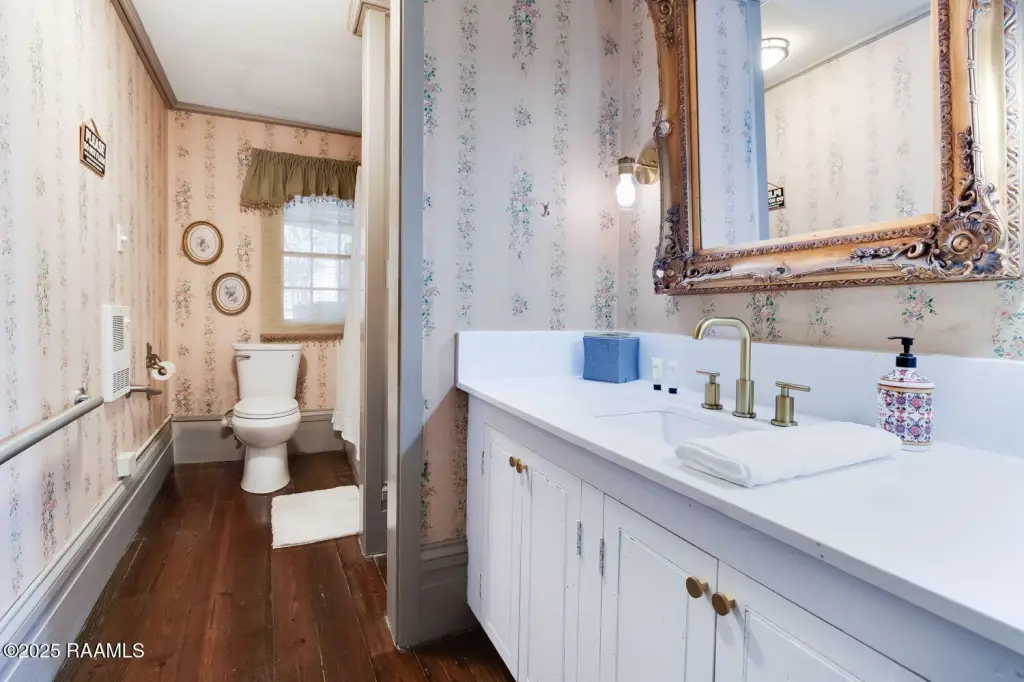
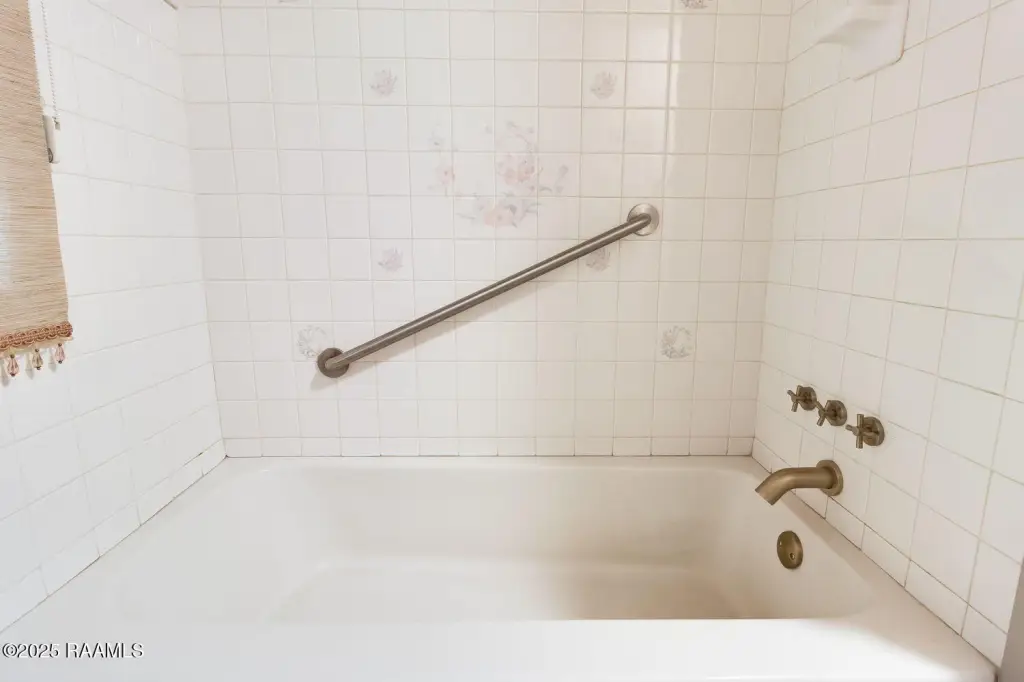
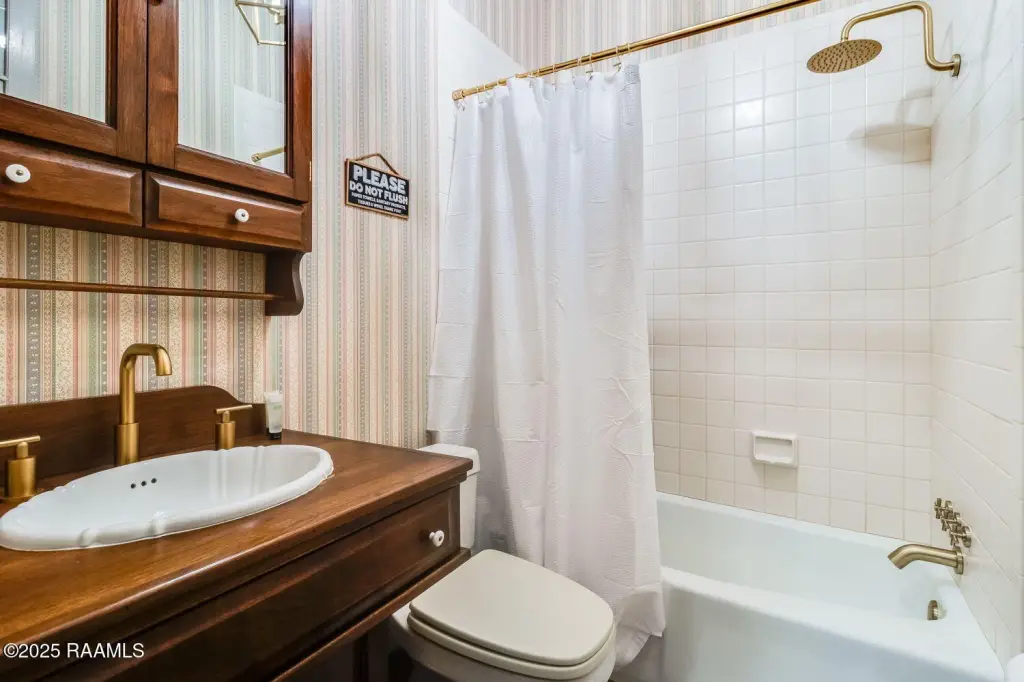
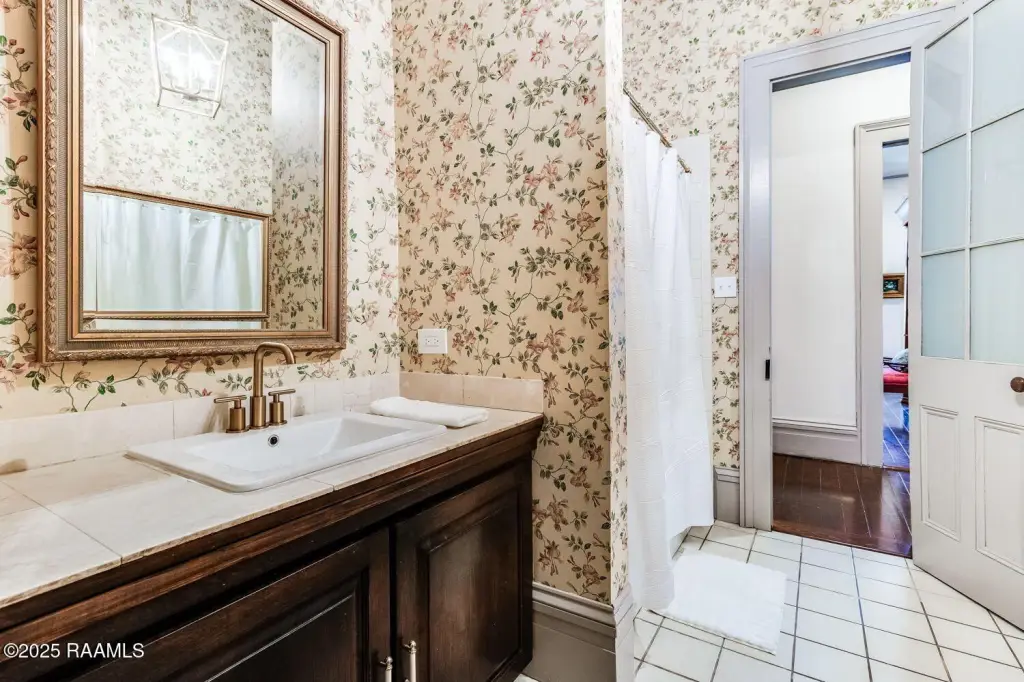
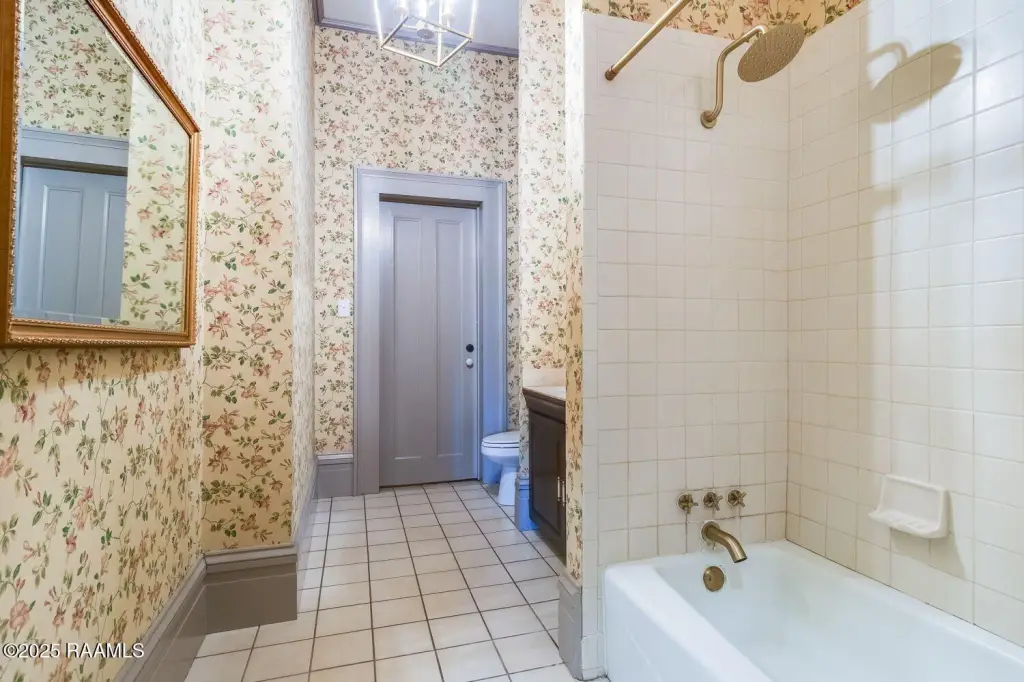
This 3,835-square-foot, two-story property is currently used as a short-term rental for wedding guests. The layout includes 4 bedrooms, 3 baths, original wood flooring, a fully renovated kitchen, and a private courtyard. Large display windows face the main street, while an upstairs balcony overlooks the square. Additional physical features include a full fence, metal roofing, public water, and a combination of tile and wood flooring.
The property is located at 130 S Main Street in St. Martinville, directly across from St. Martin de Tours square and the Evangeline Oak. Nearby restaurants, shops, and attractions are within walking distance. Zoning is C, and the building’s configuration supports the existing short-term rental use as well as bed and breakfast, office, retail, cafe, or creative workspace applications identified for the property.
The property is located at 130 S Main Street in St. Martinville, directly across from St. Martin de Tours square and the Evangeline Oak. Nearby restaurants, shops, and attractions are within walking distance. Zoning is C, and the building’s configuration supports the existing short-term rental use as well as bed and breakfast, office, retail, cafe, or creative workspace applications identified for the property.
Key Highlights
- 3,835‑square‑foot two‑story building with 4 bedrooms and 3 baths
- Currently operating as a short‑term rental for wedding guests
- Fully renovated kitchen, original wood floors, and private courtyard
Financial Insights
Estimated NOI and Cap Rate
NOI / Yr
$19,674
Cap Rate
4.92%
Suggested Prices Based on Cap Rates
Cap Rate 5%
$393,480
$393.5K
Cap Rate 7%
$281,057
$281.1K
Cap Rate 9%
$218,600
$218.6K
Market Conditions
NOI Build-Up for 3,835 SF
Gross rent
$55.2K $14.40/SF
− Vacancy
−$13.8K −$3.60/SF
EGI
$41.4K $10.80/SF
− OpEx
−$21.7K −$5.67/SF
NOI
$19.7K $5.13/SF
Area
St. Martin County, LA
Vacancy
25.00%
Lease Rate
$14.40 /SF/Yr
Expense Ratio
52.50%
Simulate Cap Rate and NOI
Suggested Prices Based on Cap Rates
Cap Rate 5%
$393,480
Cap Rate 7%
$281,057
Cap Rate 9%
$218,600
Alternative Uses
Best Use
Retail
$531.8K
$465.3K – $620.4K
NOI $37,225 @ 7.0% cap · market cap 9.32%
Second Best
Hotel Hospitality
$281.1K
$245.9K – $327.9K
NOI $19,674 @ 7.0% cap · market cap 4.92%
Theoretical Best
Office A
$842.2K
$736.9K – $982.5K
NOI $58,952 @ 7.0% cap · market cap 14.76%
Zoning and permitted uses should be independently verified with authorities.
Property Analytics
Unlock full access to Insights
Subscribe to Realmo Intelligence
Open Analytics
Current Use
Location Intelligence
Trade Area within ½ mile
347
Businesses Nearby
11k
Monthly Visits Nearby
Balanced
Demand for This Use
Explore this area
Business Placement
Foot Traffic Nearby
Shops & Services 70%
Dining 30%
SUBWAY
Dining
3,376 visits/mo
0.1 miles
Family Dollar
Shops & Services
2,482 visits/mo
0.5 miles
Home Bank
Shops & Services
1,887 visits/mo
0.1 miles
Whitney Bank
Shops & Services
1,306 visits/mo
0.1 miles
Texaco
Shops & Services
1,154 visits/mo
0.4 miles
Demographics for 70582, LA
19,088
Population
9,122
Households
2.1
Avg Household Size
41
Median Age
13%
College-Educated
84%
High-School Grad
148.0 sq mi
ZIP Area
129
Density / Sq Mi
$46,690
Median Household Income
$36,265
Median Earnings
$787
Median Rent
$149,100
Median Home Value
Check the figures for this property
Cap Rate, Value Estimation, Potential NOI and more
View Realmo Analytics
Market
Vacancy Rate% for Retail in South region

Questions? Ask Rey
Realmo’s AI knows this listing — price, zoning, demand, history. Ask anything.




Similar Off Market Nearby
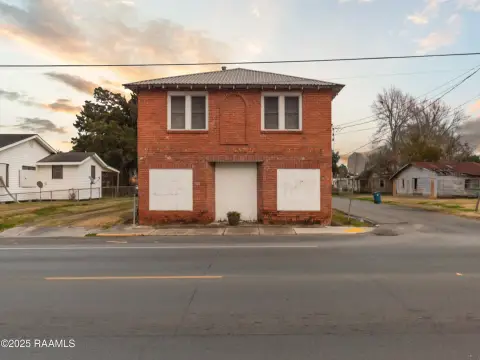
- Rocky Landry — 318 e port st, st martinville, la 70582
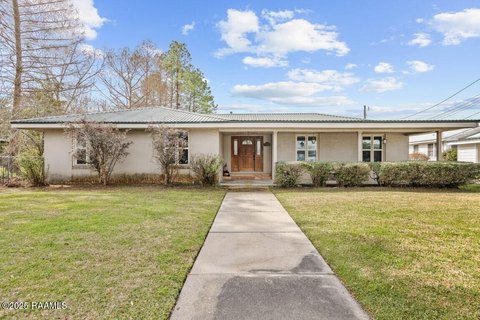
- Old Castillo Bed & Breakfast — 220 Evangeline Blvd, St Martinville, LA 70582
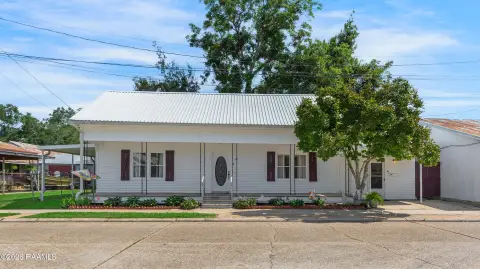
- Bienvenue House Bed and Breakfast — 421 N Main St, St Martinville, LA 70582
Frequently Asked Questions
What type of property is this?
Bed & breakfast - Two-story commercial property with guest accommodations, a renovated kitchen, display windows, and a private courtyard.
Where is this bed & breakfast located?
The property is located at 130 S Main Street Saint Martinville, LA.
What is the asking price?
The asking price for this property is $399,500.
What are key features of this property?
This property features: 3,835‑square‑foot two‑story building with 4 bedrooms and 3 baths; Currently operating as a short‑term rental for wedding guests; Fully renovated kitchen, original wood floors, and private courtyard


