Updated Four-Unit
For Sale
$2,695,000
130 Market Street, Santa Cruz, CA 95060
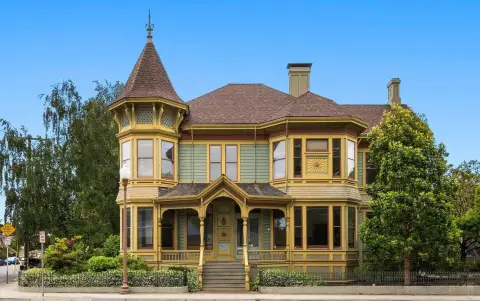
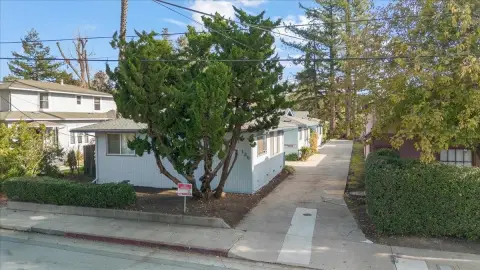
Four separate structures offer varied residential layouts, garage space, landscaped outdoor areas, and off-street parking.
Property Size3,744 SF
Price / SF$719.82
Days on Market64
Property Features for 130 Market Street
General Information
Standard status
Active
Size
3,744 SF
Total Parking Spaces
5
Property subtype
Residential Income
Zoning
R-1-5
Units
Unit Mix
2 x 3BR, 1 x 2BR, 1 x 1BR
Multifamily Units
4
Additional Details
Highway Access
Yes
Taxes and HOA fees
Annual Taxes
$16,439
Amenities
Central, Electric, Wall Furnace
Dishwasher, Refrigerator, Range Hood, Vented Exhaust Fan
Off Street
Craftsman, Traditional, Victorian
Building Details
Building Size
3,744 SF
Year Built
1908
Buildings
4
Listing Agency:
Miritz & Bailey Real Estate, Inc.
Listed By:
Marshall Keneipp · License #02115477
(303) 913-8113
Source:
Evrealestate
Added: Aug 5
Changed: Oct 7
Last Checked: Oct 5 at 5:49PM
Displayed information is deemed reliable but is not guaranteed and should be independently verified. All listing content including descriptions, pricing, images are the copyrighted material of Miritz & Bailey Real Estate, Inc.
Investment Insights
Based on property information with market context.
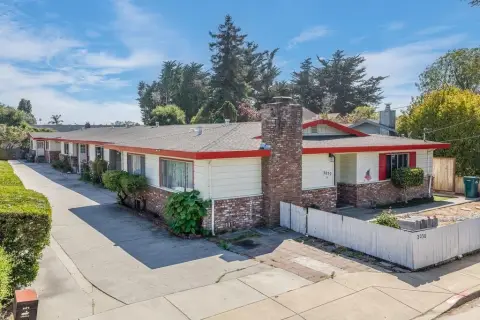
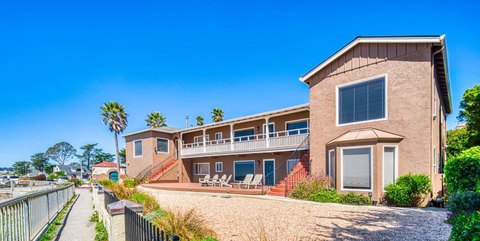
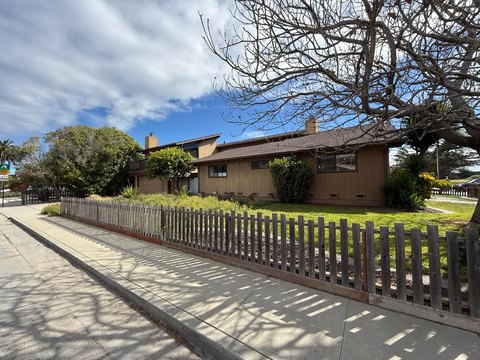
Built in 1908, this multifamily property combines four separate structures with a varied residential configuration. The improvements include an updated three-bedroom Victorian house, a two-bedroom cottage, and a duplex containing one-bedroom and three-bedroom units. A separate four-bay garage building provides additional garage capacity and supplemental living space above the garages. The property also includes off-street parking and a landscaped lot with outdoor areas.
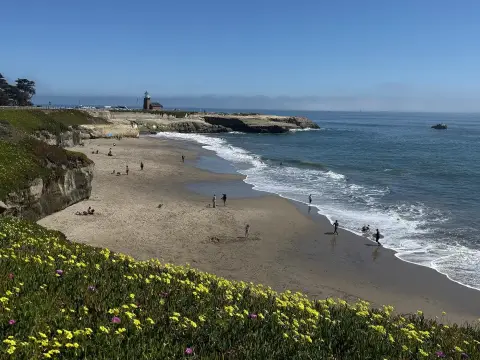
The address is near downtown Santa Cruz, with stated walkability to restaurants, shops, Highway 1, the pier, the Boardwalk, and beaches. The location carries a Walk Score of 83, a Bike Score of 94, and a Transit Score of 35. Energy-efficiency improvements are reported throughout the property, and the source information notes a possible ADU conversion subject to current state and local regulations.
The address is near downtown Santa Cruz, with stated walkability to restaurants, shops, Highway 1, the pier, the Boardwalk, and beaches. The location carries a Walk Score of 83, a Bike Score of 94, and a Transit Score of 35. Energy-efficiency improvements are reported throughout the property, and the source information notes a possible ADU conversion subject to current state and local regulations.
Key Highlights
- Four separate structures with a three‑bedroom house, two‑bedroom cottage, and one‑bedroom/three‑bedroom duplex
- Separate 4‑bay garage building with supplemental living space above
- Built in 1908 with updated and maintained residential improvements
Financial Insights
Estimated NOI and Cap Rate
NOI / Yr
$104,384
Cap Rate
3.87%
Suggested Prices Based on Cap Rates
Cap Rate 5%
$2,087,680
$2.1M
Cap Rate 7%
$1,491,200
$1.5M
Cap Rate 9%
$1,159,822
$1.2M
Market Conditions
NOI Build-Up for 3,744 SF
Gross rent
$152.8K $40.80/SF
− Vacancy
−$3.6K −$0.97/SF
EGI
$149.1K $39.83/SF
− OpEx
−$44.7K −$11.95/SF
NOI
$104.4K $27.88/SF
Area
Santa Cruz County, CA
Vacancy
2.38%
Lease Rate
$40.80 /SF/Yr
Expense Ratio
30.00%
Simulate Cap Rate and NOI
Suggested Prices Based on Cap Rates
Cap Rate 5%
$2,087,680
Cap Rate 7%
$1,491,200
Cap Rate 9%
$1,159,822
Alternative Uses
Best Use
Multifamily LT 5
$1.49M
$1.30M – $1.74M
NOI $104,384 @ 7.0% cap · market cap 3.87%
Second Best
Apartment 5plus
$1.38M
$1.20M – $1.61M
NOI $96,371 @ 7.0% cap · market cap 3.58%
Theoretical Best
Retail
$2.14M
$1.87M – $2.50M
NOI $149,857 @ 7.0% cap · market cap 5.56%
Zoning and permitted uses should be independently verified with authorities.
Property Analytics
Unlock full access to Insights
Subscribe to Realmo Intelligence
Open Analytics
Current Use
Lease Details
4
Residential units
Yes
Highway access
Location Intelligence
Trade Area within ½ mile
3,135
Businesses Nearby
Explore this area
Business Placement
Demographics for 95060, CA
47,931
Population
20,181
Households
2.4
Avg Household Size
39
Median Age
55%
College-Educated
94%
High-School Grad
54.5 sq mi
ZIP Area
879
Density / Sq Mi
$106,040
Median Household Income
$46,231
Median Earnings
$2,356
Median Rent
$1,189,300
Median Home Value
Check the figures for this property
Cap Rate, Value Estimation, Potential NOI and more
View Realmo Analytics
Market
Vacancy Rate% for Multifamily in West region

Questions? Ask Rey
Realmo’s AI knows this listing — price, zoning, demand, history. Ask anything.





Frequently Asked Questions
What type of property is this?
Quadplex - Four separate structures offer varied residential layouts, garage space, landscaped outdoor areas, and off-street parking.
Where is this quadplex located?
The property is located at 130 Market Street Santa Cruz, CA.
What is the asking price?
The asking price for this property is $2,695,000.
What are key features of this property?
This property features: Four separate structures with a three‑bedroom house, two‑bedroom cottage, and one‑bedroom/three‑bedroom duplex; Separate 4‑bay garage building with supplemental living space above; Built in 1908 with updated and maintained residential improvements


