Corner Storefront
For Sale
$1,850,000
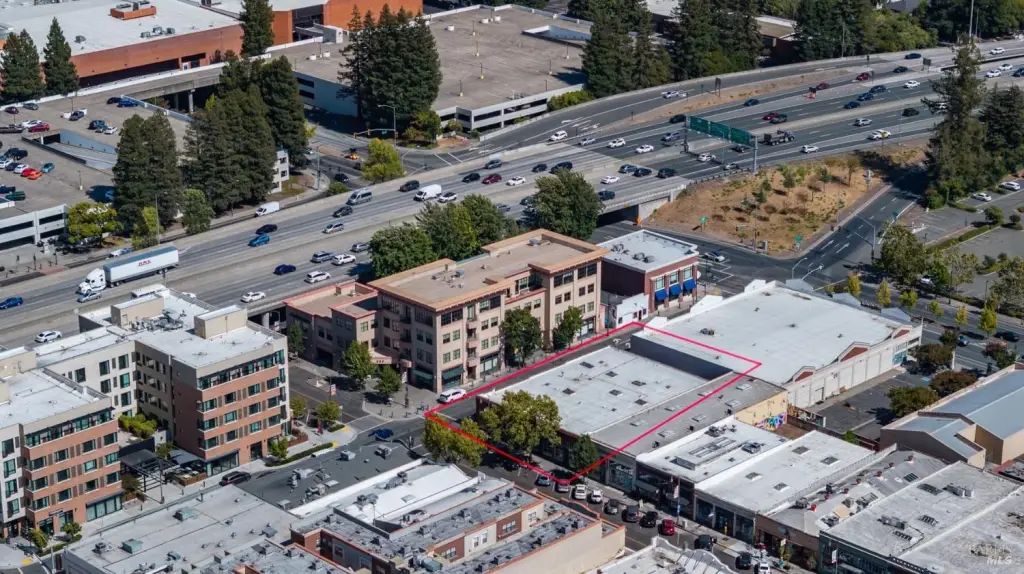
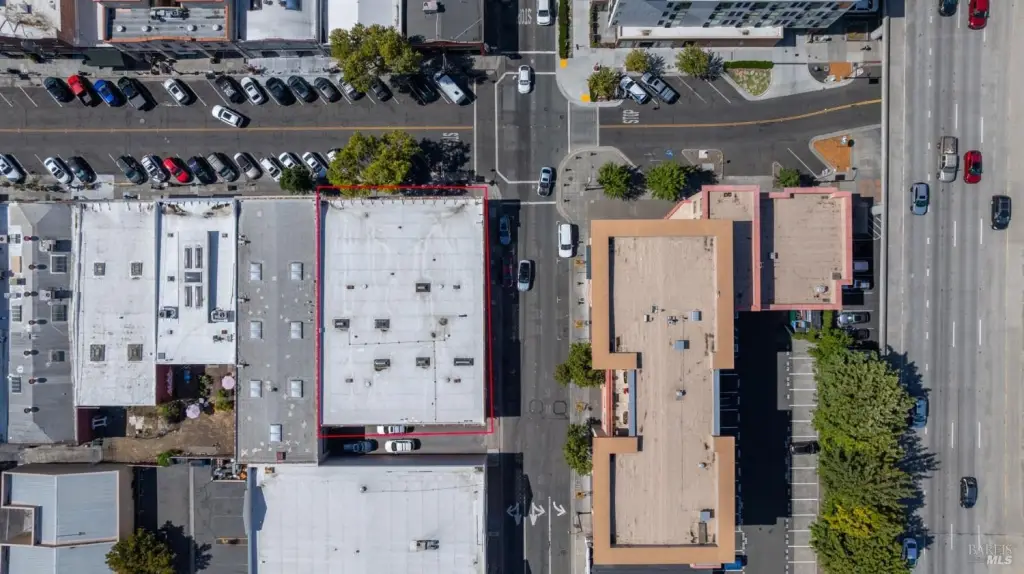
130 4th Street, Santa Rosa, CA 95401
Commercial Sale, Santa Rosa, CA
Property Size10,800 SF
Lot Size0.25 Acres
Price / SF$171.30
Days on Market51
Property Features for 130 4th Street
General Information
Property type
Commercial Sale
Property subtype
Retail
Parking features
On Street
Lot features
Corner Lot
Directions
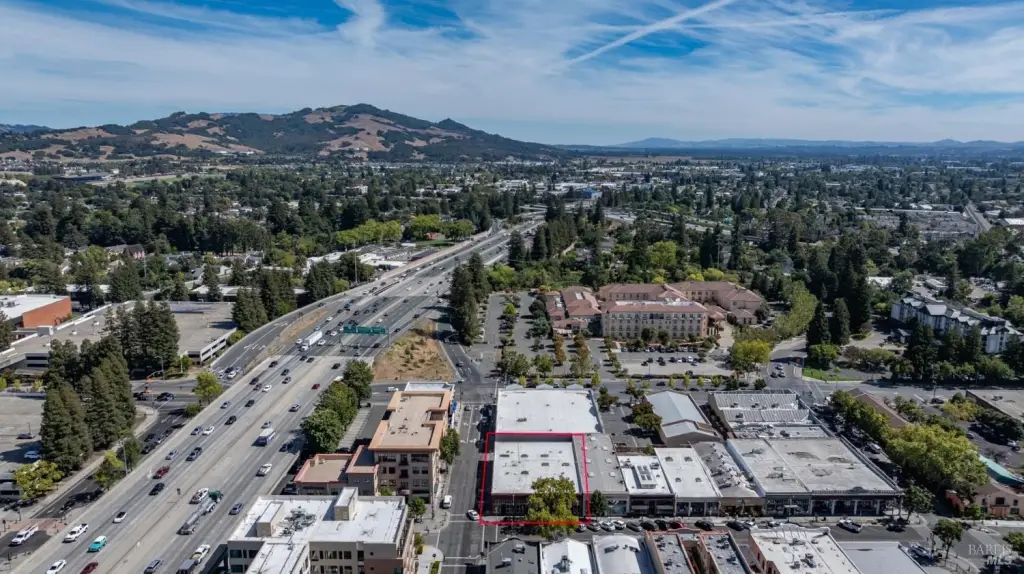
From Hwy 101 south, take exit 489 to Morgan St. Left on 4th St. On the left at the SW corner of Davis St and 4th St. From Hwy 101 north, take exit 489 to Davis St. Right on 6th St. First left on Wilson St. First left on 4th St. On the right at the SW corner of Davis St and 4th St.
Subdivision
Santa Rosa-Northwest
Standard status
Active
APN
010075001000
Lot size
0.25 Acres
Building Details
Year built
1912
Floors in Building
1
Flooring type
Carpet, Concrete
Building materials
Brick
Listing Agency:
W Real Estate
(707) 591-0570
Listed By:
Todd Schapmire · License #01414195
(707) 570-9855
Added: Aug 25
Changed: Sep 14
Last Checked: Oct 14 at 5:06AM
MLS# 326066148
Copyright © 2026 Bay Area Real Estate Information Services, Inc. All rights reserved. All information provided by the listing agent/broker is deemed reliable but is not guaranteed and should be independently verified.
Investment Insights
Based on property information with market context.
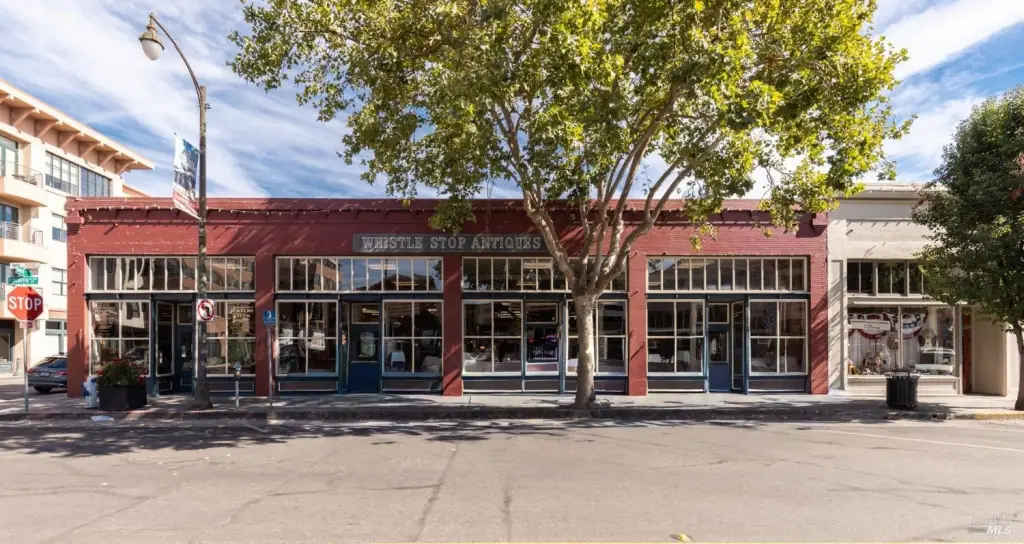
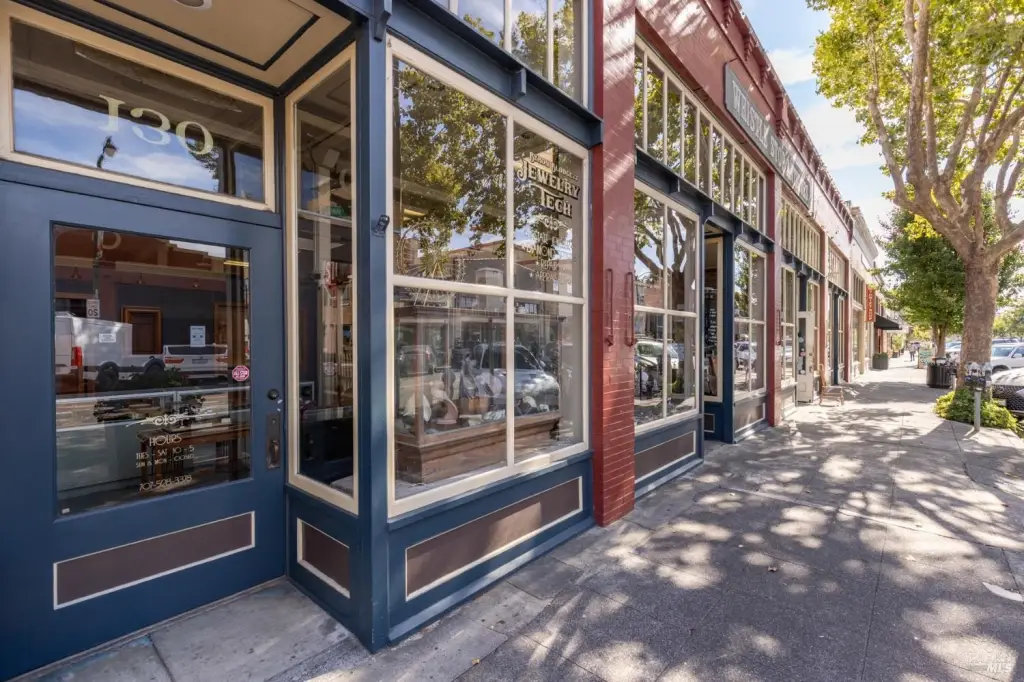
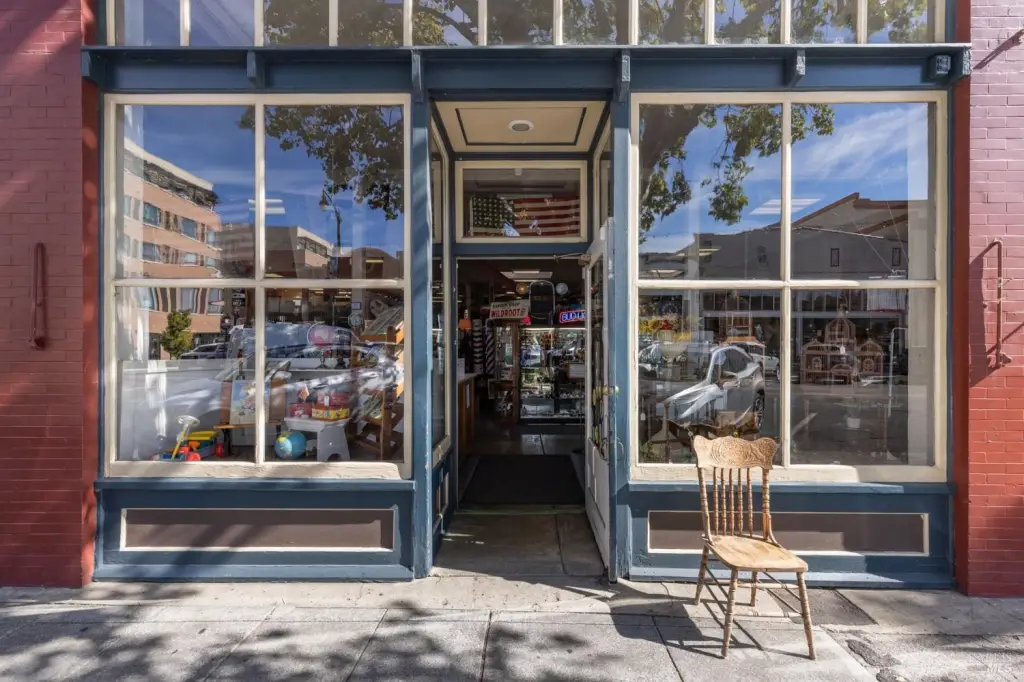
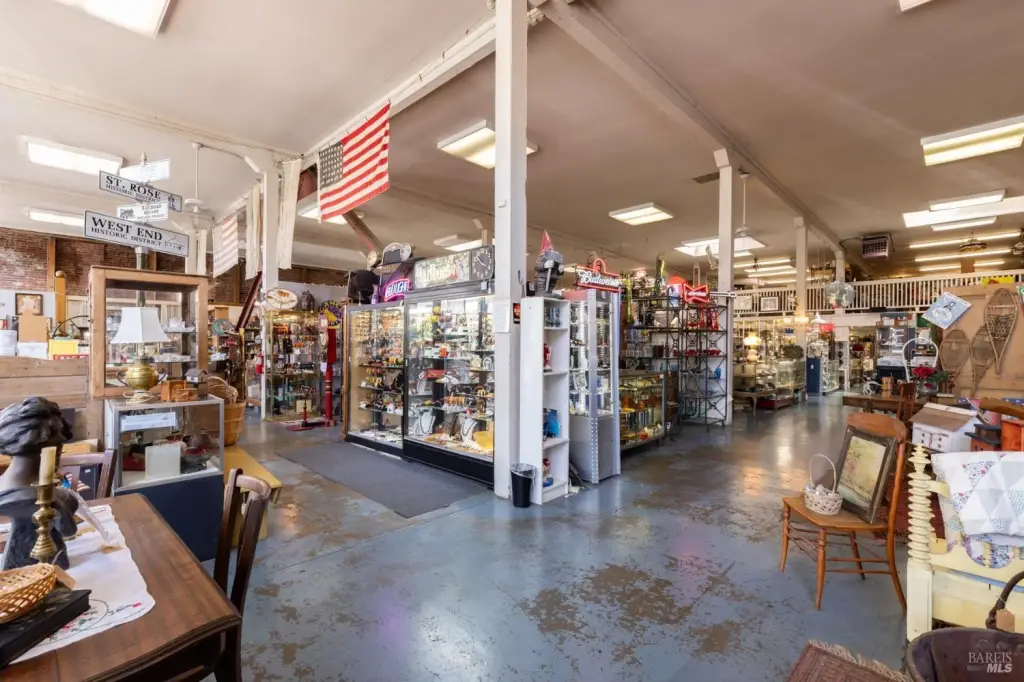
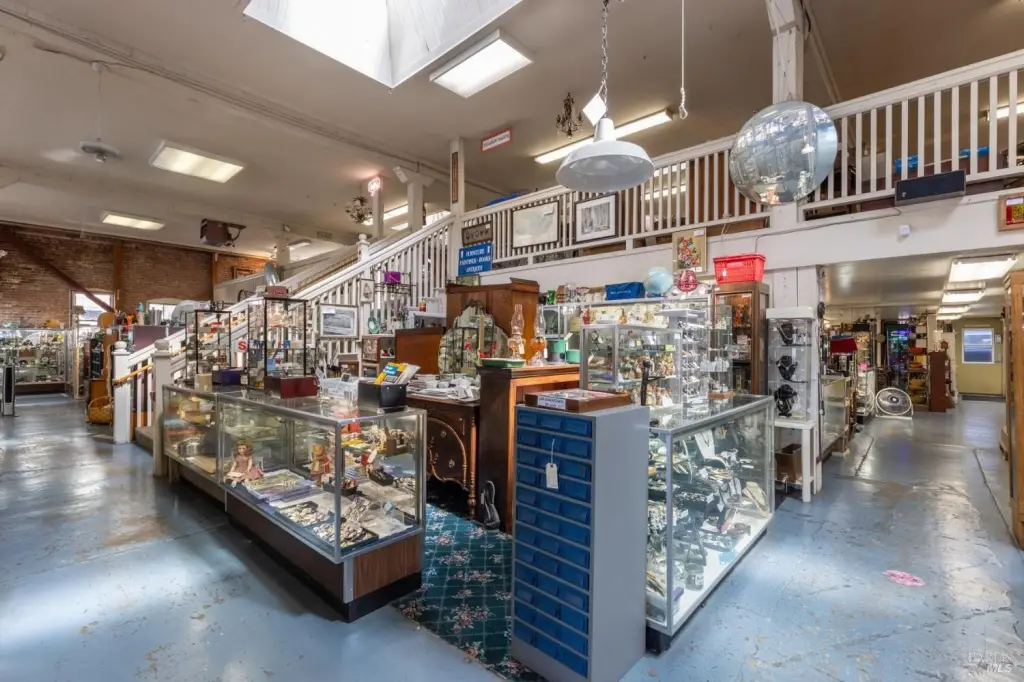
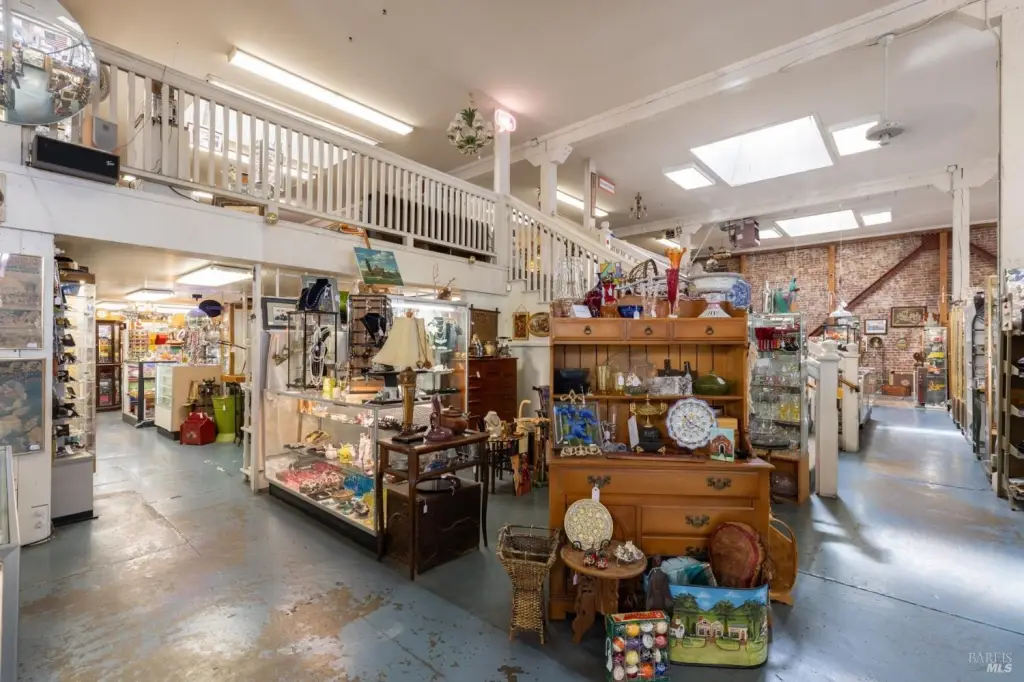
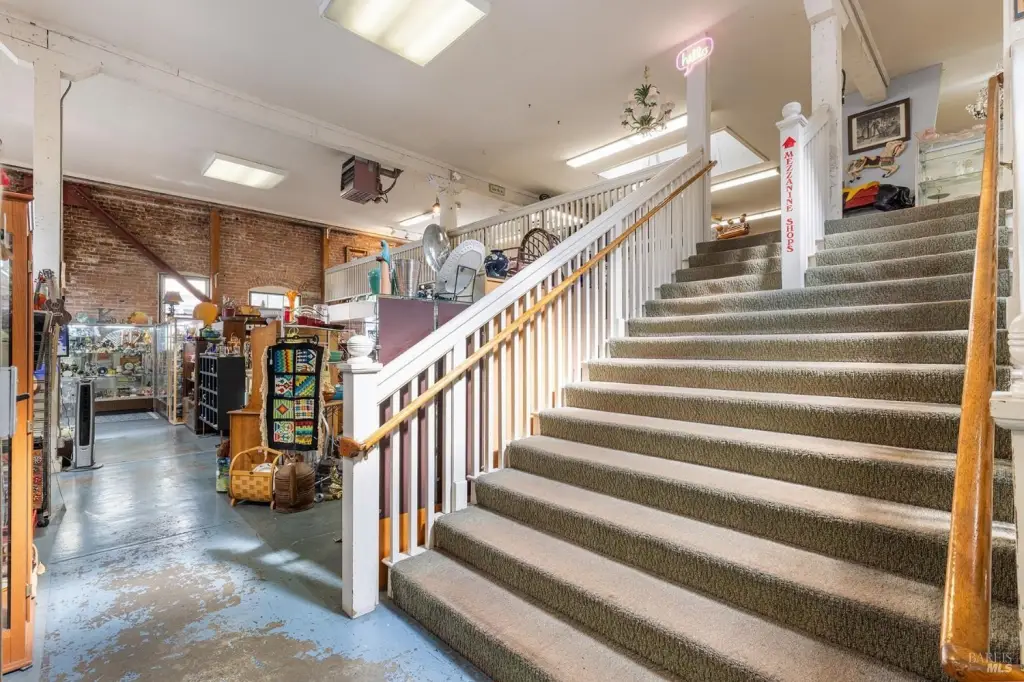
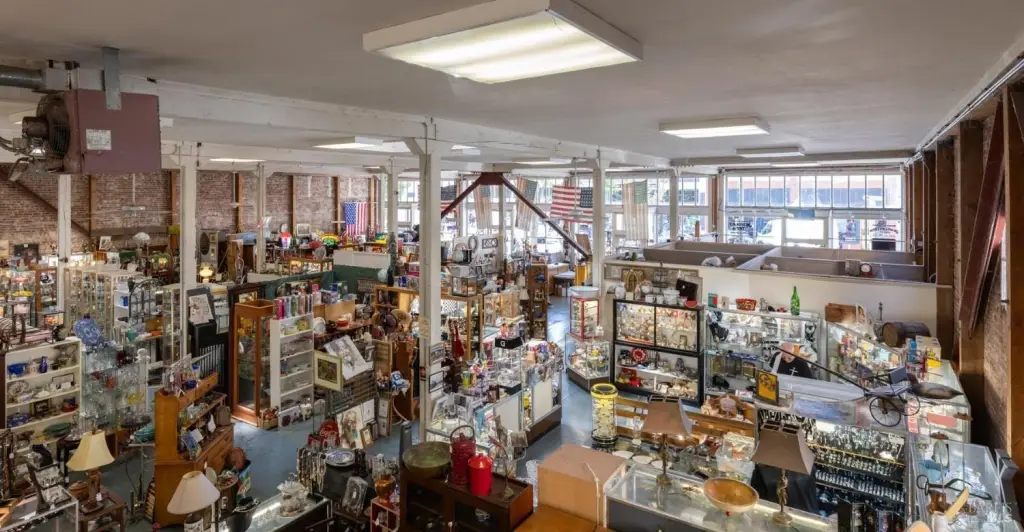
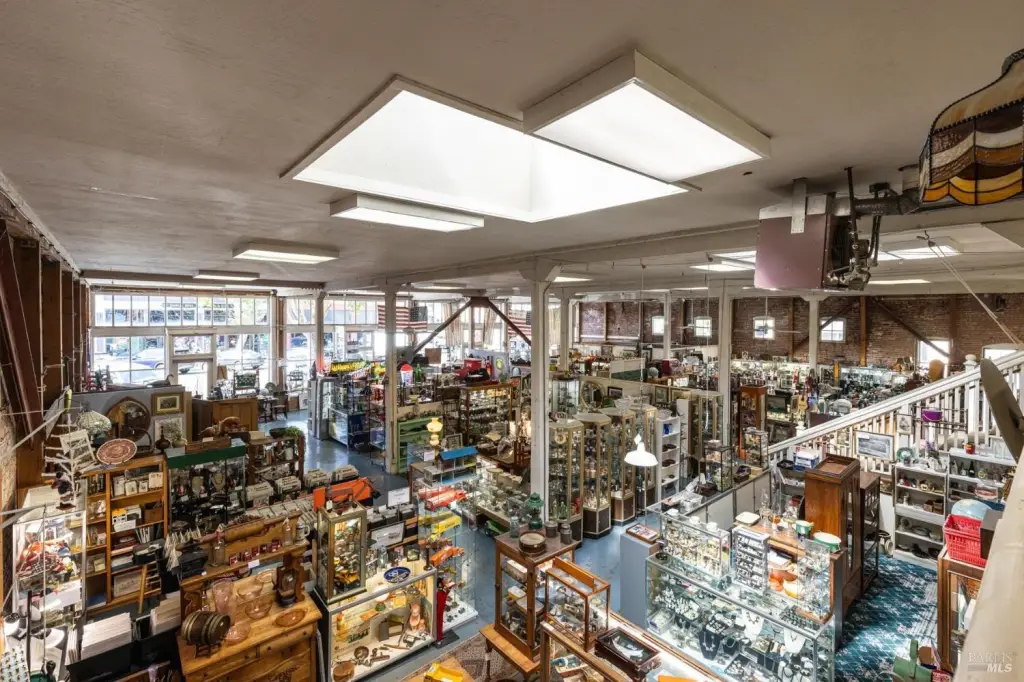
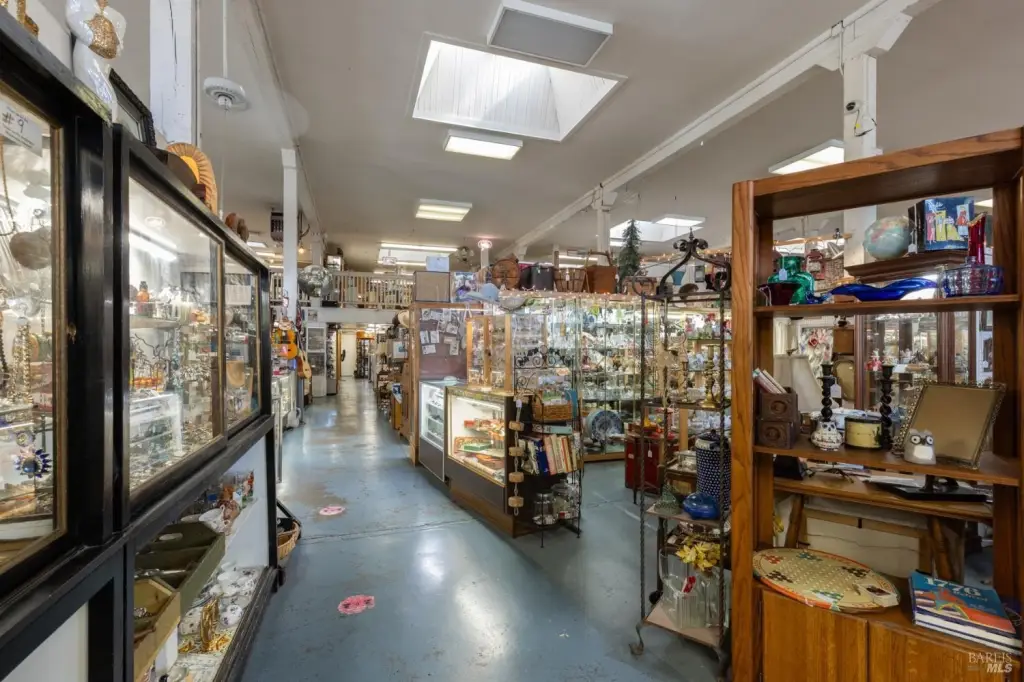
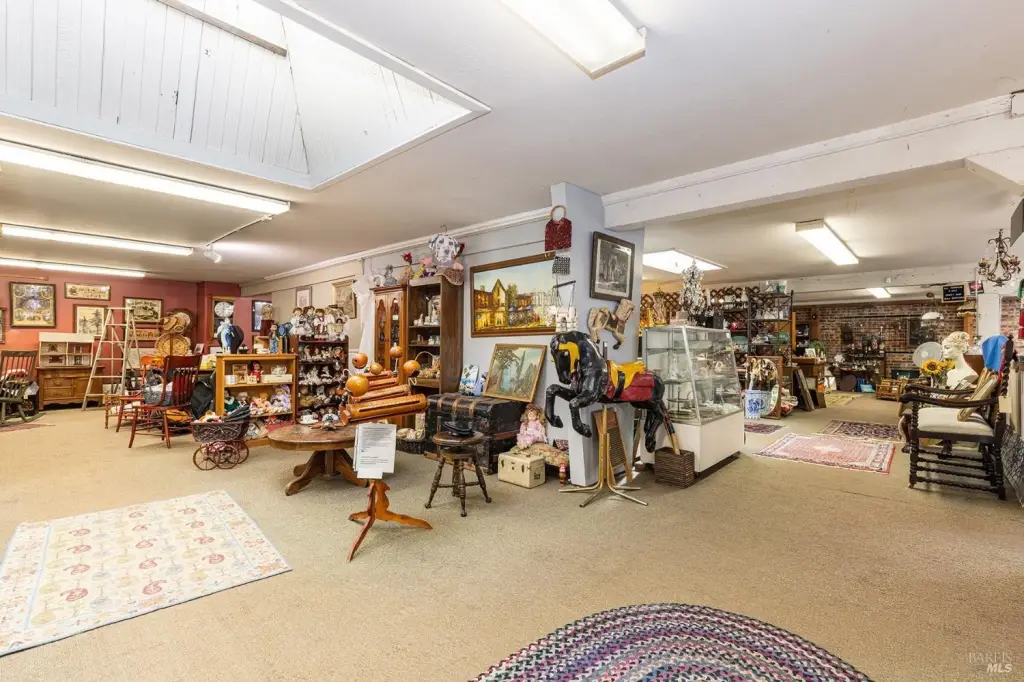
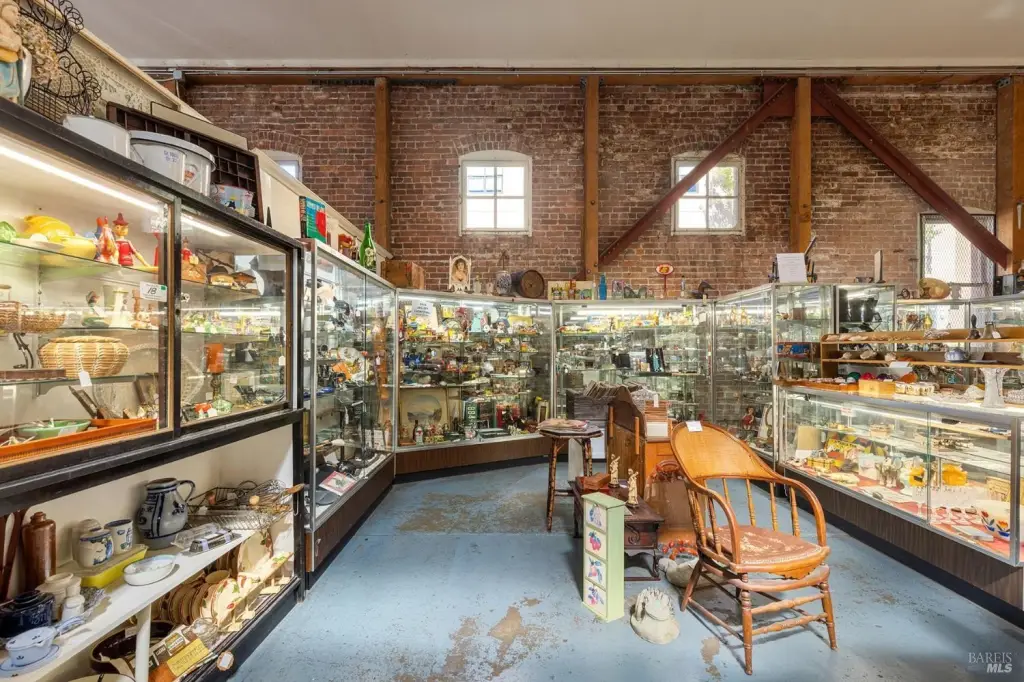
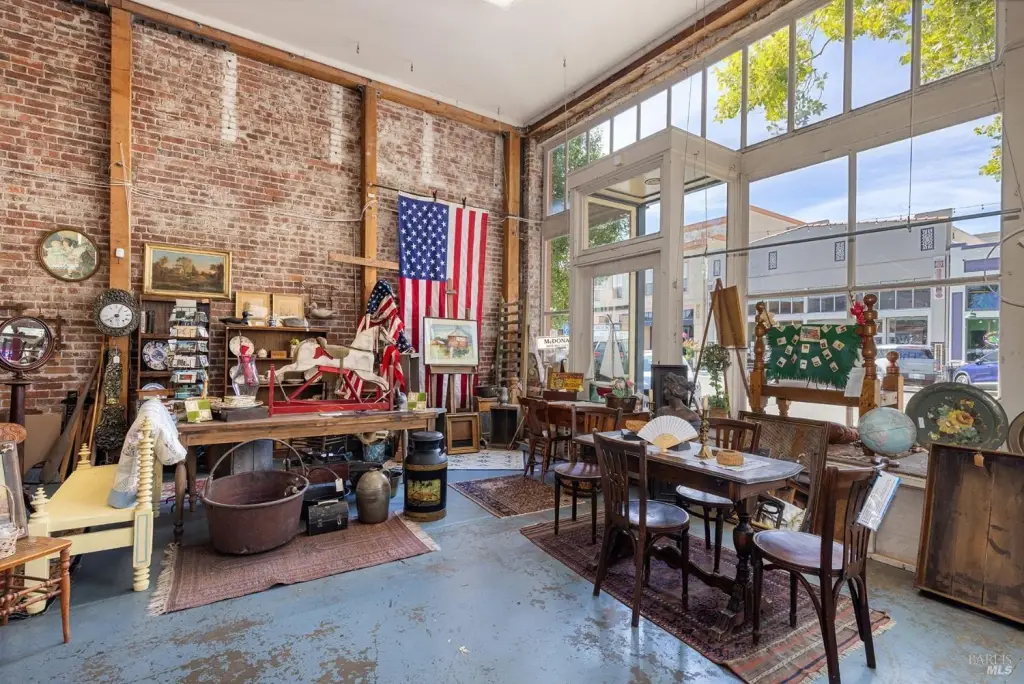
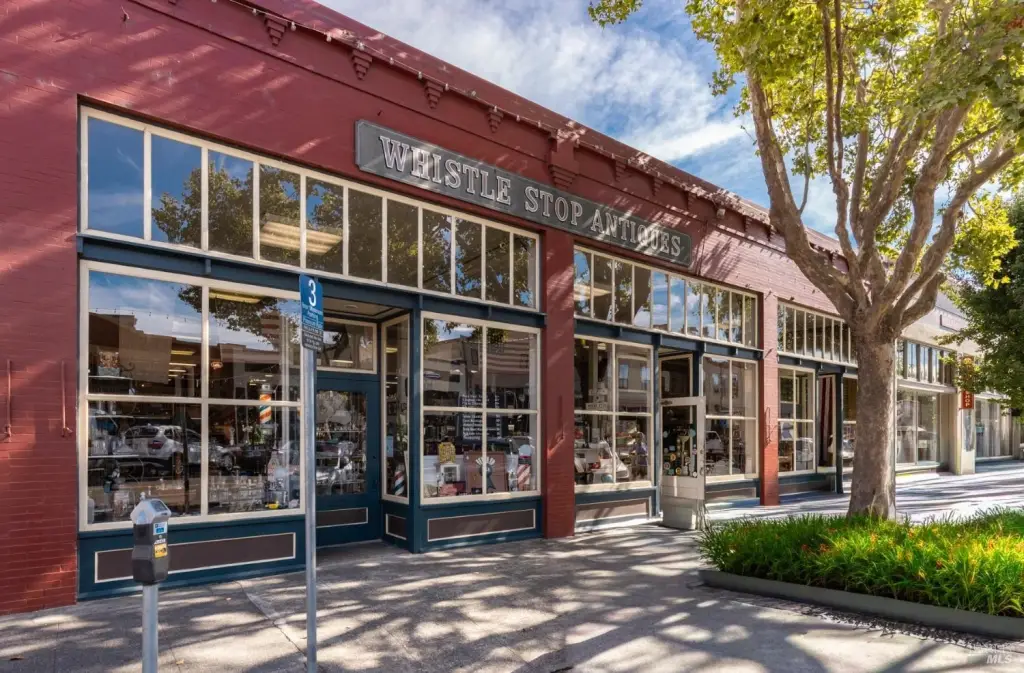
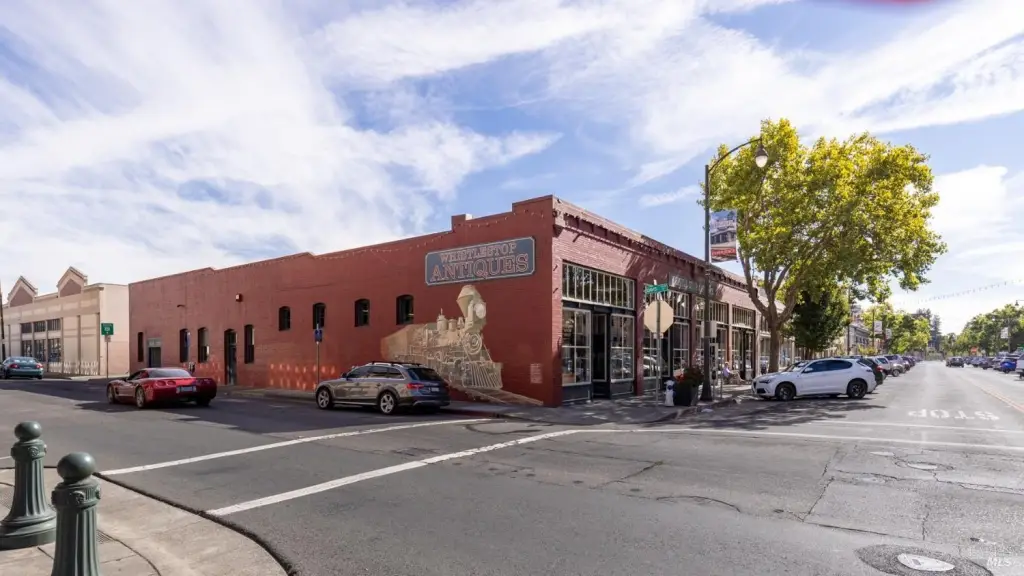
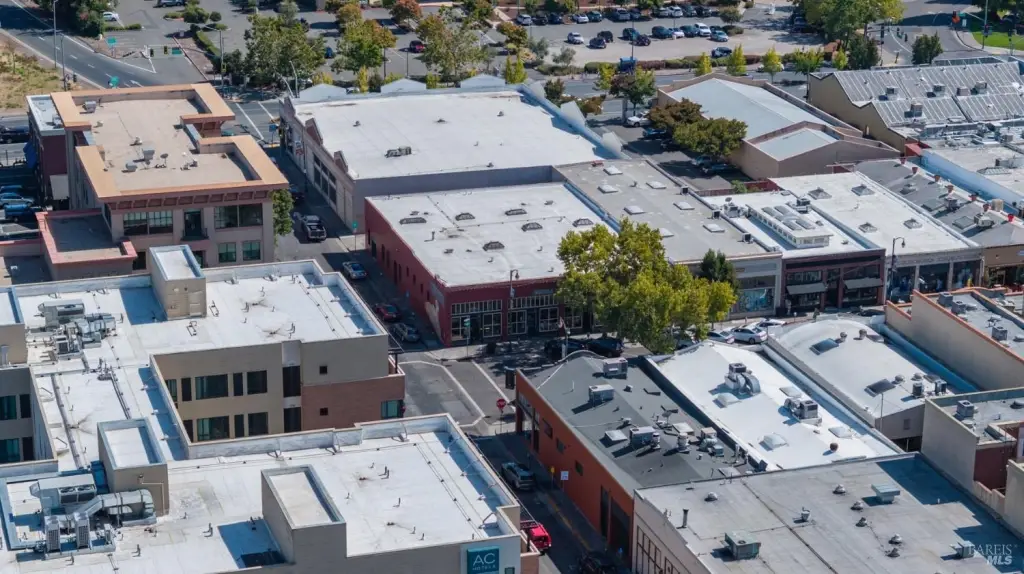
Built in 1912, this brick storefront property occupies a 0.25-acre corner parcel in Santa Rosa’s Historic Railroad Square District. The building includes ground-floor retail space and a mezzanine, with concrete and carpet flooring, a tall glass frontage, and exposed brick on the interior and exterior. The property presents 82 feet along 4th Street and benefits from its corner placement at two downtown streets.
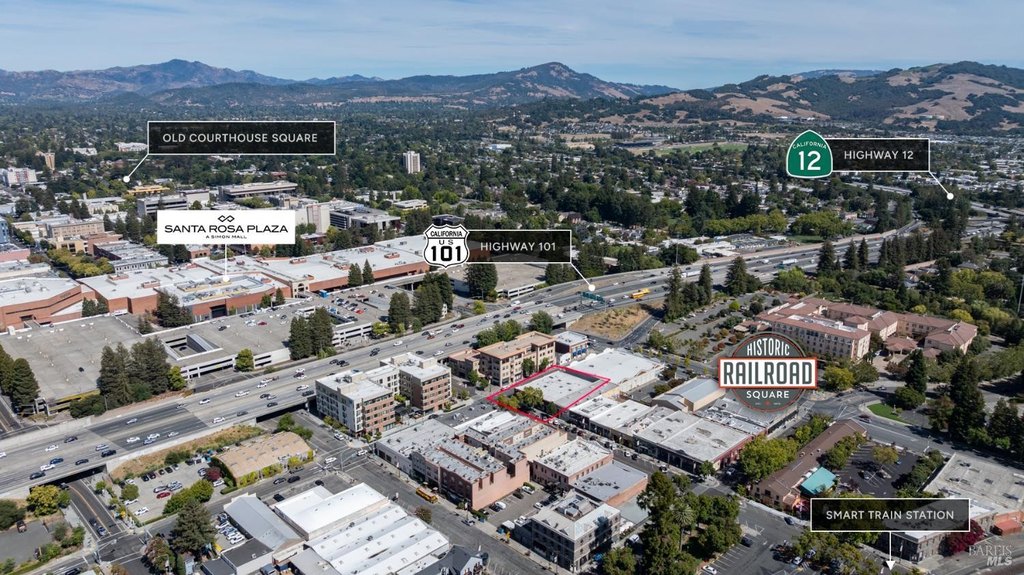
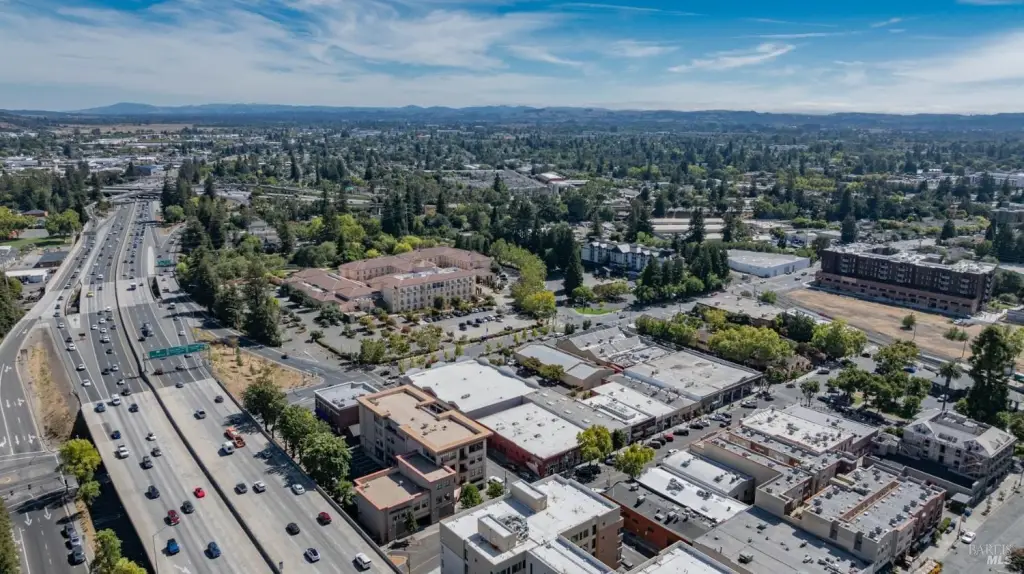
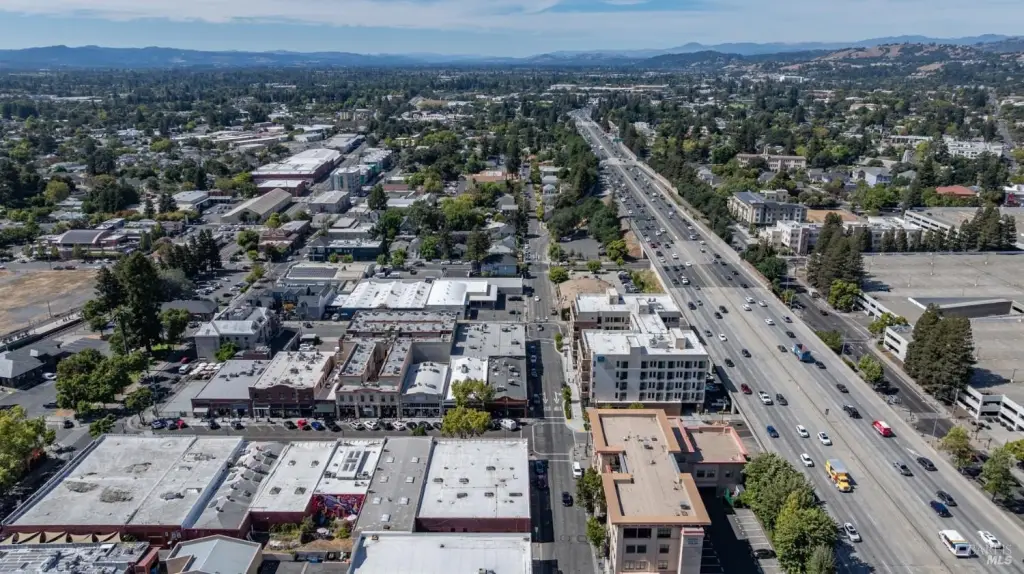
The site is one block from SMART Train’s Railroad Square Station and one block from Highway 101 access. It is also positioned within the district’s dining, shopping, and event activity. On-street parking serves the property, which is fully leased to Whistlestop Antiques.
The site is one block from SMART Train’s Railroad Square Station and one block from Highway 101 access. It is also positioned within the district’s dining, shopping, and event activity. On-street parking serves the property, which is fully leased to Whistlestop Antiques.
Key Highlights
- 82 feet of frontage along 4th Street
- 0.25‑acre corner parcel in Santa Rosa’s Historic Railroad Square District
- Built in 1912 with brick construction and exposed interior and exterior brick
Financial Insights
Estimated NOI and Cap Rate
NOI / Yr
$117,615
Cap Rate
6.36%
Suggested Prices Based on Cap Rates
Cap Rate 5%
$2,352,300
$2.4M
Cap Rate 7%
$1,680,214
$1.7M
Cap Rate 9%
$1,306,833
$1.3M
Market Conditions
NOI Build-Up for 10,800 SF
Gross rent
$184.0K $17.04/SF
− Vacancy
−$16.0K −$1.48/SF
EGI
$168.0K $15.56/SF
− OpEx
−$50.4K −$4.67/SF
NOI
$117.6K $10.89/SF
Area
Santa Rosa, CA
Vacancy
8.70%
Lease Rate
$17.04 /SF/Yr
Expense Ratio
30.00%
Simulate Cap Rate and NOI
Suggested Prices Based on Cap Rates
Cap Rate 5%
$2,352,300
Cap Rate 7%
$1,680,214
Cap Rate 9%
$1,306,833
Alternative Uses
Best Use
Retail
$1.68M
$1.47M – $1.96M
NOI $117,615 @ 7.0% cap · market cap 6.36%
Second Best
—
—
no second resolved use
Theoretical Best
Multifamily LT 5
$3.00M
$2.63M – $3.50M
NOI $210,039 @ 7.0% cap · market cap 11.35%
Zoning and permitted uses should be independently verified with authorities.
How Realmo checks its estimates
Property Analytics
Unlock full access to Insights
Subscribe to Realmo Intelligence
Open Analytics
Current Use
Lease Details
100%
Occupancy
Single-tenant
Tenancy
Yes
Highway access
Yes
Paved road access
Location Intelligence
Trade Area within ½ mile
3,555
Businesses Nearby
119k
Monthly Visits Nearby
Balanced
Demand for This Use
Explore this area
Business Placement
Foot Traffic Nearby
Apparel 46%
Dining 40%
Shops & Services 11%
Hotels & Casinos 2%
Macy's
Apparel
54,337 visits/mo
0.3 miles
Chevys Fresh Mex
Dining
21,353 visits/mo
0.0 miles
Roasters
Dining
12,760 visits/mo
0.1 miles
Shell
Shops & Services
9,897 visits/mo
0.4 miles
Starbucks
Dining
5,382 visits/mo
0.5 miles
Demographics for 95401, CA
37,272
Population
14,281
Households
2.6
Avg Household Size
38
Median Age
28%
College-Educated
80%
High-School Grad
20.9 sq mi
ZIP Area
1,783
Density / Sq Mi
$93,513
Median Household Income
$45,630
Median Earnings
$1,978
Median Rent
$628,900
Median Home Value
Check the figures for this property
Cap Rate, Value Estimation, Potential NOI and more
View Realmo Analytics
Market
Vacancy Rate% for Retail in West region

Questions? Ask Rey
Realmo’s AI knows this listing — price, zoning, demand, history. Ask anything.



Similar Off Market Nearby
- Quinceaneas Y Novias — 990 Sebastopol Rd, Santa Rosa, CA 95407
- Papillon Floral — 318 s a st, santa rosa, ca 95401
- Lofty Designs Florist | Flower Delivery Santa Rosa CA — 208 Wilson St, Santa Rosa, CA 95401
- Same Day Get Flower Delivery Santa Rosa CA — 300 mendocino ave, santa rosa, ca 95404
- Stems Floral Design — 120 D St, Santa Rosa, CA 95404
Frequently Asked Questions
What type of property is this?
Storefront property - Corner positioning provides exposure from two downtown streets and a glass-lined storefront.
Where is this storefront property located?
The property is located at 130 4th Street Santa Rosa, CA.
What is the asking price?
The asking price for this property is $1,850,000.
What are key features of this property?
This property features: 82 feet of frontage along 4th Street; 0.25‑acre corner parcel in Santa Rosa’s Historic Railroad Square District; Built in 1912 with brick construction and exposed interior and exterior brick


