Renovated Three-Unit
For Sale
$299,900
Pending
129 Farmer Street, Buffalo, NY 14207
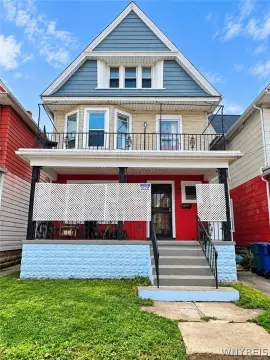
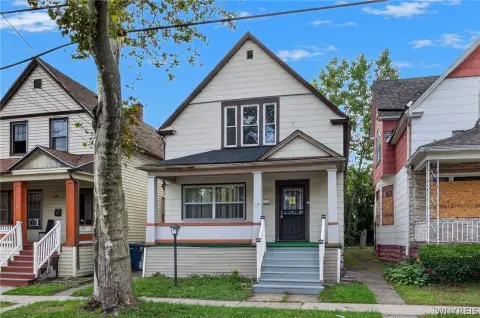
Three two-bedroom residences feature updated bathrooms, separate utilities, and a distinctive historic turret.
Property Size2,494 SF
Days on Market54
Property Features for 129 Farmer Street
General Information
Standard status
Pending
Size
2,494 SF
Property subtype
Multi Family
Units
Unit Mix
3 x 2BR
Multifamily Units
3
Taxes and HOA fees
Annual Taxes
$1,752
Building Details
Building Size
2,494 SF
Year Built
1900
Buildings
1
Stories
3
Listing Agency:
eXp Realty
Listed By:
James Wangelin · License #10301224073
(716) 903-3198
Source:
Highfallssir
Added: Aug 18
Changed: Oct 10
Last Checked: Oct 10 at 2:32AM
Displayed information is deemed reliable but is not guaranteed and should be independently verified. All listing content including descriptions, pricing, images are the copyrighted material of eXp Realty
Investment Insights
Based on property information with market context.
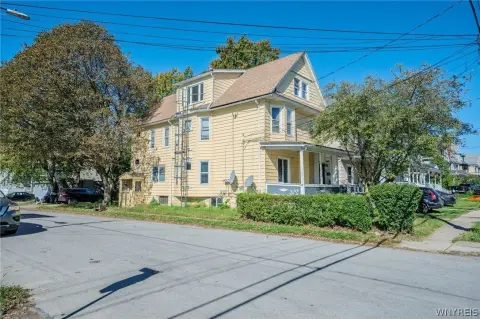
This three-unit residential property in Buffalo, New York, combines a historic exterior feature with comprehensive interior updates. Built in 1900, the building occupies a corner lot and is organized with one residence per floor. Each apartment provides a two-bedroom layout, creating consistent configuration across the property.
Renovation work includes remodeled bathrooms with custom-tiled surrounds in all three units. Separate utility service for each residence supports distinct measurement and allocation of utility usage. A prominent turret adds architectural definition to the property’s street-facing character, while the three-floor arrangement provides a clear unit-by-unit layout.
Renovation work includes remodeled bathrooms with custom-tiled surrounds in all three units. Separate utility service for each residence supports distinct measurement and allocation of utility usage. A prominent turret adds architectural definition to the property’s street-facing character, while the three-floor arrangement provides a clear unit-by-unit layout.
Key Highlights
- Three‑unit triplex with one residence on each floor
- Each unit offers a two‑bedroom layout
- All three bathrooms include custom‑tiled surrounds
Financial Insights
Estimated NOI and Cap Rate
NOI / Yr
$24,747
Cap Rate
8.25%
Suggested Prices Based on Cap Rates
Cap Rate 5%
$494,940
$494.9K
Cap Rate 7%
$353,529
$353.5K
Cap Rate 9%
$274,967
$275.0K
Market Conditions
NOI Build-Up for 2,494 SF
Gross rent
$37.4K $15.00/SF
− Vacancy
−$2.1K −$0.83/SF
EGI
$35.4K $14.17/SF
− OpEx
−$10.6K −$4.25/SF
NOI
$24.7K $9.92/SF
Area
Buffalo, NY
Vacancy
5.50%
Lease Rate
$15.00 /SF/Yr
Expense Ratio
30.00%
Simulate Cap Rate and NOI
Suggested Prices Based on Cap Rates
Cap Rate 5%
$494,940
Cap Rate 7%
$353,529
Cap Rate 9%
$274,967
Alternative Uses
Best Use
Multifamily LT 5
$353.5K
$309.3K – $412.5K
NOI $24,747 @ 7.0% cap · market cap 8.25%
Second Best
Apartment 5plus
$325.6K
$284.9K – $379.9K
NOI $22,794 @ 7.0% cap · market cap 7.60%
Theoretical Best
Office A
$599.8K
$524.8K – $699.7K
NOI $41,983 @ 7.0% cap · market cap 14.00%
Zoning and permitted uses should be independently verified with authorities.
Property Analytics
Unlock full access to Insights
Subscribe to Realmo Intelligence
Open Analytics
Current Use
Lease Details
3
Residential units
Location Intelligence
Trade Area within ½ mile
677
Businesses Nearby
Explore this area
Business Placement
Demographics for 14207, NY
26,006
Population
11,317
Households
2.3
Avg Household Size
32
Median Age
19%
College-Educated
79%
High-School Grad
3.9 sq mi
ZIP Area
6,668
Density / Sq Mi
$38,951
Median Household Income
$33,851
Median Earnings
$943
Median Rent
$111,200
Median Home Value
Check the figures for this property
Cap Rate, Value Estimation, Potential NOI and more
View Realmo Analytics
Market
Vacancy Rate% for Multifamily in Northeast region

Questions? Ask Rey
Realmo’s AI knows this listing — price, zoning, demand, history. Ask anything.





Frequently Asked Questions
What type of property is this?
Triplex - Three two-bedroom residences feature updated bathrooms, separate utilities, and a distinctive historic turret.
Where is this triplex located?
The property is located at 129 Farmer Street Buffalo, NY.
What is the asking price?
The asking price for this property is $299,900.
What are key features of this property?
This property features: Three‑unit triplex with one residence on each floor; Each unit offers a two‑bedroom layout; All three bathrooms include custom‑tiled surrounds


