Two-Family Townhouse Near Prospect
For Sale
$2,050,000
Pending
1143 Carroll St, Brooklyn, NY 11225
Historic townhouse with rentable units, backyard, and private garage.
Property Size2,656 SF
Lot Size0.06 Acres
Days on Market211
Property Features for 1143 Carroll St
General Information
Standard status
Pending
Size
2,656 SF
Lot size
0.06 Acres
Property subtype
Multi Family
Taxes and HOA fees
Annual Taxes
$8,316
Building Details
Building Size
2,656 SF
Year Built
1901
Listing Agency:
REAVIS DEVELOPMENT MARKETING LLC
Listed By:
Natanel Malkoukian
(646) 361-3276
Source:
Elliman
Added: Mar 12
Changed: Sep 30
Last Checked: Oct 7 at 1:07PM
Displayed information is deemed reliable but is not guaranteed and should be independently verified. All listing content including descriptions, pricing, images are the copyrighted material of REAVIS DEVELOPMENT MARKETING LLC
Investment Insights
Based on property information with market context.
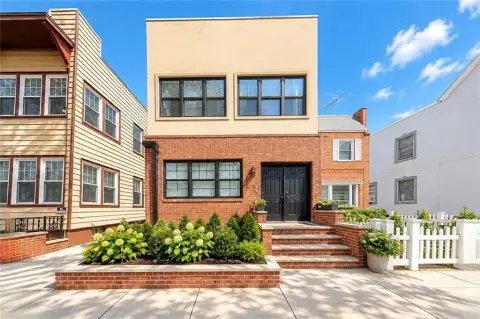
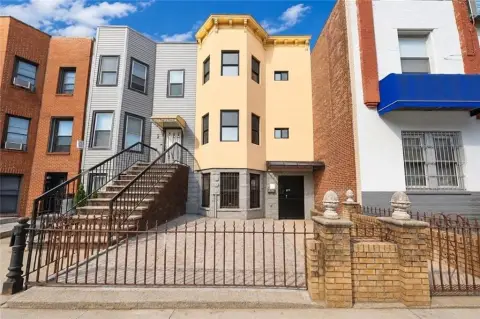
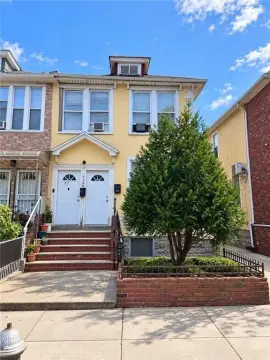
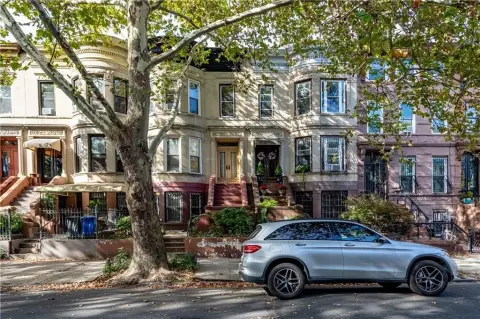
Located less than five blocks from Brooklyn Botanic Garden and Prospect Park, this historic two-family townhouse at 1143 Carroll Street features grand interiors, three rentable units, a large backyard, and a private 2-car garage. The two-story home includes 5 bedrooms and 2 bathrooms spread across two self-contained apartments. The first floor has 2 bedrooms and 1 bathroom, while the second floor has 3 bedrooms and 1 bathroom. A finished 2-bedroom, 1-bathroom basement unit with its own kitchen is also present. Period details such as bay windows, airy ceilings, tall sash windows, oversized rooms, and parquet hardwood floors with border inlays are found throughout the home. Formal living and dining areas are suitable for entertaining. The kitchens in both units feature modern updates including tiled floors, white subway tile accents, custom cabinetry, full-size Frigidaire refrigerators, and five-burner Samsung gas stoves. Bedrooms are situated on opposite sides of the units. Windowed bathrooms are adorned with classic tiles, modern fixtures, granite vanities, and marble walk-in showers with textured sliding glass doors. The backyard is suitable for outdoor activities. The property is located on a tree-lined street near restaurants, bars, cafes, and shops, as well as the Brooklyn Museum, Brooklyn Children’s Museum, and Prospect Park Zoo. Nearby subway lines include the 2/3/4/5.
Key Highlights
- Two‑family townhouse with three rentable units, perfect for income or multi‑generational living.
- Private 2‑car garage, a rare Brooklyn amenity.
- Prime location less than five blocks from Brooklyn Botanic Garden and Prospect Park, with easy access to 2/3/4/5 subway lines.
Financial Insights
Estimated NOI and Cap Rate
NOI / Yr
$93,018
Cap Rate
4.54%
Suggested Prices Based on Cap Rates
Cap Rate 5%
$1,860,360
$1.9M
Cap Rate 7%
$1,328,829
$1.3M
Cap Rate 9%
$1,033,533
$1.0M
Market Conditions
NOI Build-Up for 2,656 SF
Gross rent
$135.5K $51.00/SF
− Vacancy
−$2.6K −$0.97/SF
EGI
$132.9K $50.03/SF
− OpEx
−$39.9K −$15.01/SF
NOI
$93.0K $35.02/SF
Area
Brooklyn, NY
Vacancy
1.90%
Lease Rate
$51.00 /SF/Yr
Expense Ratio
30.00%
Simulate Cap Rate and NOI
Suggested Prices Based on Cap Rates
Cap Rate 5%
$1,860,360
Cap Rate 7%
$1,328,829
Cap Rate 9%
$1,033,533
Alternative Uses
Best Use
Multifamily LT 5
$1.33M
$1.16M – $1.55M
NOI $93,018 @ 7.0% cap · market cap 4.54%
Second Best
Apartment 5plus
$1.16M
$1.01M – $1.35M
NOI $81,085 @ 7.0% cap · market cap 3.96%
Theoretical Best
Specialty Retail
$2.20M
$1.92M – $2.57M
NOI $153,942 @ 7.0% cap · market cap 7.51%
Zoning and permitted uses should be independently verified with authorities.
Property Analytics
Unlock full access to Insights
Subscribe to Realmo Intelligence
Open Analytics
Current Use
Location Intelligence
Trade Area within ½ mile
5,335
Businesses Nearby
Explore this area
Business Placement
Demographics for 11225, NY
58,786
Population
26,703
Households
2.2
Avg Household Size
36
Median Age
48%
College-Educated
89%
High-School Grad
0.9 sq mi
ZIP Area
65,318
Density / Sq Mi
$85,201
Median Household Income
$54,639
Median Earnings
$1,733
Median Rent
$1,218,300
Median Home Value
Check the figures for this property
Cap Rate, Value Estimation, Potential NOI and more
View Realmo Analytics
Market
Vacancy Rate% for Multifamily in Northeast region

Questions? Ask Rey
Realmo’s AI knows this listing — price, zoning, demand, history. Ask anything.
Frequently Asked Questions
What type of property is this?
Duplex - Historic townhouse with rentable units, backyard, and private garage.
Where is this duplex located?
The property is located at 1143 Carroll St Brooklyn, NY.
What is the asking price?
The asking price for this property is $2,050,000.
What are key features of this property?
This property features: Two‑family townhouse with three rentable units, perfect for income or multi‑generational living.; Private 2‑car garage, a rare Brooklyn amenity.; Prime location less than five blocks from Brooklyn Botanic Garden and Prospect Park, with easy access to 2/3/4/5 subway lines.


