Cozy Carnegie Hill
For Sale
$325,000
Pending
105 E 97th St 9, New York, NY 10029
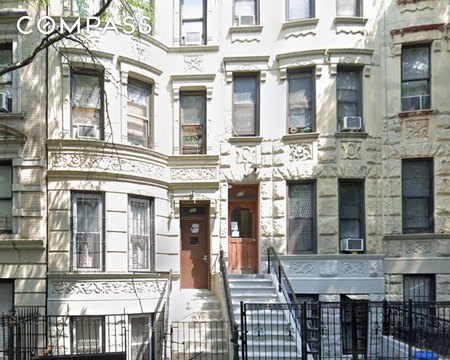
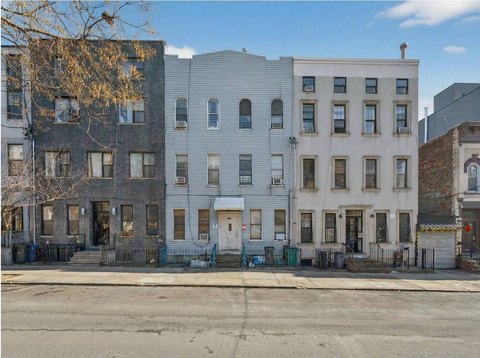
Affordable 2-bedroom apartment in a prime Carnegie Hill location.
Property Size450 SF
Days on Market315
Property Features for 105 E 97th St 9
General Information
Standard status
Pending
Size
450 SF
Property subtype
Residential
Building Details
Building Size
450 SF
Year Built
1910
Listed By:
JAY M PEGRAM
(917) 755-1414
Source:
Elliman
Added: Nov 28, 2025
Changed: Oct 6
Last Checked: Oct 7 at 1:20PM
Displayed information is deemed reliable but is not guaranteed and should be independently verified. All listing content including descriptions, pricing, images are the copyrighted material of JAY M PEGRAM
Investment Insights
Based on property information with market context.
This cozy 2-bedroom apartment, approximately 450 square feet, is suitable as a starter home or for downsizing. Located in the Carnegie Hill neighborhood, the apartment features prewar charm and character, hardwood floors, and an open kitchen. Situated on the 3rd floor of a walk-up building, the unit faces the back. The building is a self-managed, financially solid 165% AMI HDFC Coop. It is located at 105 E 97th St. The apartment provides easy access to Central Park, Museum Mile, and Mount Sinai Hospital. Transportation options include the subway 6 train at 96th and Lexington, the 96th Street crosstown bus, and the Second Avenue Subway. The monthly maintenance fee is $460. The apartment must be used as a primary residence. The 2023 Maximum NYC AMI based on the household size is as follows: Household of 1 $163,185, Household of 2 $182,450, Household of 3 $209,715, Household of 4 $232,980.
Key Highlights
- Low $460 maintenance fees.
- Prime Carnegie Hill location near Central Park, Museum Mile, and transportation.
- Financially solid HDFC Coop.
Financial Insights
Estimated NOI and Cap Rate
NOI / Yr
$17,161
Cap Rate
5.28%
Suggested Prices Based on Cap Rates
Cap Rate 5%
$343,220
$343.2K
Cap Rate 7%
$245,157
$245.2K
Cap Rate 9%
$190,678
$190.7K
Market Conditions
NOI Build-Up for 450 SF
Gross rent
$32.4K $72.00/SF
− Vacancy
−$1.2K −$2.66/SF
EGI
$31.2K $69.34/SF
− OpEx
−$14.0K −$31.20/SF
NOI
$17.2K $38.13/SF
Area
ZIP 10029
Vacancy
3.70%
Lease Rate
$72.00 /SF/Yr
Expense Ratio
45.00%
Simulate Cap Rate and NOI
Suggested Prices Based on Cap Rates
Cap Rate 5%
$343,220
Cap Rate 7%
$245,157
Cap Rate 9%
$190,678
Alternative Uses
Best Use
Apartment 5plus
$245.2K
$214.5K – $286.0K
NOI $17,161 @ 7.0% cap · market cap 5.28%
Second Best
—
—
no second resolved use
Theoretical Best
Specialty Retail
$1.61M
$1.40M – $1.87M
NOI $112,388 @ 7.0% cap · market cap 34.58%
Zoning and permitted uses should be independently verified with authorities.
Property Analytics
Unlock full access to Insights
Subscribe to Realmo Intelligence
Open Analytics
Current Use
Location Intelligence
Trade Area within ½ mile
13,944
Businesses Nearby
Explore this area
Business Placement
Demographics for 10029, NY
78,141
Population
36,955
Households
2.1
Avg Household Size
36
Median Age
36%
College-Educated
78%
High-School Grad
1.2 sq mi
ZIP Area
65,118
Density / Sq Mi
$38,308
Median Household Income
$41,951
Median Earnings
$1,183
Median Rent
$818,100
Median Home Value
Check the figures for this property
Cap Rate, Value Estimation, Potential NOI and more
View Realmo Analytics
Market
Vacancy Rate% for Multifamily in Northeast region

Questions? Ask Rey
Realmo’s AI knows this listing — price, zoning, demand, history. Ask anything.


Frequently Asked Questions
What type of property is this?
Apartment building - Affordable 2-bedroom apartment in a prime Carnegie Hill location.
Where is this apartment building located?
The property is located at 105 E 97th St 9 New York, NY.
What is the asking price?
The asking price for this property is $325,000.
What are key features of this property?
This property features: Low $460 maintenance fees.; Prime Carnegie Hill location near Central Park, Museum Mile, and transportation.; Financially solid HDFC Coop.