Highly Visible Flex/Office
For Sale
Contact for pricing
12021 Sheraton Lane, Cincinnati, OH 45426
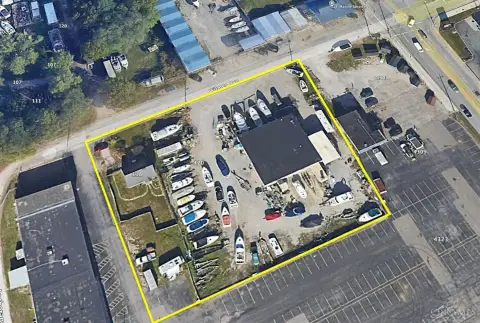
Shell-condition flex space with a paved, gated rear lot for service-oriented operations and convenient signalized access.
Property Size5,620 SF
Price / SF$123.67
Days on Market116
Property Features for 12021 Sheraton Lane
General Information
Standard status
Active
Size
5,620 SF
Property subtype
Industrial, Mixed Use, Office
Zoning
General Buisness PUD
Investment Type
Owner/User
Site & Location
Traffic Count
41,000 vehicles/day
Highway Access
Yes
Road Access
Yes
Fenced Yard
Yes
Building Details
Year Built
1983
Listing Agency:
Colliers - Cincinnati, Ohio
Listed By:
Jeffrey Kroeger · License #OH SAL.2019003480
(513) 562-2215
Source:
Crexi
Added: Jun 12
Changed: Sep 30
Last Checked: Oct 4 at 10:34AM
Displayed information is deemed reliable but is not guaranteed and should be independently verified. All listing content including descriptions, pricing, images are the copyrighted material of Colliers - Cincinnati, Ohio
Investment Insights
Based on property information with market context.
This highly visible flex/office building is offered in shell condition, providing an adaptable interior for a range of commercial uses. The site includes a flat, paved, gated lot at the rear, well suited for contractor or service industry activity that benefits from secure outdoor storage. The overall property configuration supports both interior buildout and practical day-to-day operations tied to vehicles and equipment.
The property is located along SR4/Springfield Pike and is described as seeing over 41,000 cars per day. Access is signalized onto the main thoroughfare, supporting visibility and customer or delivery traffic. The location is also noted as just north of I-275 in Cincinnati, Ohio.
For tenants, buyers, or operators seeking flexible zoning and a workable site for service-related use, this property offers a straightforward foundation with a build-to-suit interior and a gated paved yard. The combination of a shell-condition building and secure rear lot can help streamline planning for organizations that need both office or light commercial space and functional outdoor storage.
The property is located along SR4/Springfield Pike and is described as seeing over 41,000 cars per day. Access is signalized onto the main thoroughfare, supporting visibility and customer or delivery traffic. The location is also noted as just north of I-275 in Cincinnati, Ohio.
For tenants, buyers, or operators seeking flexible zoning and a workable site for service-related use, this property offers a straightforward foundation with a build-to-suit interior and a gated paved yard. The combination of a shell-condition building and secure rear lot can help streamline planning for organizations that need both office or light commercial space and functional outdoor storage.
Key Highlights
- Highly visible flex building built in 1983 in Cincinnati, OH
- Shell‑condition interior, suited for flexible tenant build‑outs
- Flat, paved, gated rear lot for contractor or service‑industry use
Financial Insights
Estimated NOI and Cap Rate
NOI / Yr
$48,921
Cap Rate
7.04%
Suggested Prices Based on Cap Rates
Cap Rate 5%
$978,420
$978.4K
Cap Rate 7%
$698,871
$698.9K
Cap Rate 9%
$543,567
$543.6K
Market Conditions
NOI Build-Up for 5,620 SF
Gross rent
$80.9K $14.40/SF
− Vacancy
−$5.7K −$1.01/SF
EGI
$75.3K $13.39/SF
− OpEx
−$26.3K −$4.69/SF
NOI
$48.9K $8.70/SF
Area
Cincinnati, OH
Vacancy
7.00%
Lease Rate
$14.40 /SF/Yr
Expense Ratio
35.00%
Simulate Cap Rate and NOI
Suggested Prices Based on Cap Rates
Cap Rate 5%
$978,420
Cap Rate 7%
$698,871
Cap Rate 9%
$543,567
Alternative Uses
Best Use
Office B
$958.2K
$838.4K – $1.12M
NOI $67,075 @ 7.0% cap · market cap 9.65%
Second Best
Flex RnD
$698.9K
$611.5K – $815.4K
NOI $48,921 @ 7.0% cap · market cap 7.04%
Theoretical Best
Office A
$1.12M
$977.5K – $1.30M
NOI $78,202 @ 7.0% cap · market cap 11.25%
Zoning and permitted uses should be independently verified with authorities.
Property Analytics
Unlock full access to Insights
Subscribe to Realmo Intelligence
Open Analytics
Current Use
Lease Details
41,000 VPD
Traffic count
Yes
Fenced yard
Yes
Highway access
Yes
Paved road access
Location Intelligence
Trade Area within ½ mile
443
Businesses Nearby
Under-served
Demand for This Use
Explore this area
Business Placement
Demographics for 45426, OH
14,391
Population
7,476
Households
1.9
Avg Household Size
43
Median Age
21%
College-Educated
94%
High-School Grad
19.9 sq mi
ZIP Area
723
Density / Sq Mi
$51,538
Median Household Income
$37,249
Median Earnings
$927
Median Rent
$111,900
Median Home Value
Check the figures for this property
Cap Rate, Value Estimation, Potential NOI and more
View Realmo Analytics
Market
Vacancy Rate% for Office in Cincinnati, OH

Questions? Ask Rey
Realmo’s AI knows this listing — price, zoning, demand, history. Ask anything.




Frequently Asked Questions
What type of property is this?
Flex space - Shell-condition flex space with a paved, gated rear lot for service-oriented operations and convenient signalized access.
Where is this flex space located?
The property is located at 12021 Sheraton Lane Cincinnati, OH.
What is the asking price?
The asking price for this property is $695,000.
What are key features of this property?
This property features: Highly visible flex building built in 1983 in Cincinnati, OH; Shell‑condition interior, suited for flexible tenant build‑outs; Flat, paved, gated rear lot for contractor or service‑industry use



