Miami Mixed-Use Investment
For Sale
Contact for pricing
1186 NW 103rd Street, Miami, FL 33150
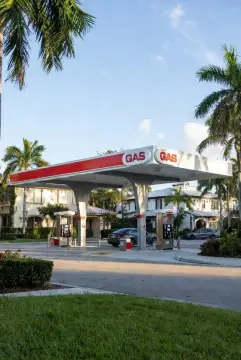
High-traffic mixed-use property with income potential in Miami.
Property Size6,609 SF
Price / SF$302.62
Days on Market492
Property Features for 1186 NW 103rd Street
General Information
Standard status
Active
Size
6,609 SF
Property subtype
Mixed Use, Retail
Zoning
BU-1
Building Details
Year Built
1986
Listing Agency:
Trustpoint realty
Listed By:
Nicholas Arias · License #3605601
(305) 200-0348
Source:
Crexi
Added: Jun 5, 2025
Changed: Aug 8
Last Checked: Aug 8 at 6:39AM
Displayed information is deemed reliable but is not guaranteed and should be independently verified. All listing content including descriptions, pricing, images are the copyrighted material of Trustpoint realty
Investment Insights
Based on property information with market context.
Located in Miami at the intersection of 103rd Street and 12th Avenue, this mixed-use property benefits from a high-traffic location with 30,500 vehicles passing by daily. The property is situated in a rapidly evolving neighborhood and is surrounded by major franchises and businesses, offering visibility and accessibility. The property is zoned BU-1, allowing for a variety of commercial and residential uses. Currently, the property is leased to a restaurant, a marketplace, and two residential units above, which are Section 8 approved. The property has been upgraded with modern finishes, fresh asphalt, a newly painted exterior, and upgraded lighting. With some leases nearing expiration, there is an opportunity for an owner-user to establish their business or for an investor to increase rents. The property size is 6609 square feet.
Key Highlights
- High‑traffic location in Miami with 30,500 vehicles passing by daily, offering unparalleled visibility and accessibility.
- BU‑1 zoning allows for a variety of commercial and residential uses, providing flexibility for owner‑users and investors.
- Currently leased to a restaurant, marketplace, and two Section 8 approved residential units, ensuring stable rental income.
Financial Insights
Estimated NOI and Cap Rate
NOI / Yr
$156,138
Cap Rate
7.81%
Suggested Prices Based on Cap Rates
Cap Rate 5%
$3,122,760
$3.1M
Cap Rate 7%
$2,230,543
$2.2M
Cap Rate 9%
$1,734,867
$1.7M
Market Conditions
NOI Build-Up for 6,609 SF
Gross rent
$277.6K $42.00/SF
− Vacancy
−$27.8K −$4.20/SF
EGI
$249.8K $37.80/SF
− OpEx
−$93.7K −$14.18/SF
NOI
$156.1K $23.63/SF
Area
Miami, FL
Vacancy
10.00%
Lease Rate
$42.00 /SF/Yr
Expense Ratio
37.50%
Simulate Cap Rate and NOI
Suggested Prices Based on Cap Rates
Cap Rate 5%
$3,122,760
Cap Rate 7%
$2,230,543
Cap Rate 9%
$1,734,867
Alternative Uses
Best Use
Retail
$3.08M
$2.70M – $3.59M
NOI $215,623 @ 7.0% cap · market cap 10.78%
Second Best
Mixed Use
$2.23M
$1.95M – $2.60M
NOI $156,138 @ 7.0% cap · market cap 7.81%
Theoretical Best
Specialty Retail
$4.46M
$3.90M – $5.20M
NOI $312,278 @ 7.0% cap · market cap 15.61%
Zoning and permitted uses should be independently verified with authorities.
Property Analytics
Unlock full access to Insights
Subscribe to Realmo Intelligence
Open Analytics
Current Use
Location Intelligence
Trade Area within ½ mile
829
Businesses Nearby
Explore this area
Business Placement
Demographics for 33150, FL
28,703
Population
12,403
Households
2.3
Avg Household Size
37
Median Age
14%
College-Educated
75%
High-School Grad
3.5 sq mi
ZIP Area
8,201
Density / Sq Mi
$40,802
Median Household Income
$32,359
Median Earnings
$1,179
Median Rent
$377,700
Median Home Value
Check the figures for this property
Cap Rate, Value Estimation, Potential NOI and more
View Realmo Analytics
Market
Vacancy Rate% for Retail in Miami, FL

Questions? Ask Rey
Realmo’s AI knows this listing — price, zoning, demand, history. Ask anything.



Frequently Asked Questions
What type of property is this?
Mixed-use property - High-traffic mixed-use property with income potential in Miami.
Where is this mixed-use property located?
The property is located at 1186 NW 103rd Street Miami, FL.
What is the asking price?
The asking price for this property is $2,000,000.
What are key features of this property?
This property features: High‑traffic location in Miami with **30,500 vehicles passing by daily**, offering unparalleled visibility and accessibility.; BU‑1 zoning allows for a variety of commercial and residential uses, providing flexibility for owner‑users and investors.; Currently leased to a restaurant, marketplace, and two Section 8 approved residential units, ensuring stable rental income.



