Eagle Ranch Prime Location
For Sale
$2,295,000
1160 Capitol Street, Eagle, CO 81631
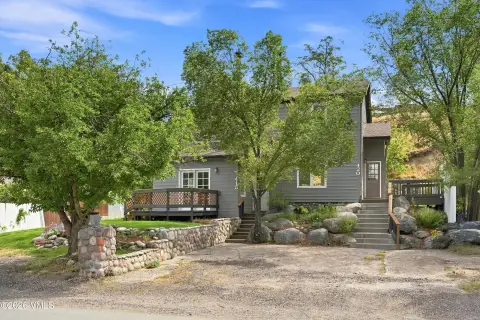
Prime Eagle Ranch building with retail and office space.
Property Size6,124 SF
Lot Size0.13 Acres
Price / SF$374.76
Days on Market362
Property Features for 1160 Capitol Street
General Information
Standard status
Active
Size
6,124 SF
Lot size
0.13 Acres
Property subtype
Commercial
Taxes and HOA fees
Annual Taxes
$35,463
Amenities
Forced Air Heating
Natural Gas Heating
Parking Lot
Building Details
Year Built
2005
Listing Agency:
MOUNTAIN LIFESTYLE PROPERTIES
(970) 445-1766
Listed By:
DAVID NUDELL · License #REC 2023 0616
(505) 204-6716
Source:
Corcoran
Added: Oct 11, 2025
Changed: Aug 9
Last Checked: May 10 at 9:51PM
Displayed information is deemed reliable but is not guaranteed and should be independently verified. All listing content including descriptions, pricing, images are the copyrighted material of MOUNTAIN LIFESTYLE PROPERTIES
Investment Insights
Based on property information with market context.
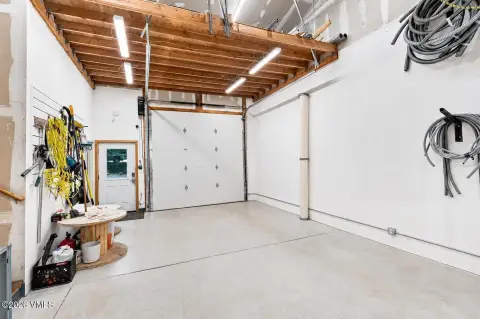
This building presents an opportunity to own property in a highly visible location in Eagle Ranch. Situated next to the movie theater and near three restaurants, the building is in excellent condition. The retail space features high ceilings and walls of glass that provide natural sunlight. A patio outside the south doors can be incorporated into a retail or restaurant concept. The property includes three offices upstairs that are currently leased and could be converted to residential units. There are two common bathrooms upstairs and two ADA-accessible bathrooms downstairs. The building has ample parking available in front and behind. The property size is 6124 square feet.
Key Highlights
- Prime, highly visible location in Eagle Ranch next to the movie theater and restaurants.
- Retail space with high ceilings, walls of glass, and ample natural sunlight.
- Ample parking in front and behind the building.
Financial Insights
Estimated NOI and Cap Rate
NOI / Yr
$85,981
Cap Rate
3.75%
Suggested Prices Based on Cap Rates
Cap Rate 5%
$1,719,620
$1.7M
Cap Rate 7%
$1,228,300
$1.2M
Cap Rate 9%
$955,344
$955.3K
Market Conditions
NOI Build-Up for 6,124 SF
Gross rent
$147.0K $24.00/SF
− Vacancy
−$32.3K −$5.28/SF
EGI
$114.6K $18.72/SF
− OpEx
−$28.7K −$4.68/SF
NOI
$86.0K $14.04/SF
Area
Eagle County, CO
Vacancy
22.00%
Lease Rate
$24.00 /SF/Yr
Expense Ratio
25.00%
Simulate Cap Rate and NOI
Suggested Prices Based on Cap Rates
Cap Rate 5%
$1,719,620
Cap Rate 7%
$1,228,300
Cap Rate 9%
$955,344
Alternative Uses
Best Use
Office B
$1.23M
$1.07M – $1.43M
NOI $85,981 @ 7.0% cap · market cap 3.75%
Second Best
Retail
$1.23M
$1.07M – $1.43M
NOI $85,829 @ 7.0% cap · market cap 3.74%
Theoretical Best
Office A
$1.68M
$1.47M – $1.96M
NOI $117,581 @ 7.0% cap · market cap 5.12%
Zoning and permitted uses should be independently verified with authorities.
Property Analytics
Unlock full access to Insights
Subscribe to Realmo Intelligence
Open Analytics
Current Use
Location Intelligence
Trade Area within ½ mile
268
Businesses Nearby
Explore this area
Business Placement
Demographics for 81631, CO
9,017
Population
3,137
Households
2.9
Avg Household Size
39
Median Age
52%
College-Educated
93%
High-School Grad
220.4 sq mi
ZIP Area
41
Density / Sq Mi
$104,430
Median Household Income
$54,994
Median Earnings
$1,685
Median Rent
$717,600
Median Home Value
Check the figures for this property
Cap Rate, Value Estimation, Potential NOI and more
View Realmo Analytics
Market
Vacancy Rate% for Office in West region

Questions? Ask Rey
Realmo’s AI knows this listing — price, zoning, demand, history. Ask anything.




Frequently Asked Questions
What type of property is this?
Storefront property - Prime Eagle Ranch building with retail and office space.
Where is this storefront property located?
The property is located at 1160 Capitol Street Eagle, CO.
What is the asking price?
The asking price for this property is $2,295,000.
What are key features of this property?
This property features: Prime, highly visible location in Eagle Ranch next to the movie theater and restaurants.; Retail space with **high ceilings, walls of glass, and ample natural sunlight.**; Ample parking in front and behind the building.



