Brick-and-Frame
For Sale
$315,000
Pending
116 NW 31st Street, Oklahoma City, OK 73118
Residential Income, Oklahoma City, OK
Property Size1,968 SF
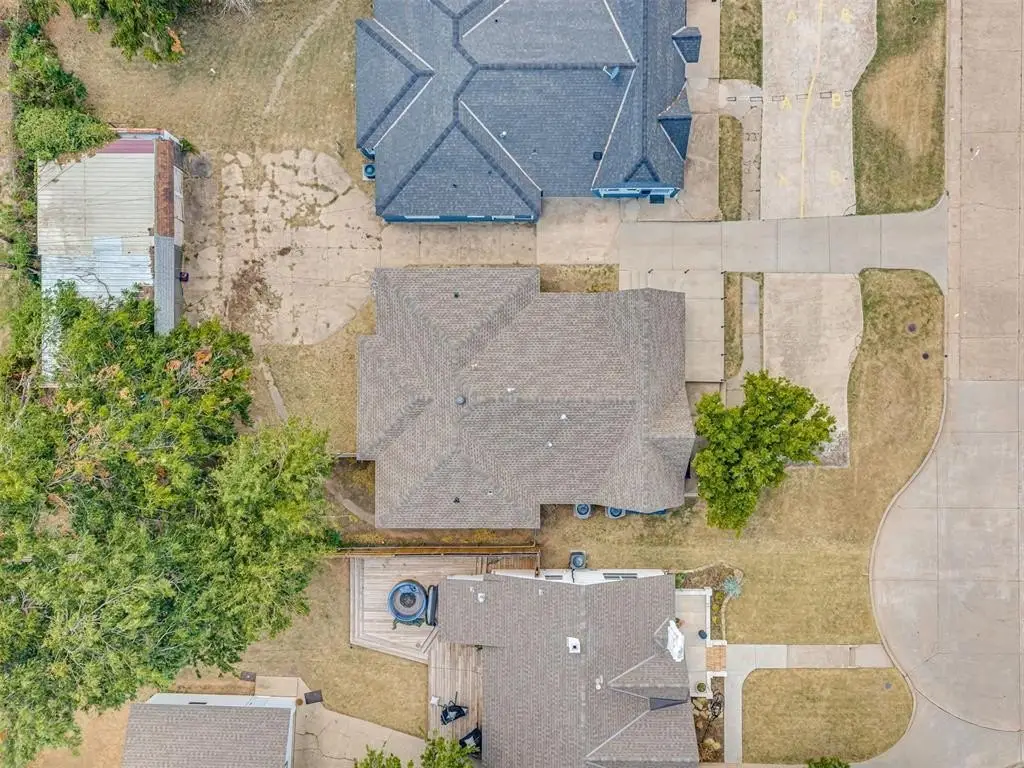
Lot Size0.16 Acres
Days on Market61
Property Features for 116 NW 31st Street
General Information
Property type
Residential Multi Family
Property subtype
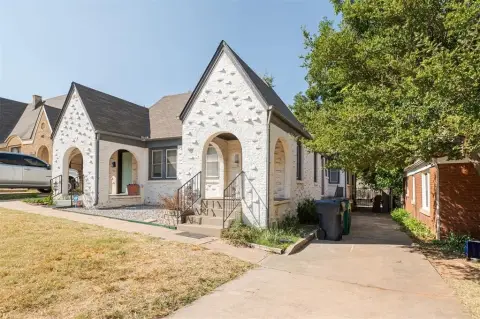
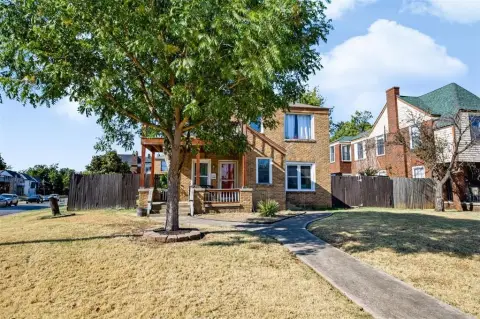
Duplex
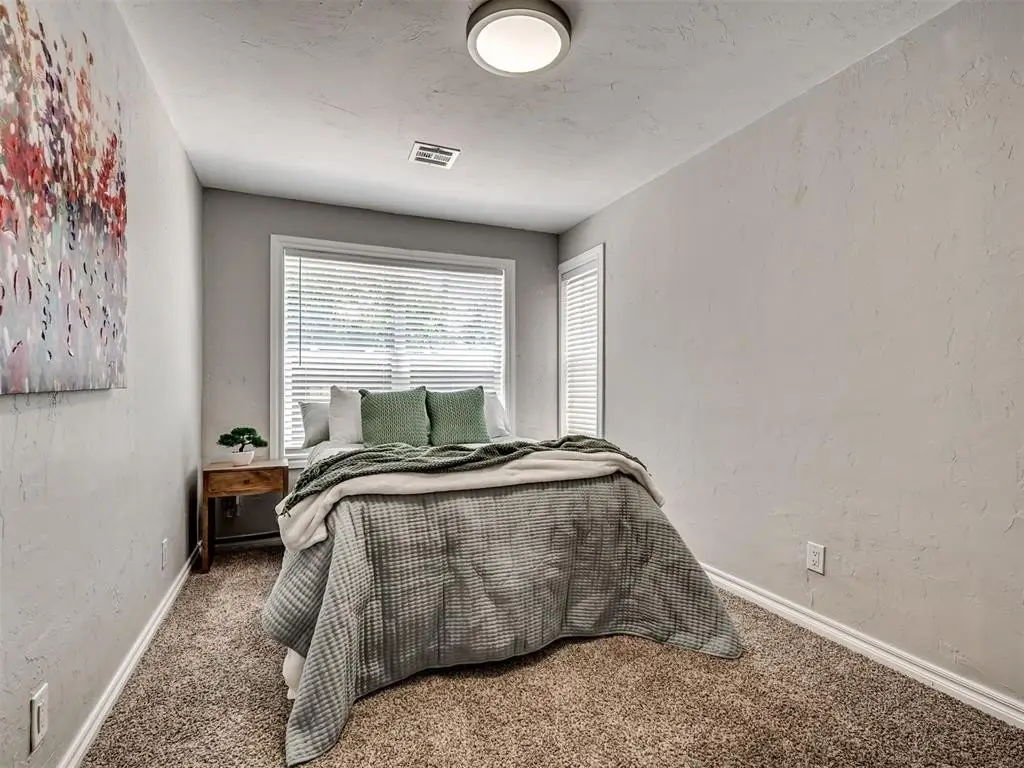
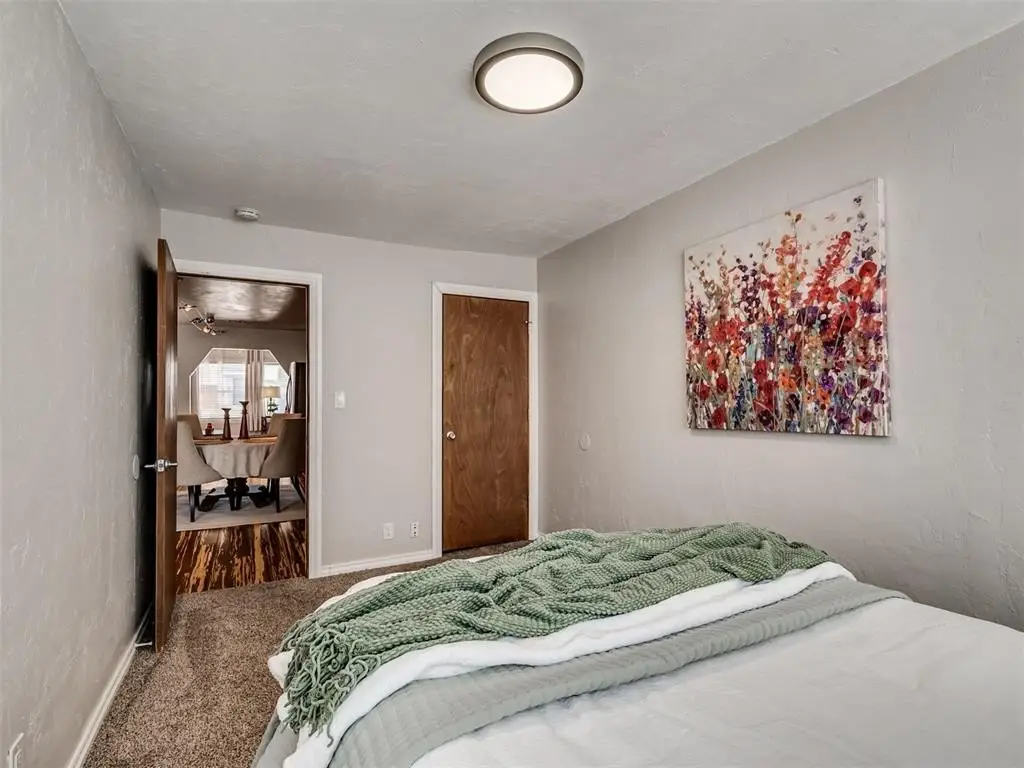
Bedrooms
4
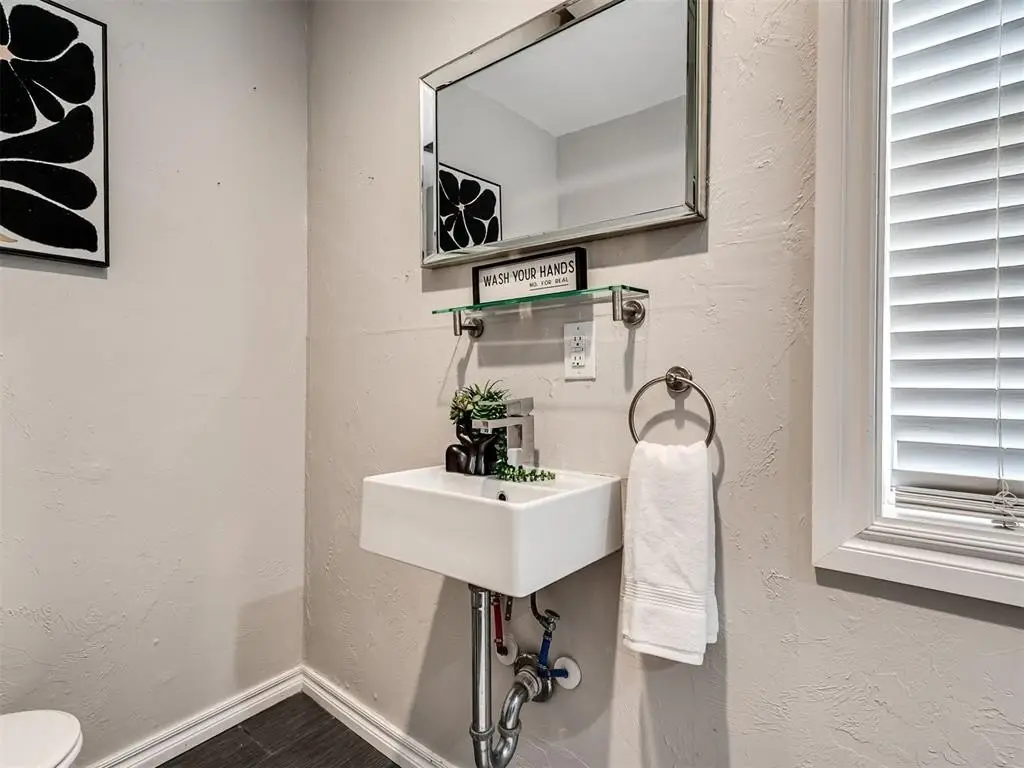
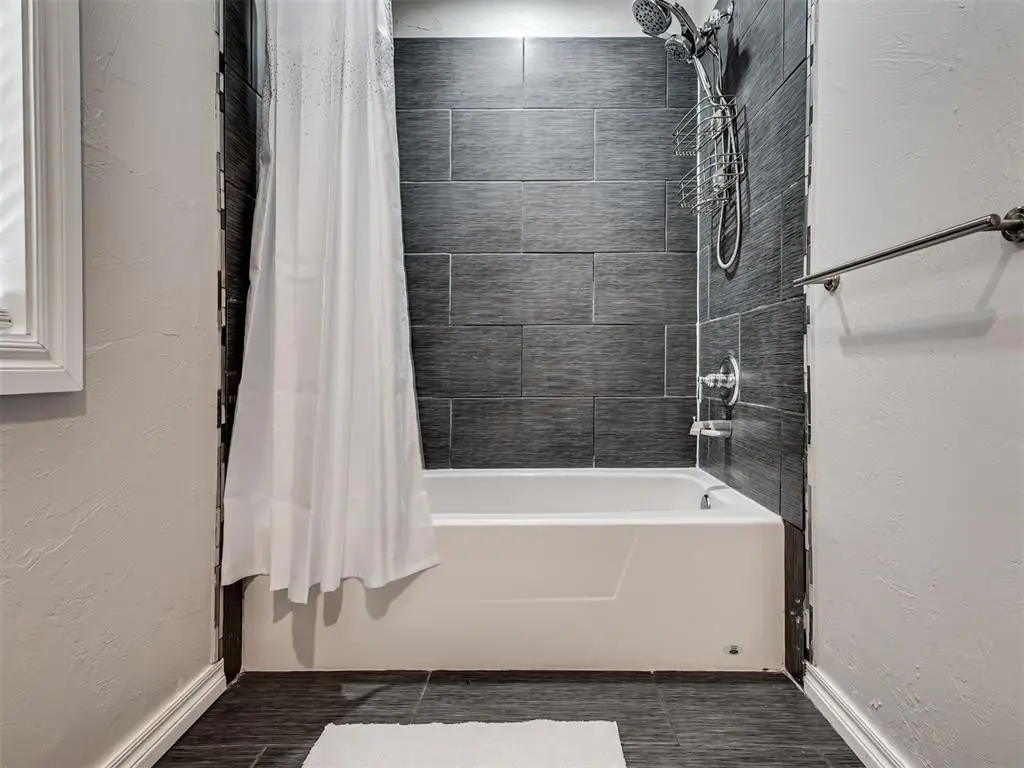
Bathrooms
2
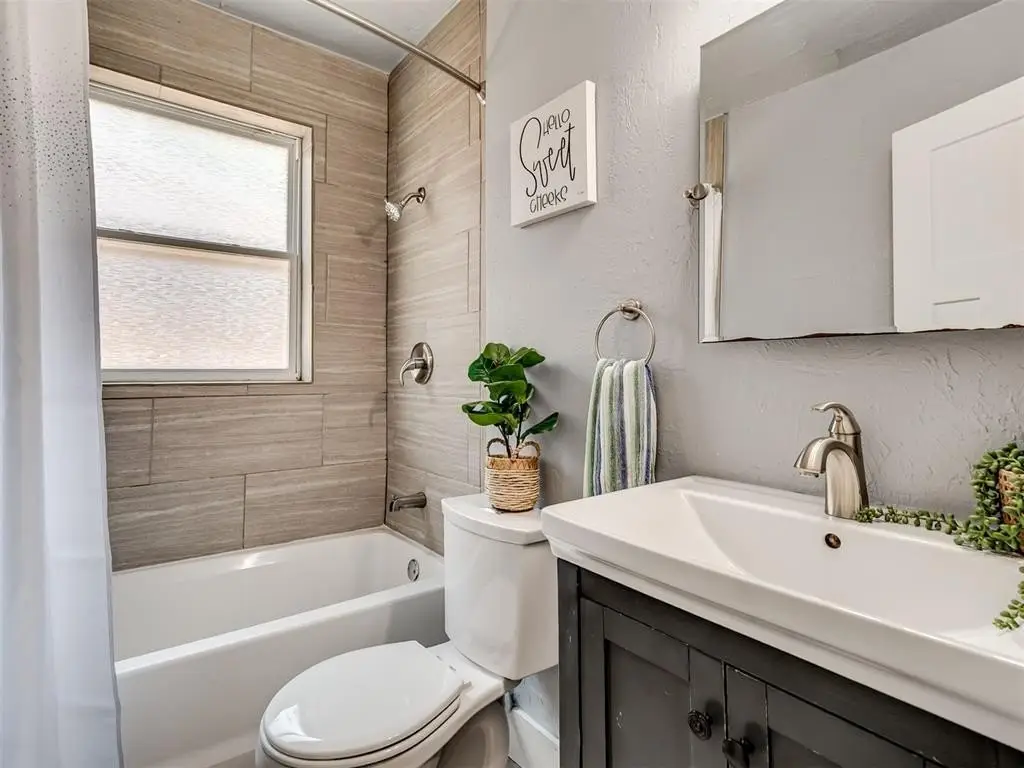
Full bathrooms
2
Rooms
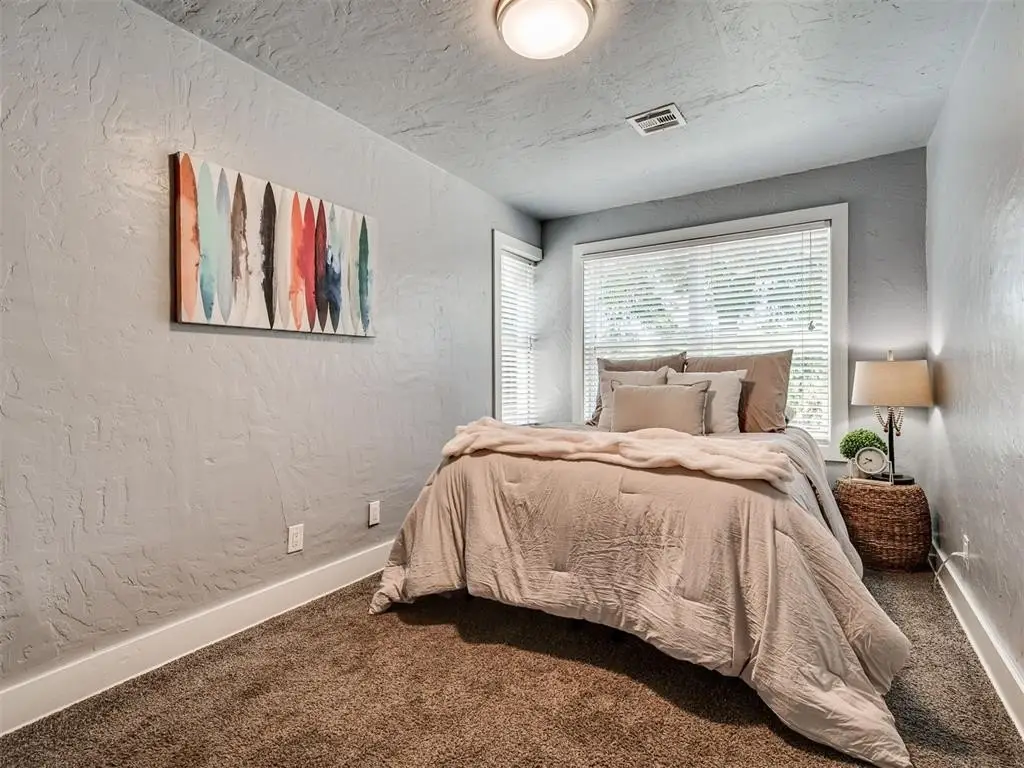
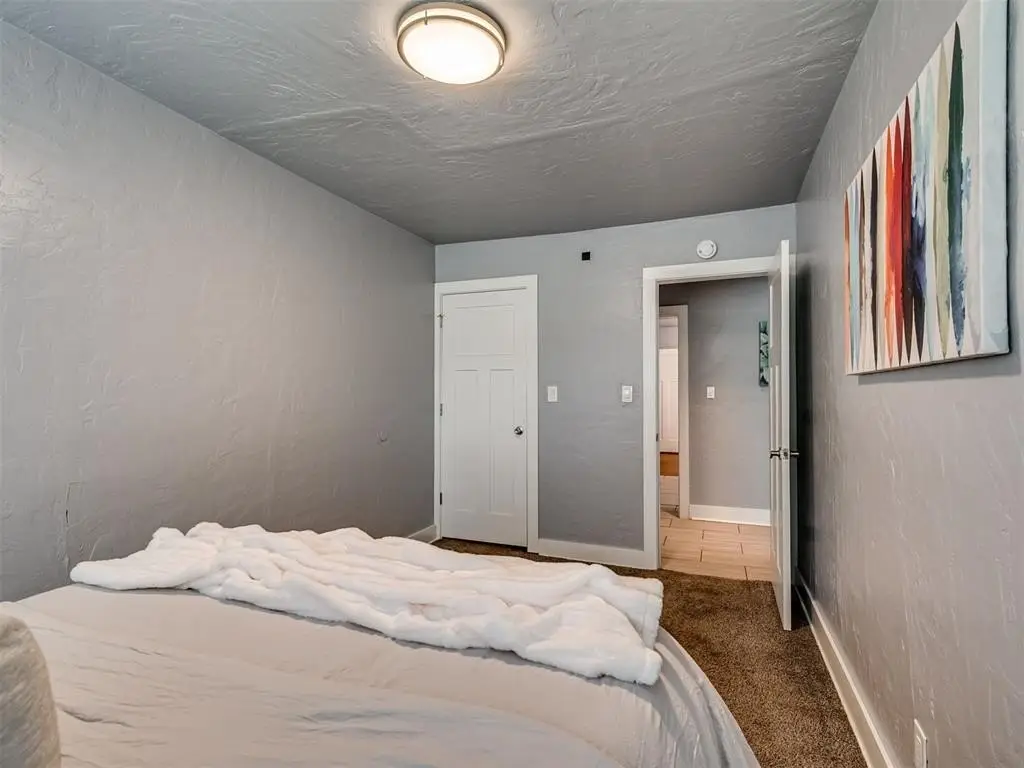
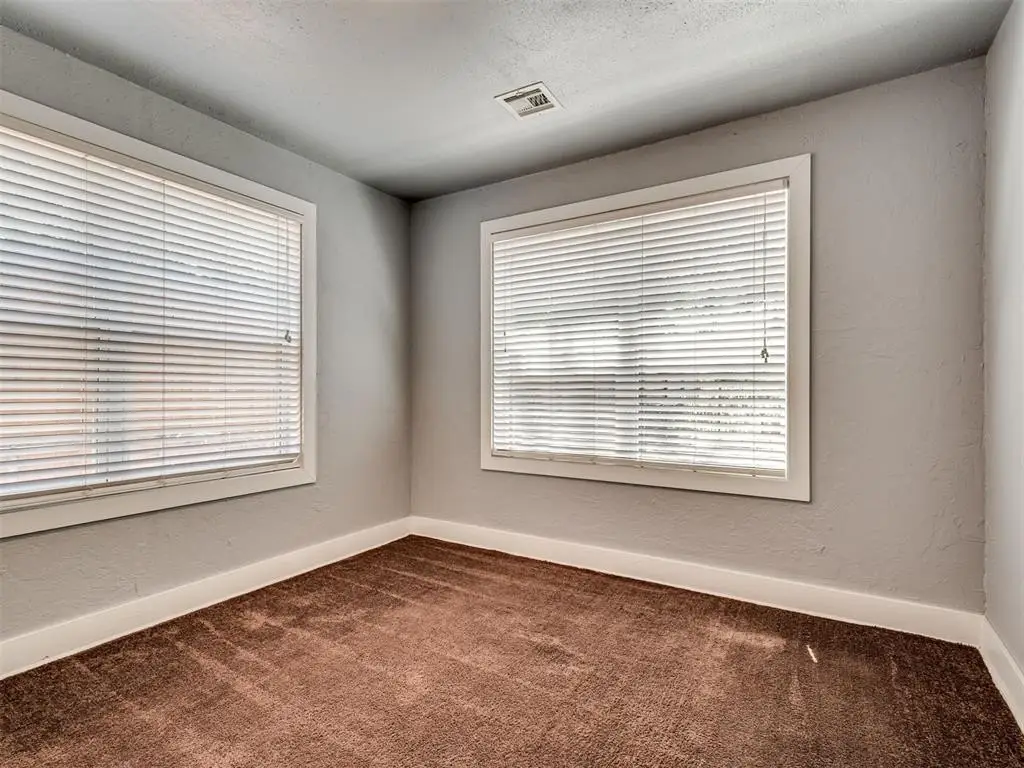
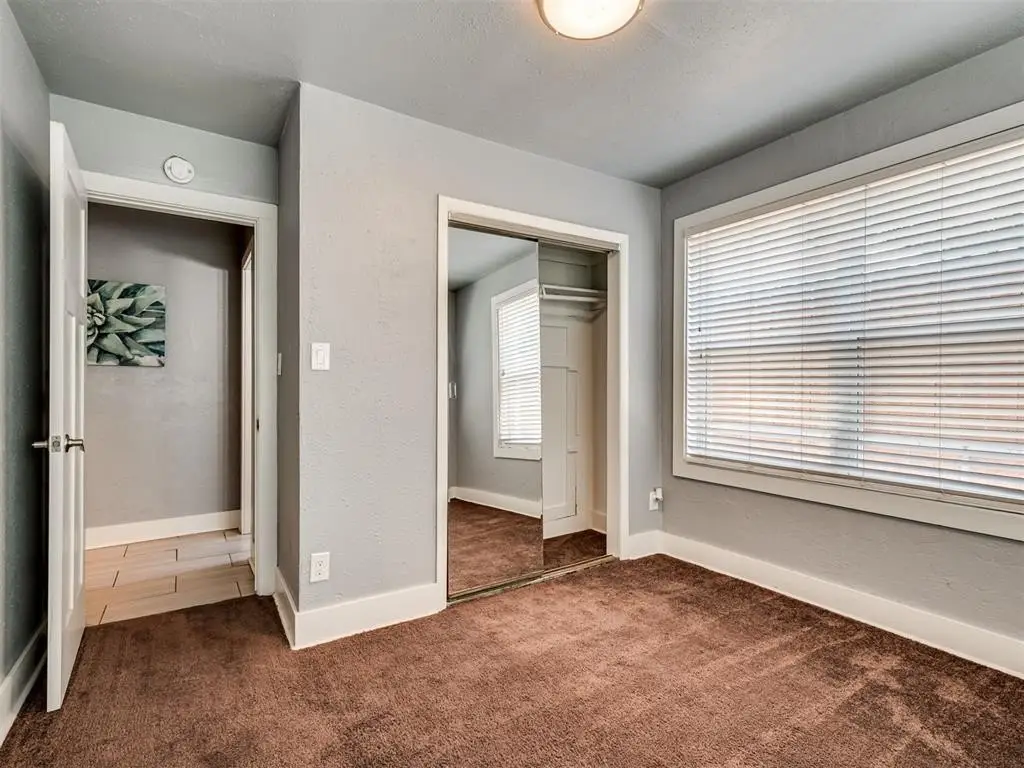
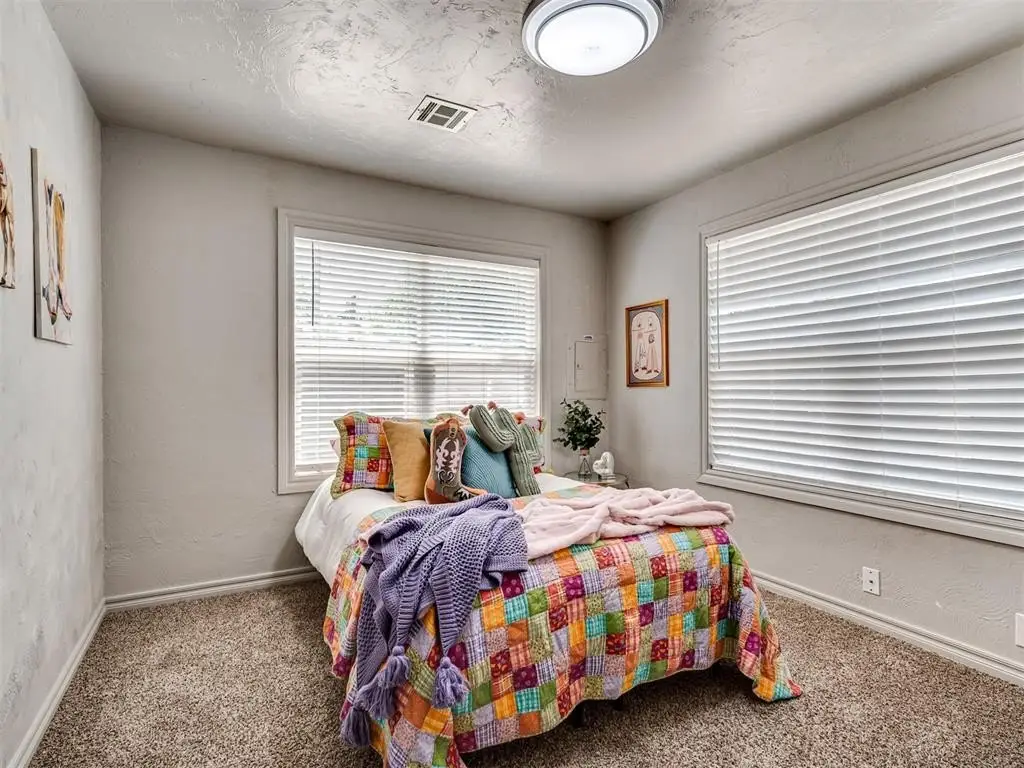
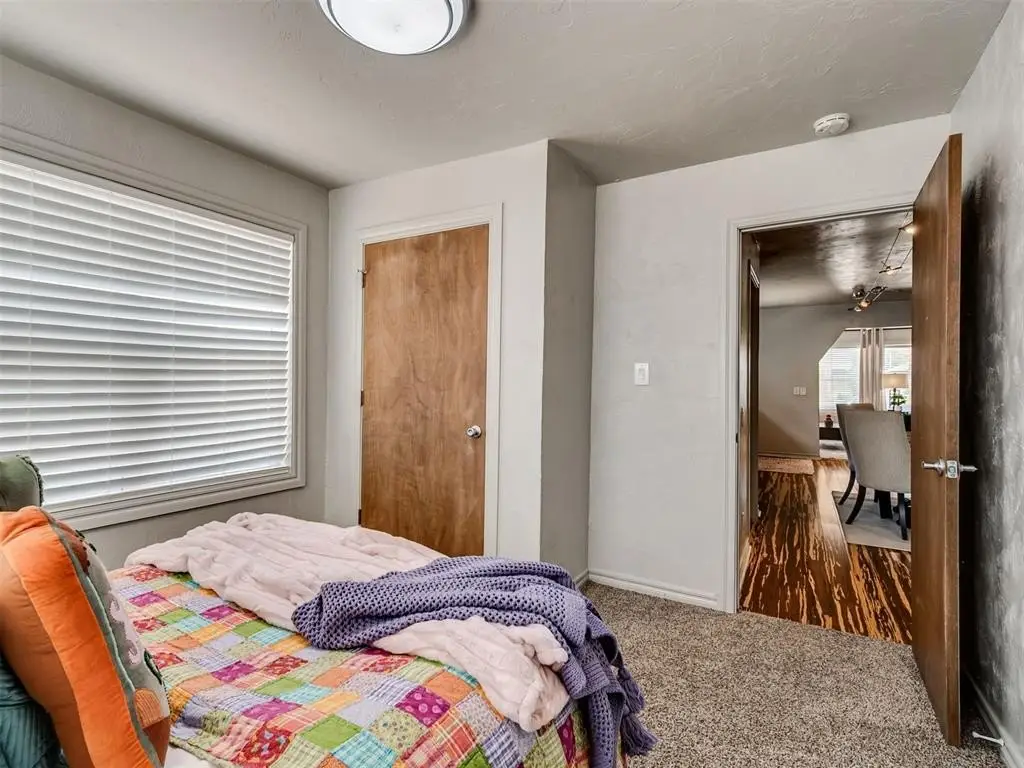
Bathroom 2, Bedroom 1, Bedroom 4, Bathroom 1, Bedroom 3, Bedroom 2
Parking
4
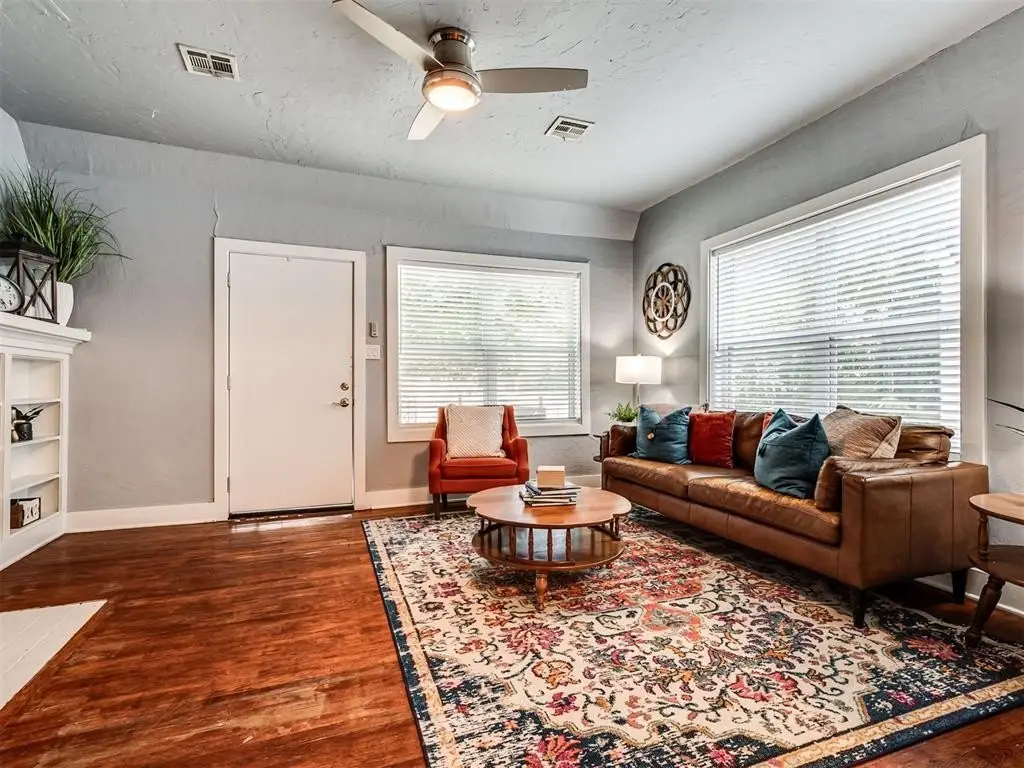
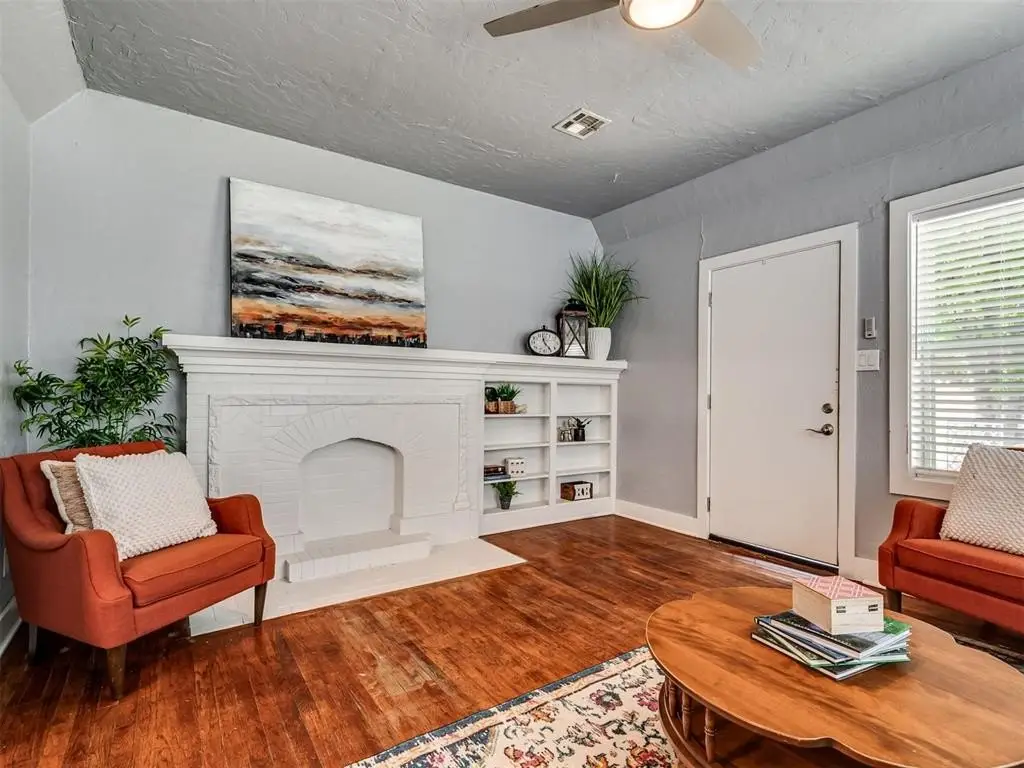
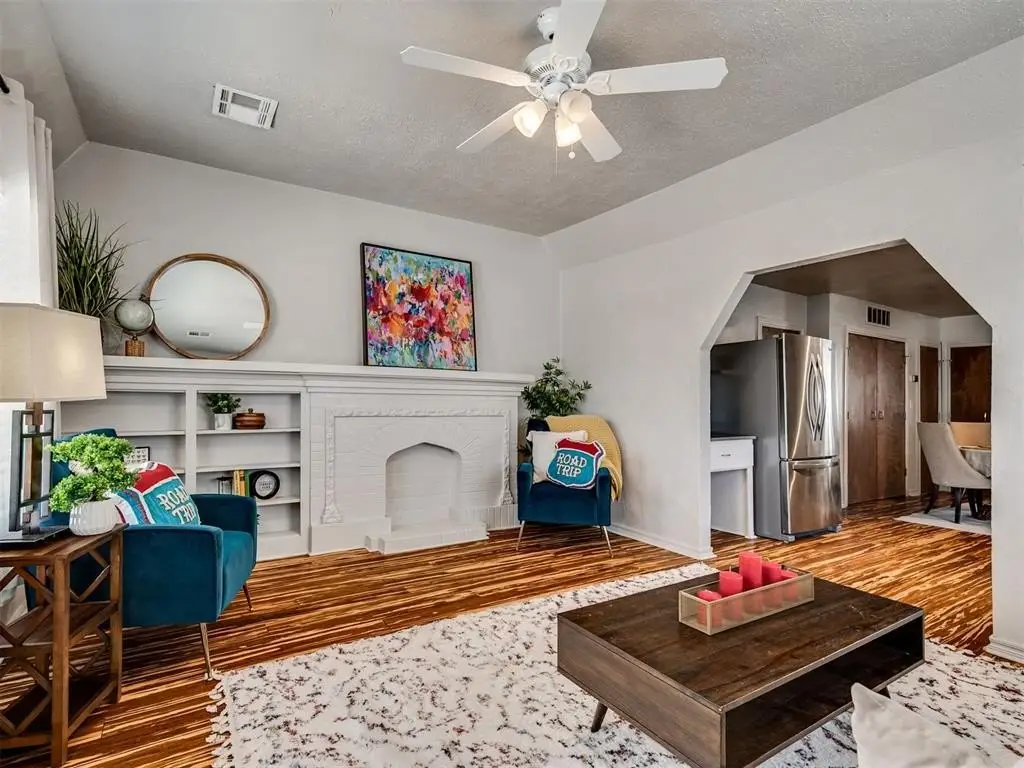
Fireplace
1
Lot features
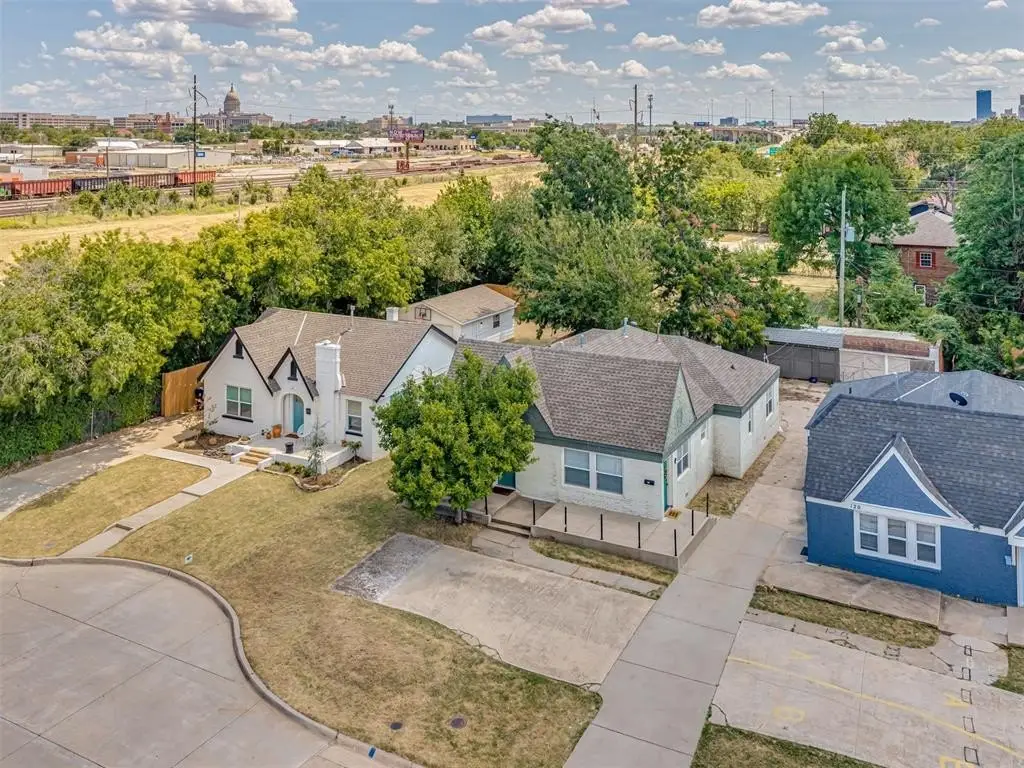
Cul-De-Sac
Elementary school
Wilson ES
Middle school
Moon MS
High school
Douglass HS
Elementary school district
Oklahoma City
Middle school district
Oklahoma City
High school district
Oklahoma City
Directions
Go N on Robinson from NW 23rd St. At NW 31st Turn Right Duplex is the next to the last house on the right.
Standard status
Pending
APN
116NW31st73118
Size
1,968 SF
Lot size
0.16 Acres
Utilities
Heating system
Natural Gas
Cooling system
Electric
Building Details
Year built
1930
Floors in Building
1
Building materials
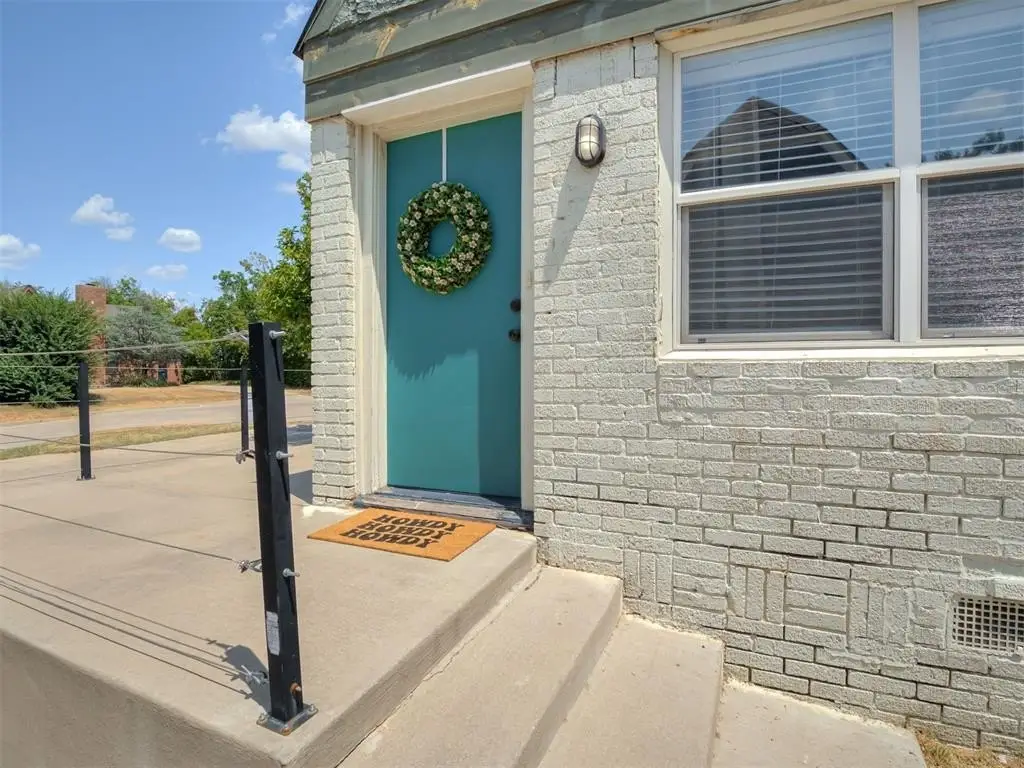
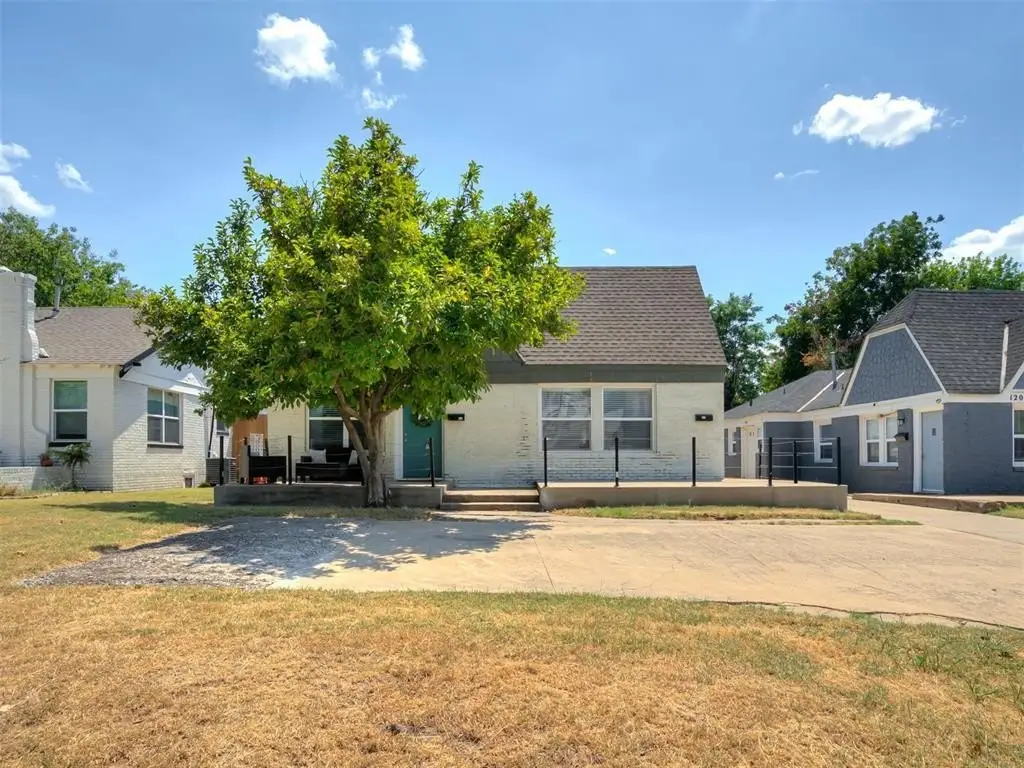
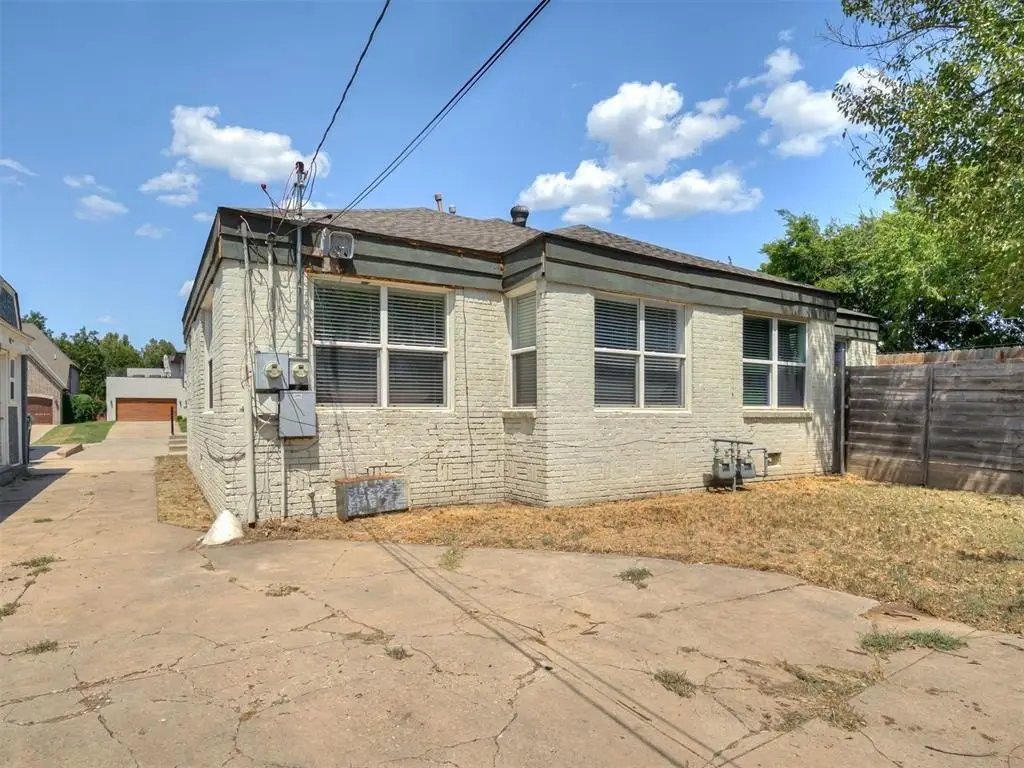
Brick & Frame
Roof type
Composition
Architectural style
Other
Listing Agency:
eXp Realty, LLC
(888) 560-3964
Listed By:
Hilary Miller
(405) 208-2123
Added: Aug 14
Changed: Sep 22
Last Checked: Oct 13 at 5:06PM
MLS# 1244510
Copyright © 2026 MLSOK, Inc. All rights reserved. All information provided by the listing agent/broker is deemed reliable but is not guaranteed and should be independently verified.
Investment Insights
Based on property information with market context.
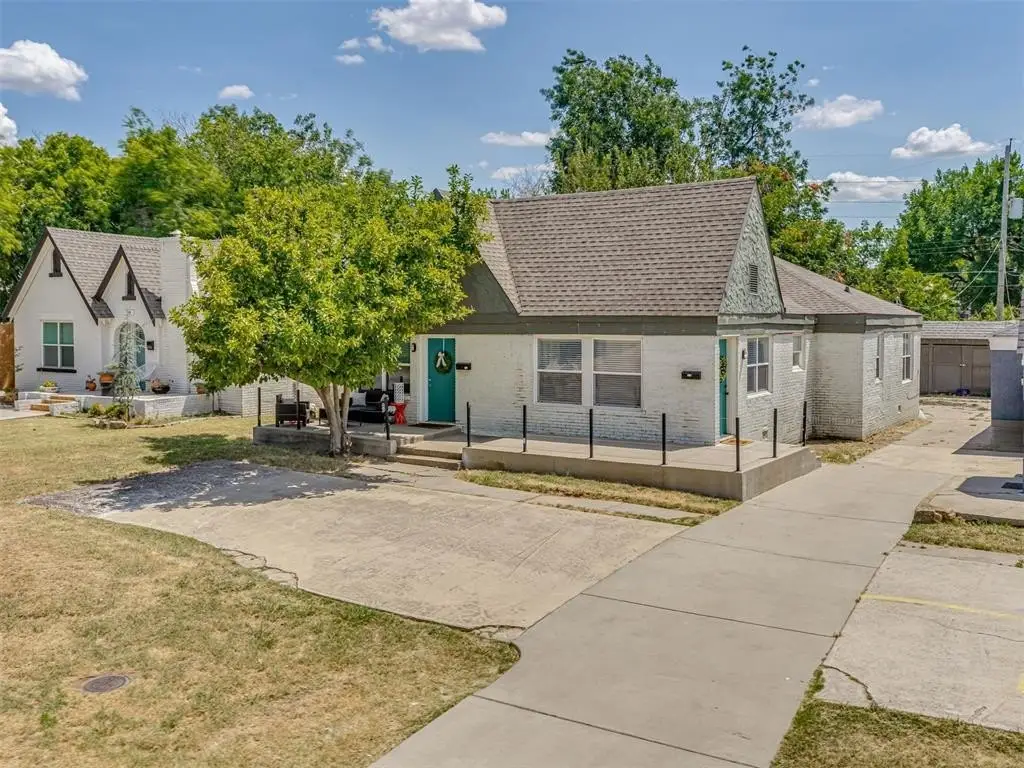
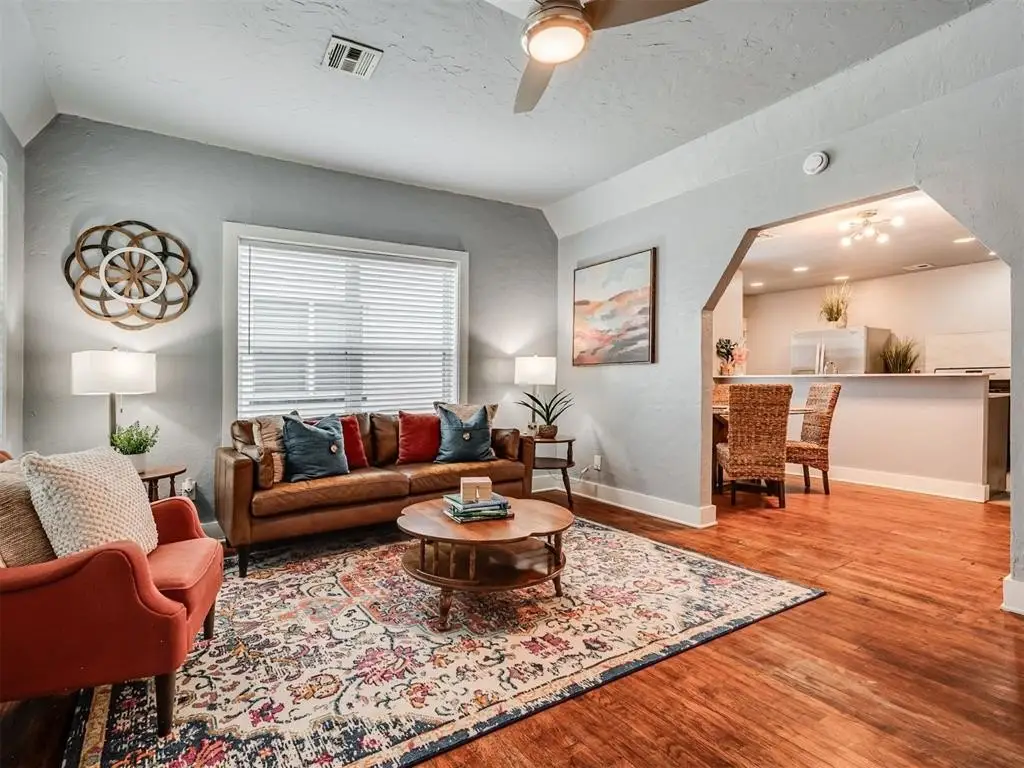
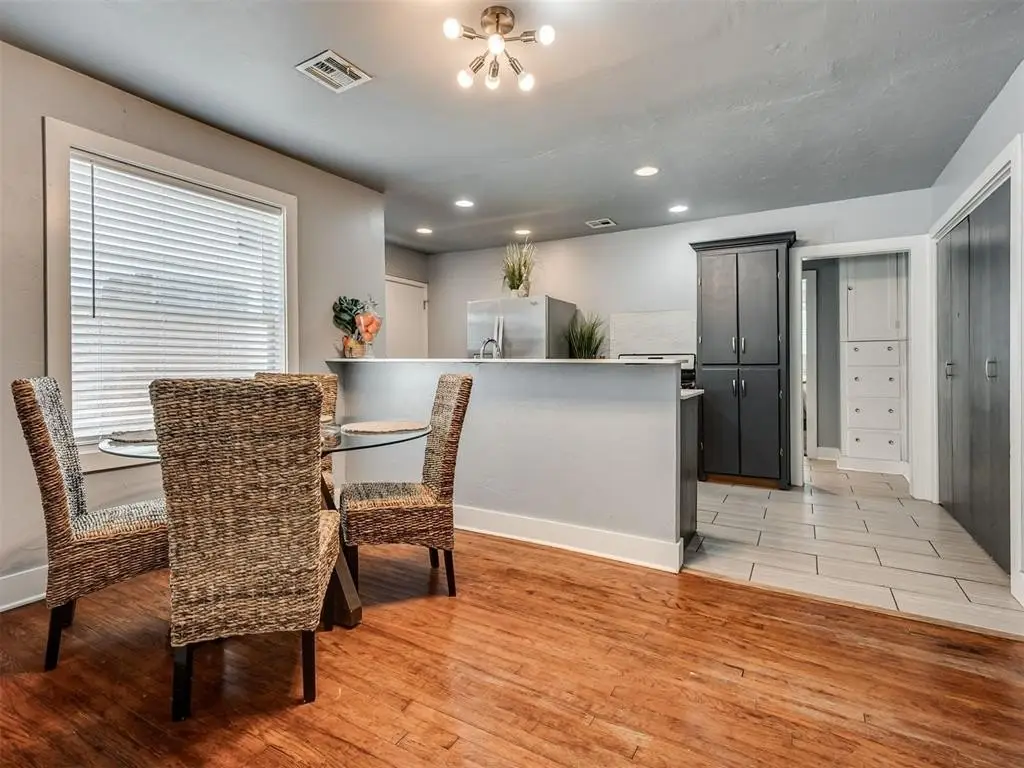
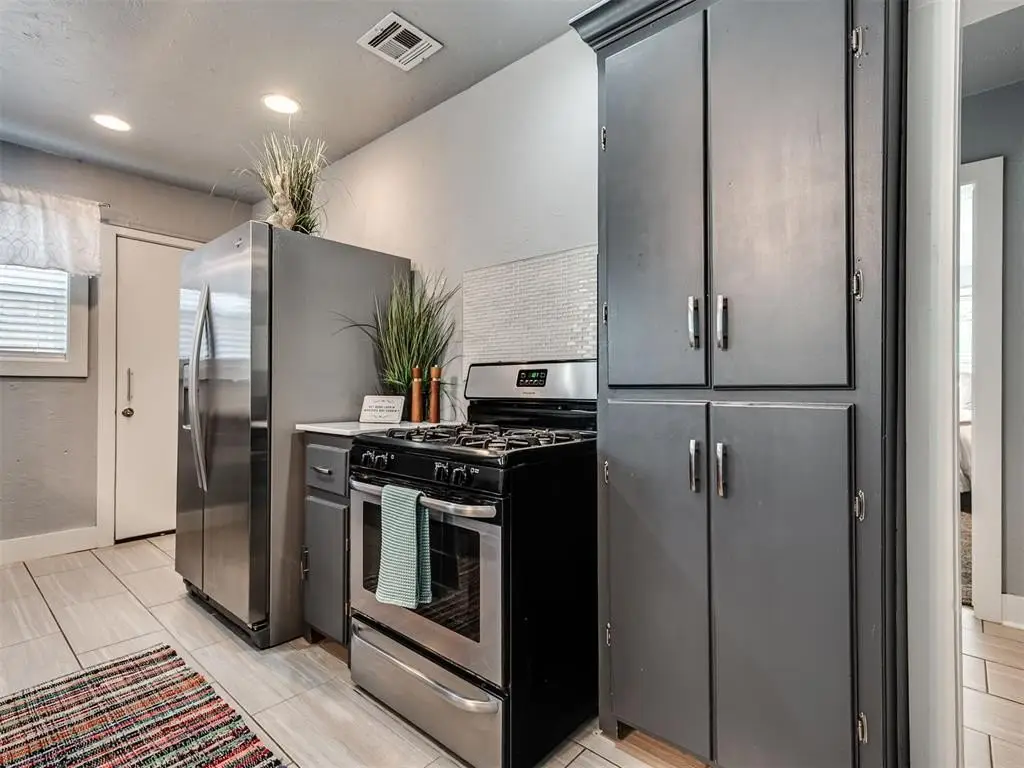
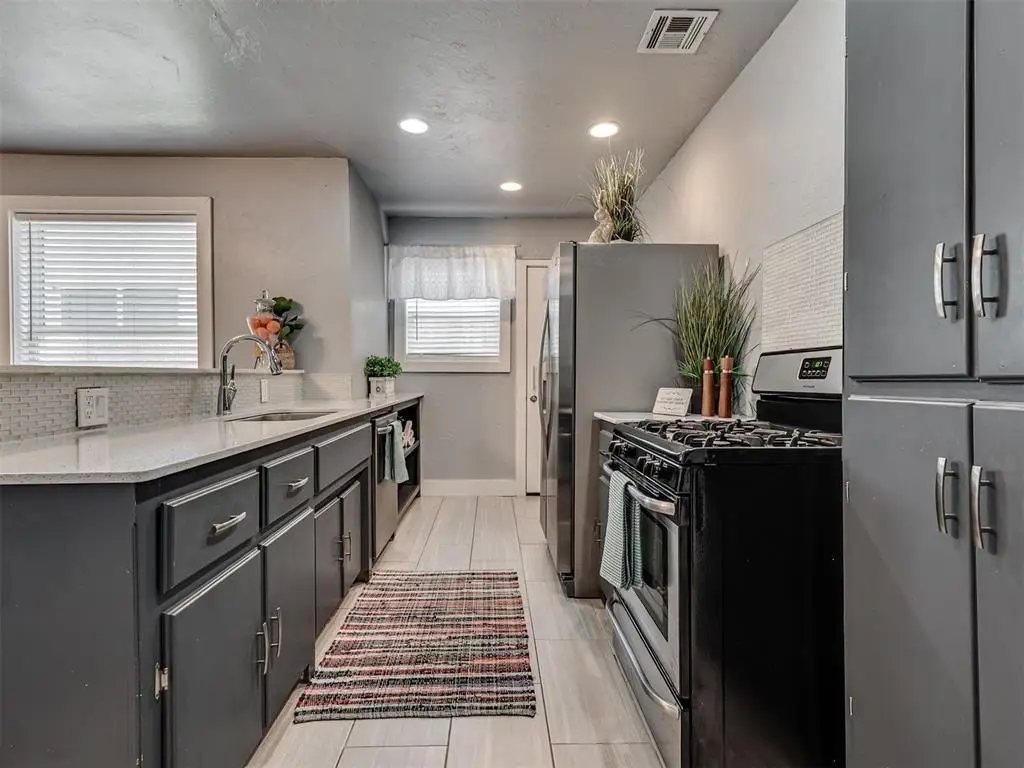
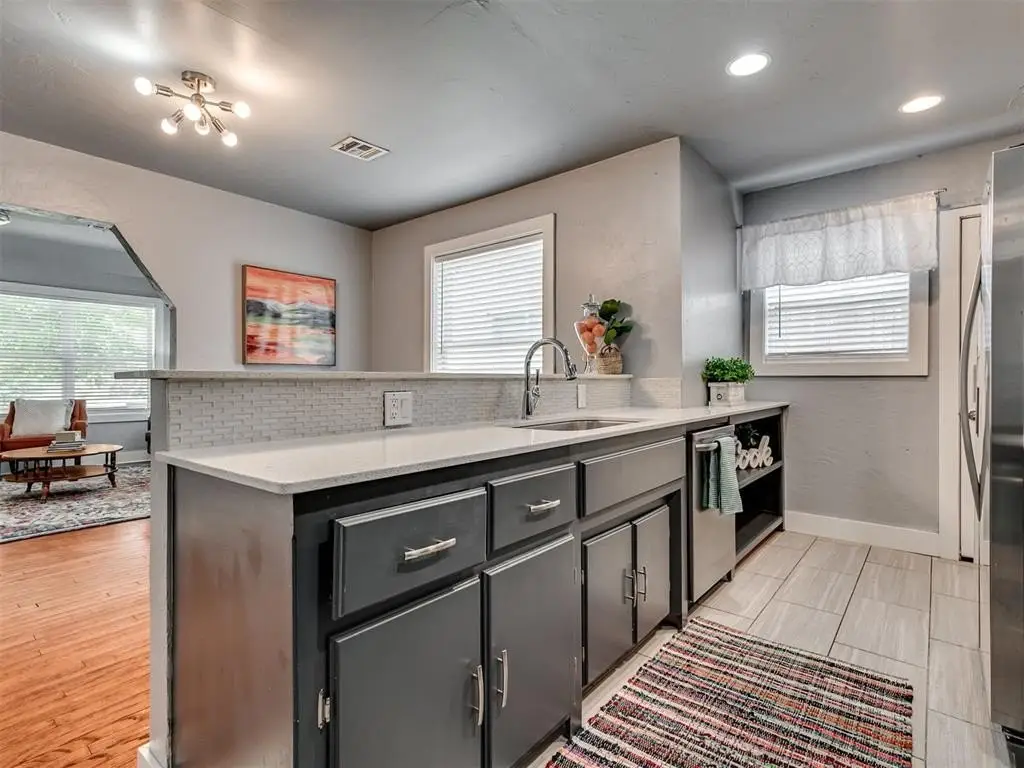
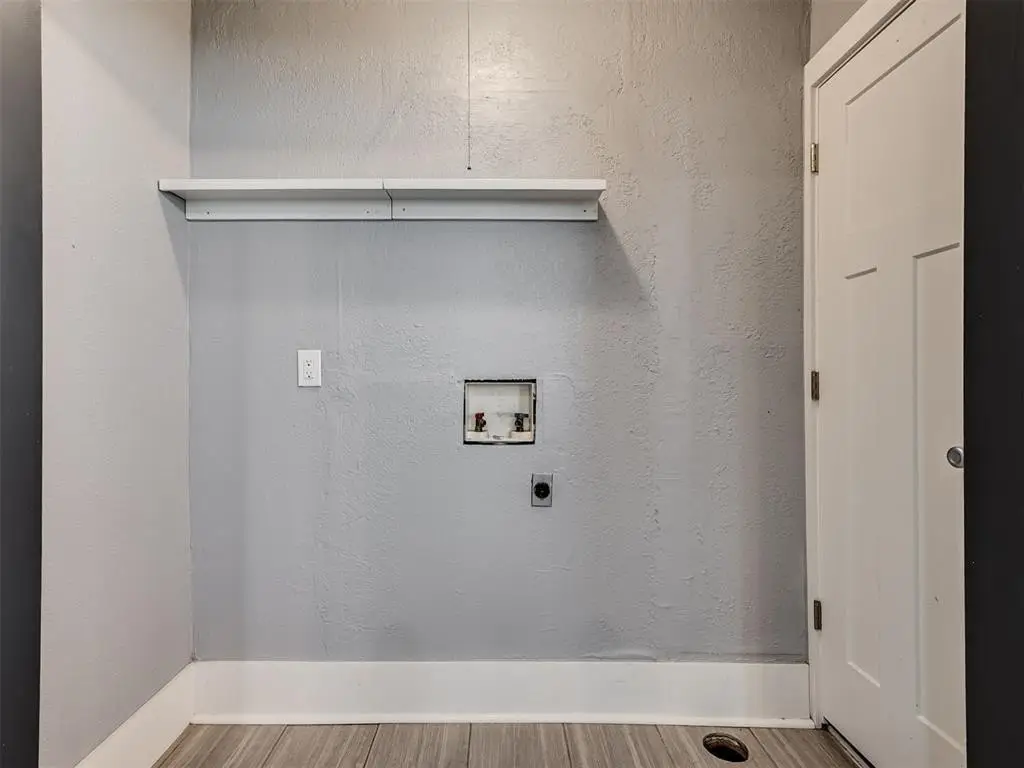
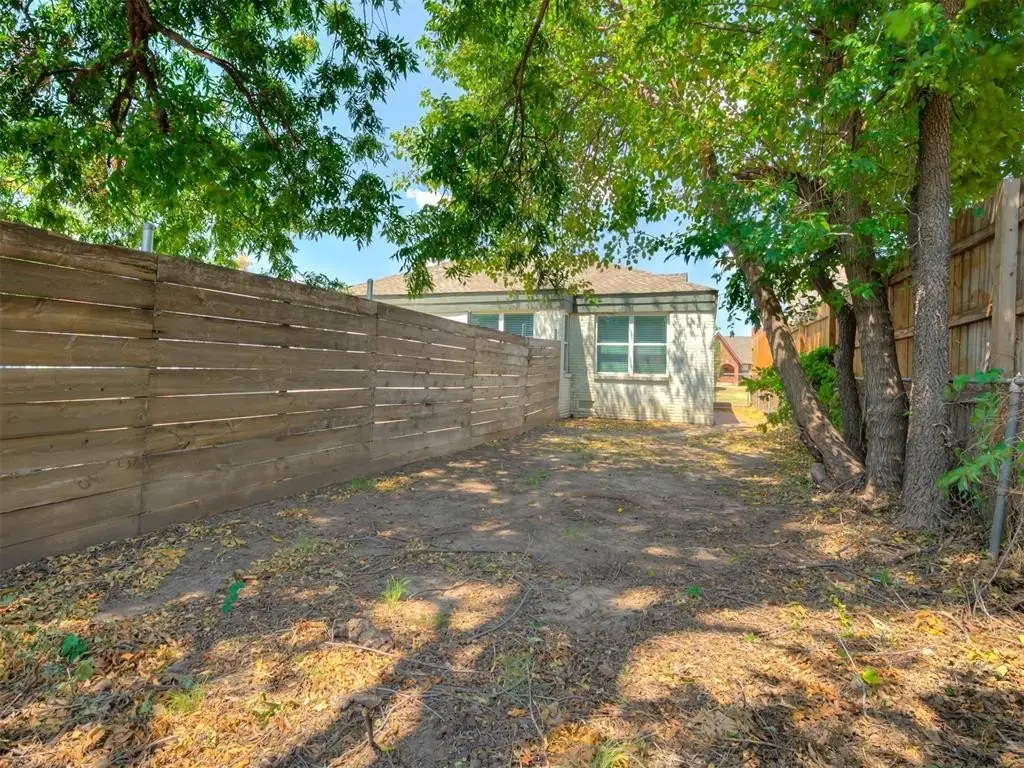
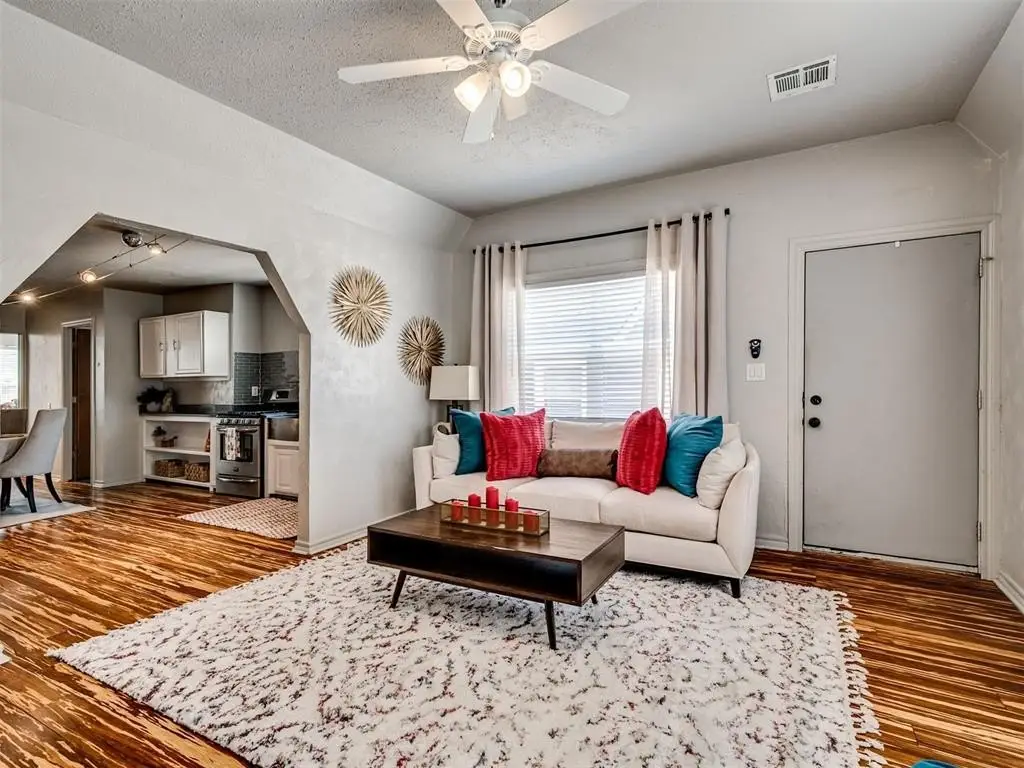
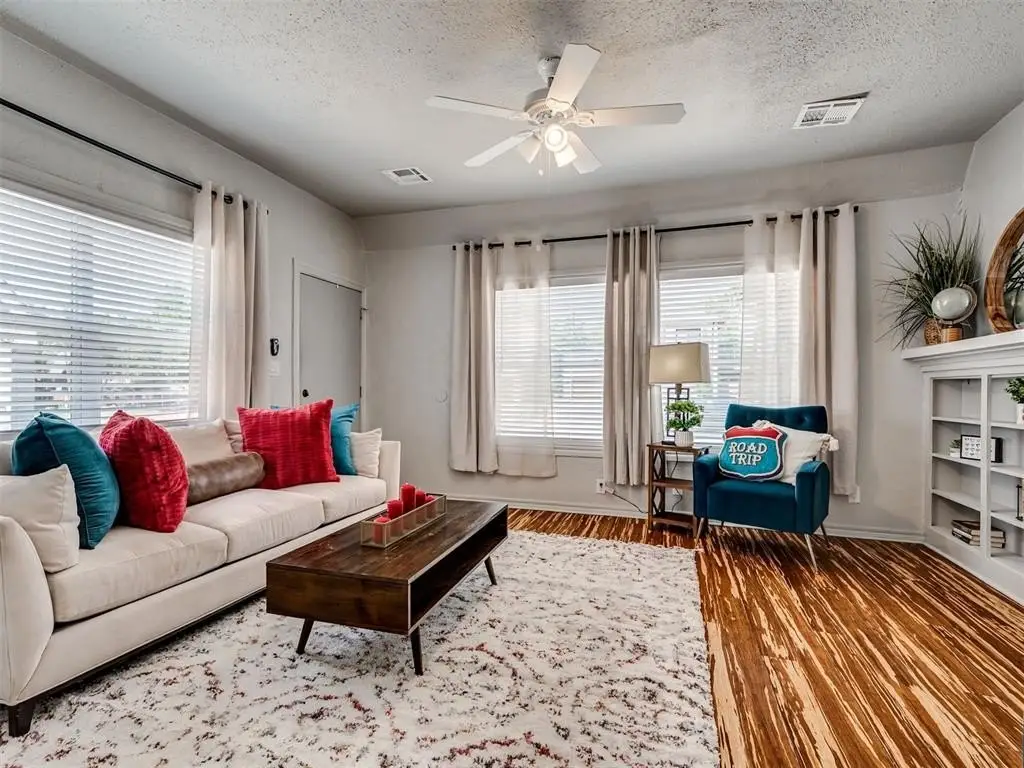
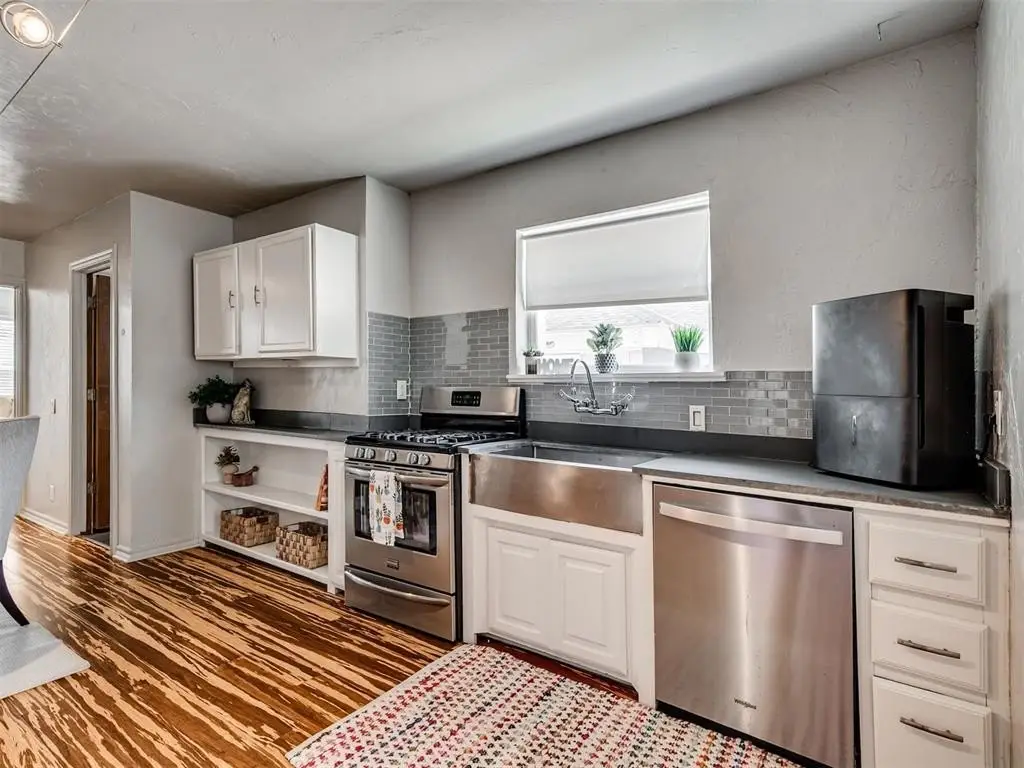
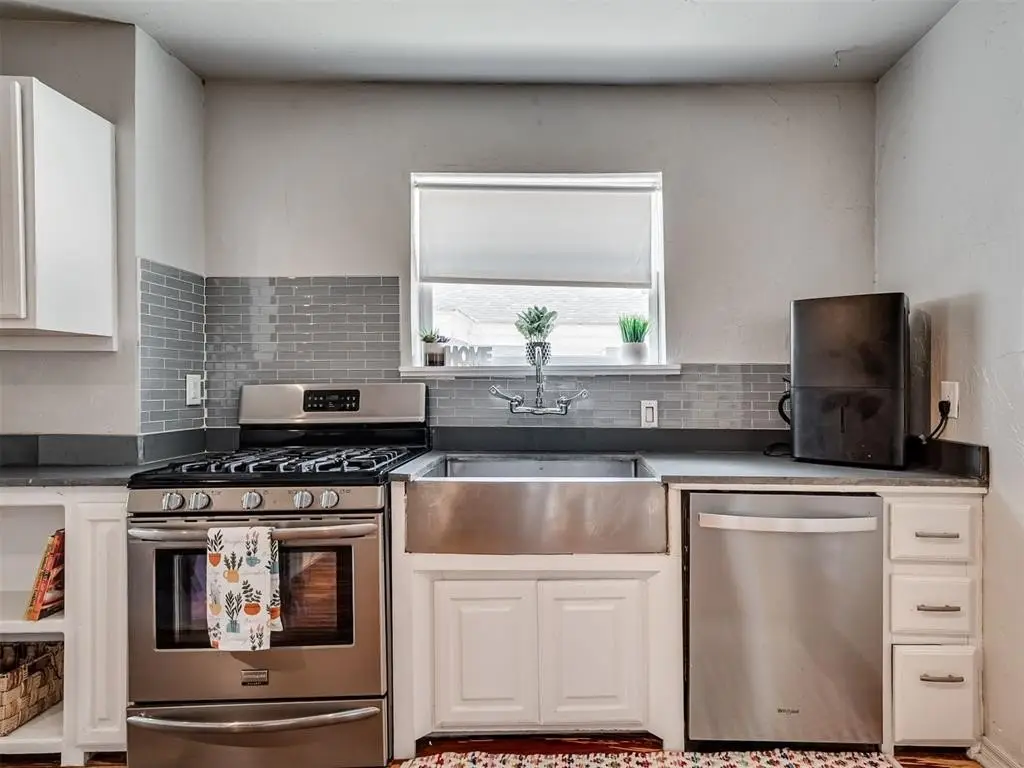
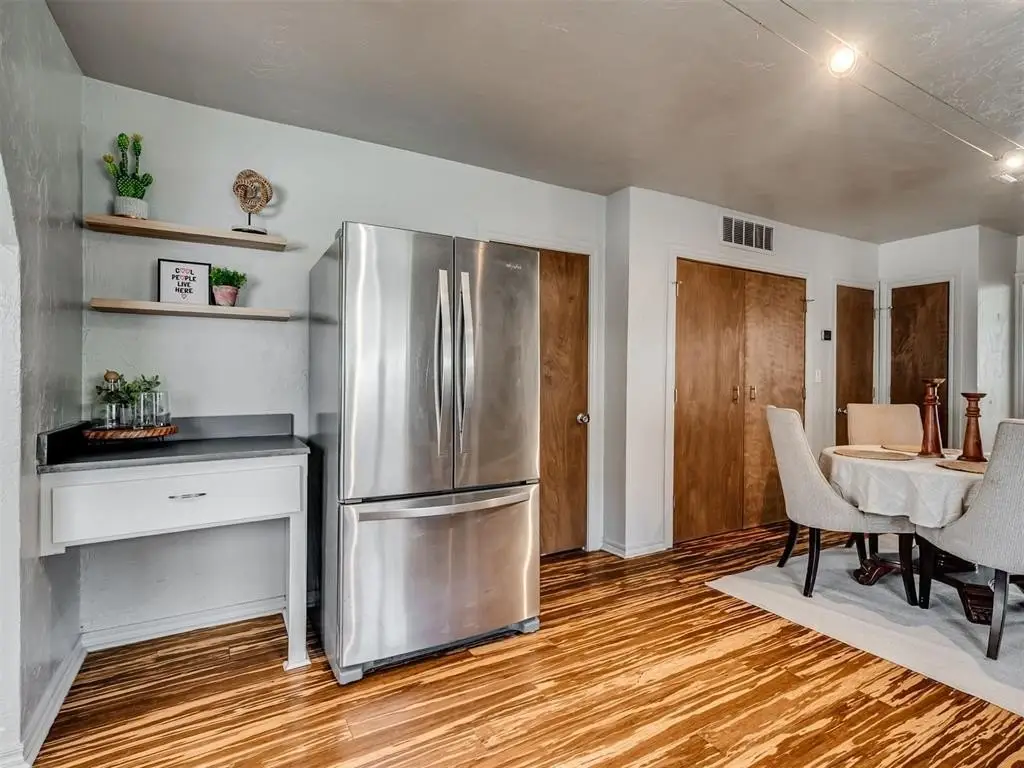
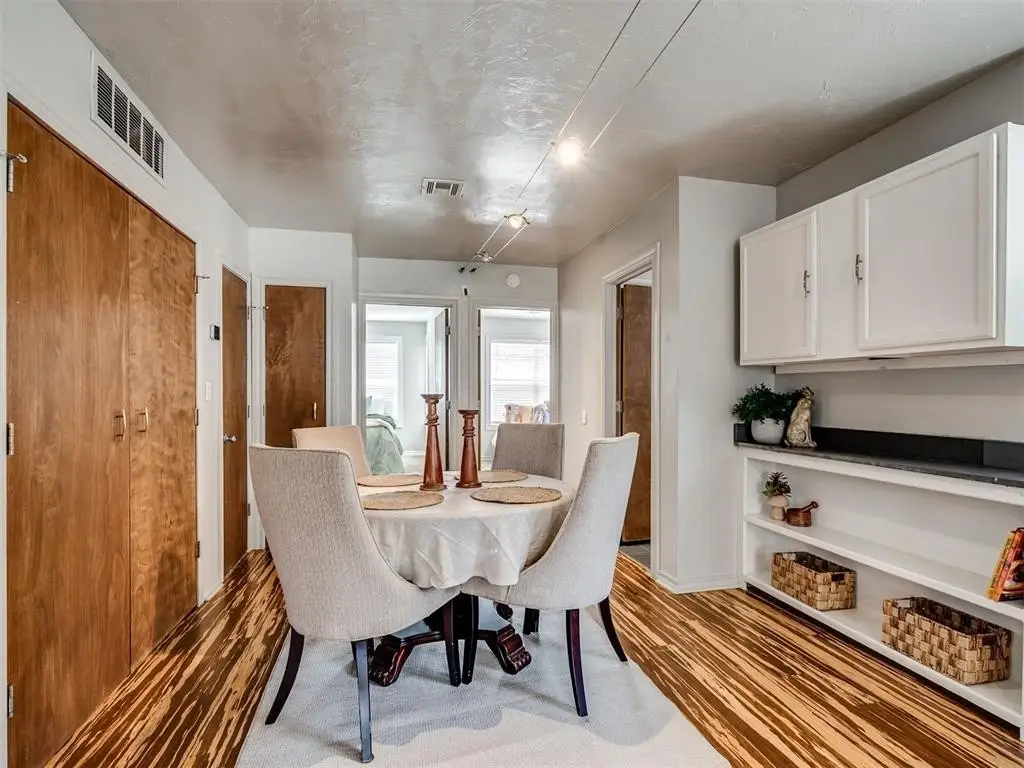
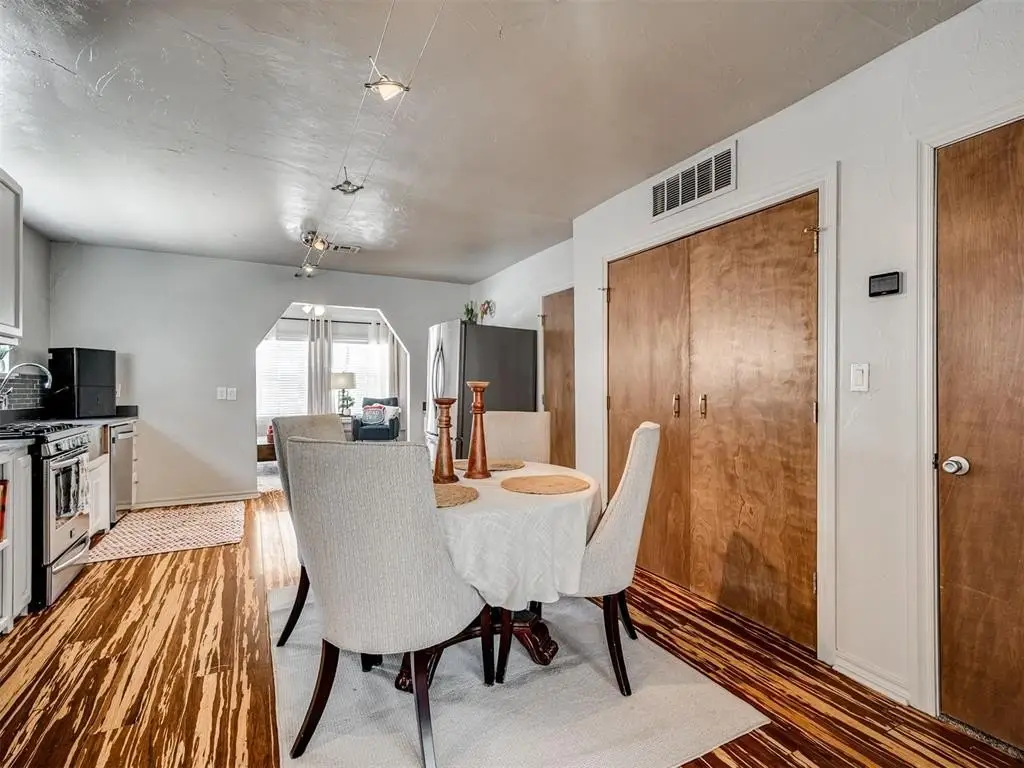
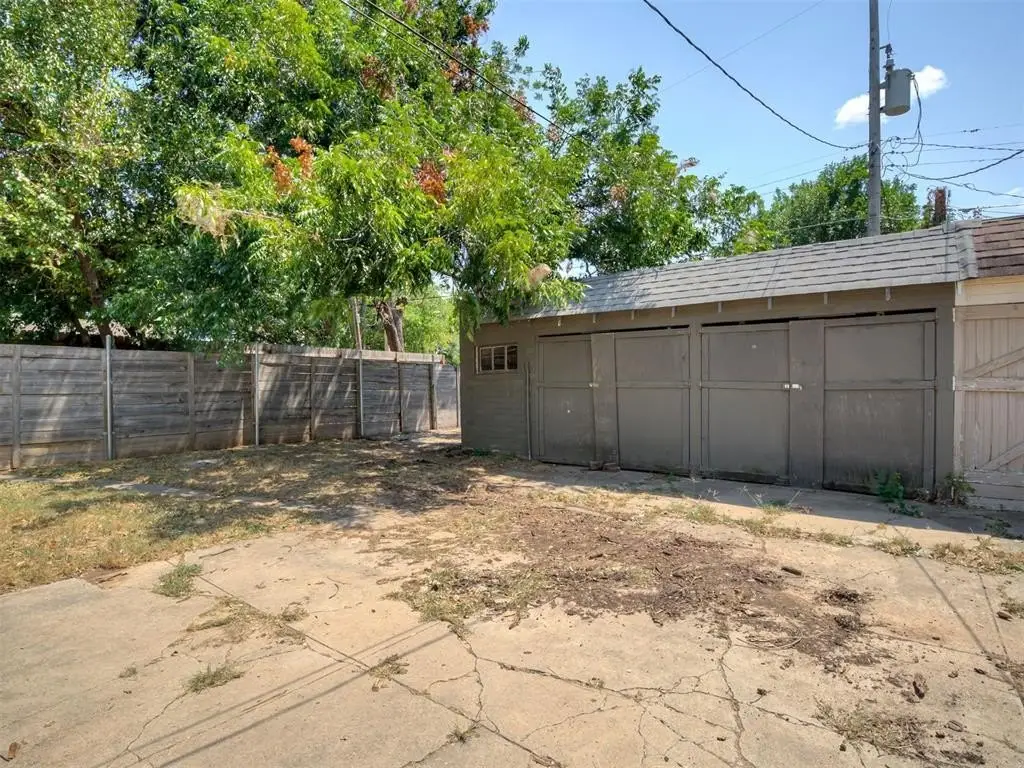
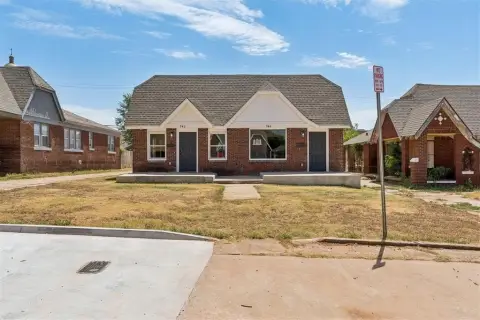
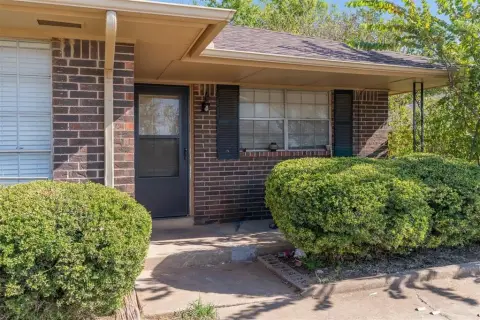
Located at 116 NW 31st Street in Oklahoma City, this duplex contains two residences with practical two-bedroom, one-bath layouts. Each side has its own entrance and one garage space, with outdoor area accompanying the property. The 1,968-square-foot building sits on 0.1607 acres and dates to 1930. Brick-and-frame construction, composition roofing, natural-gas heating, electric cooling, and a fireplace are among the existing features.
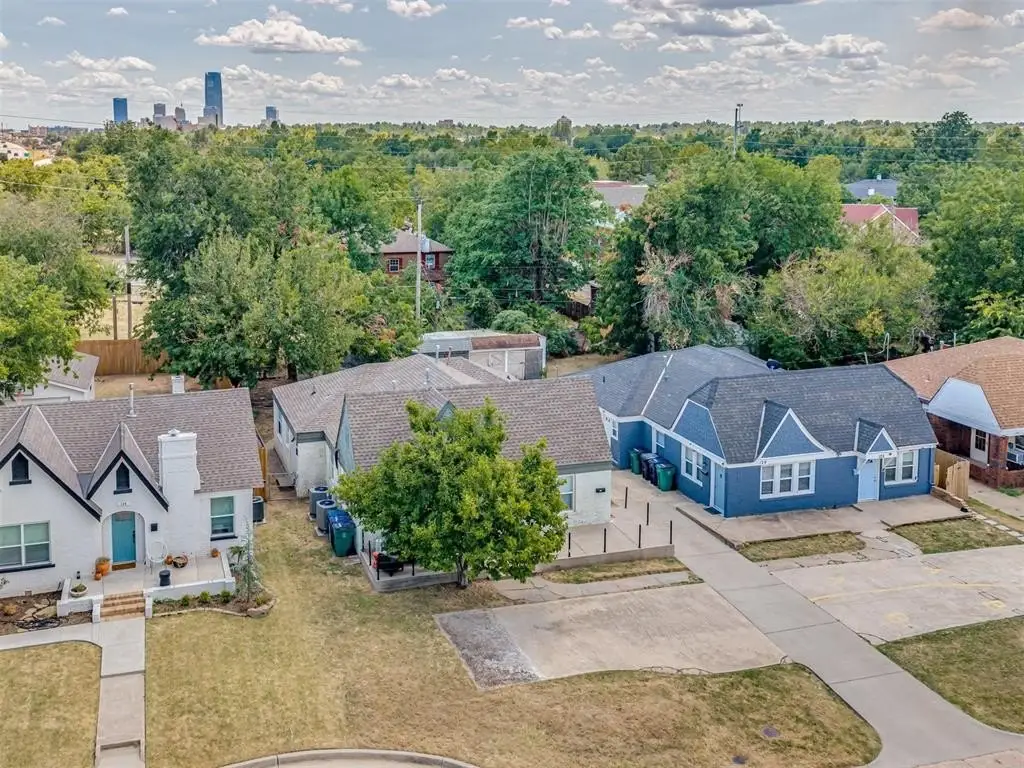
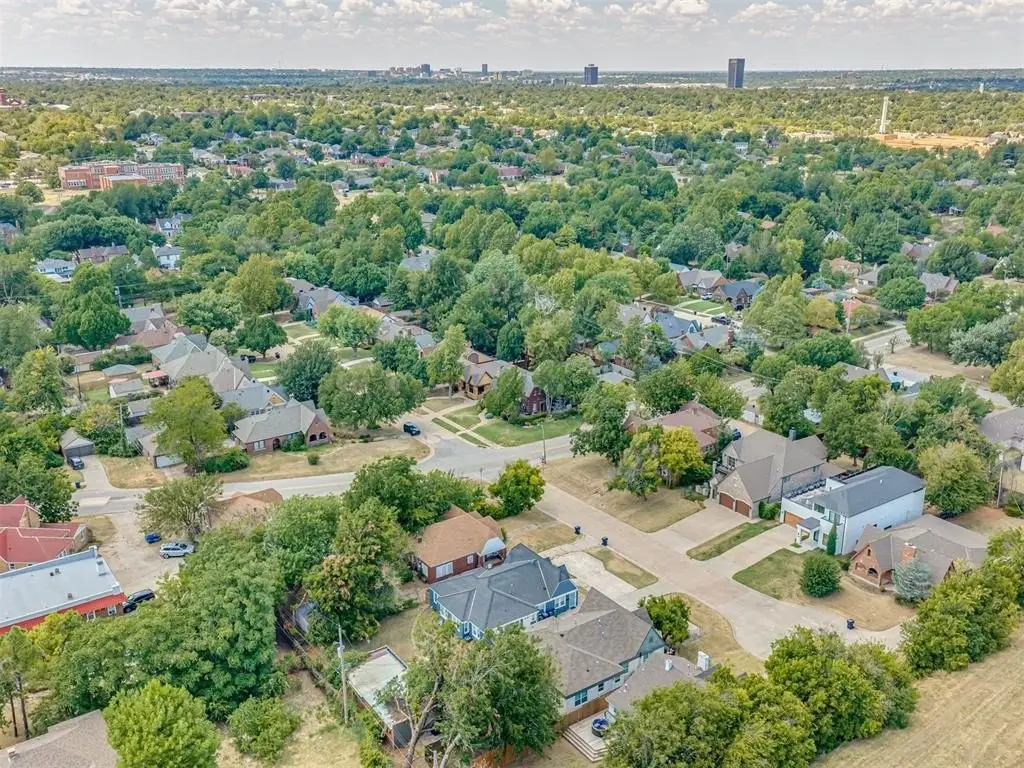
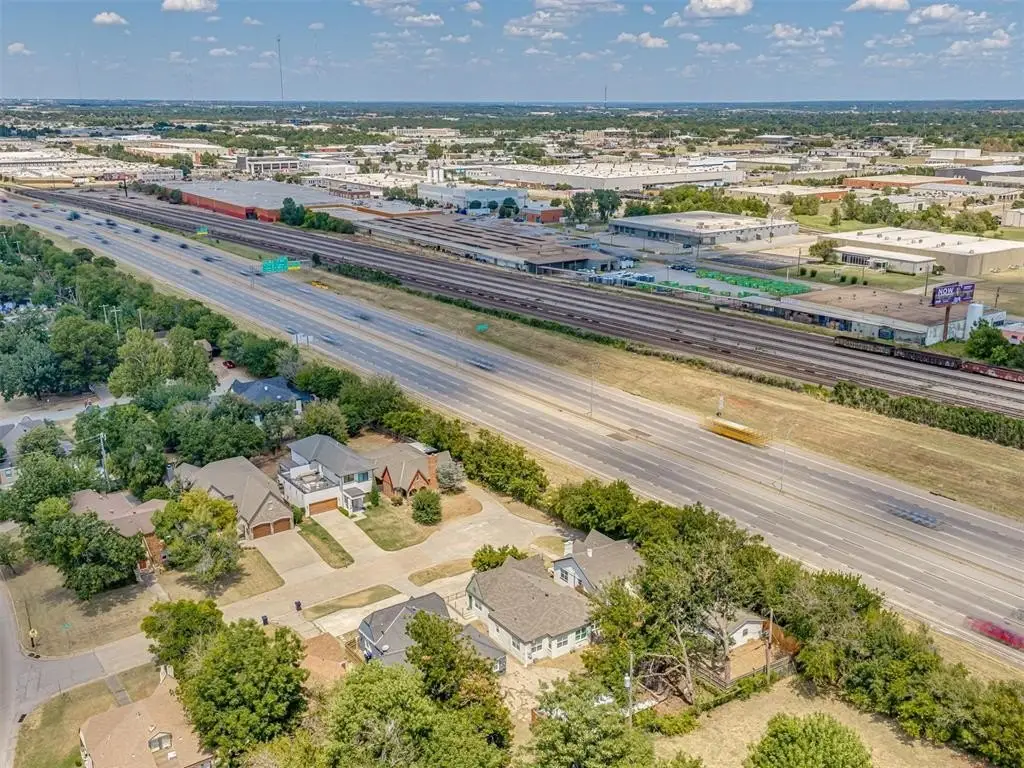
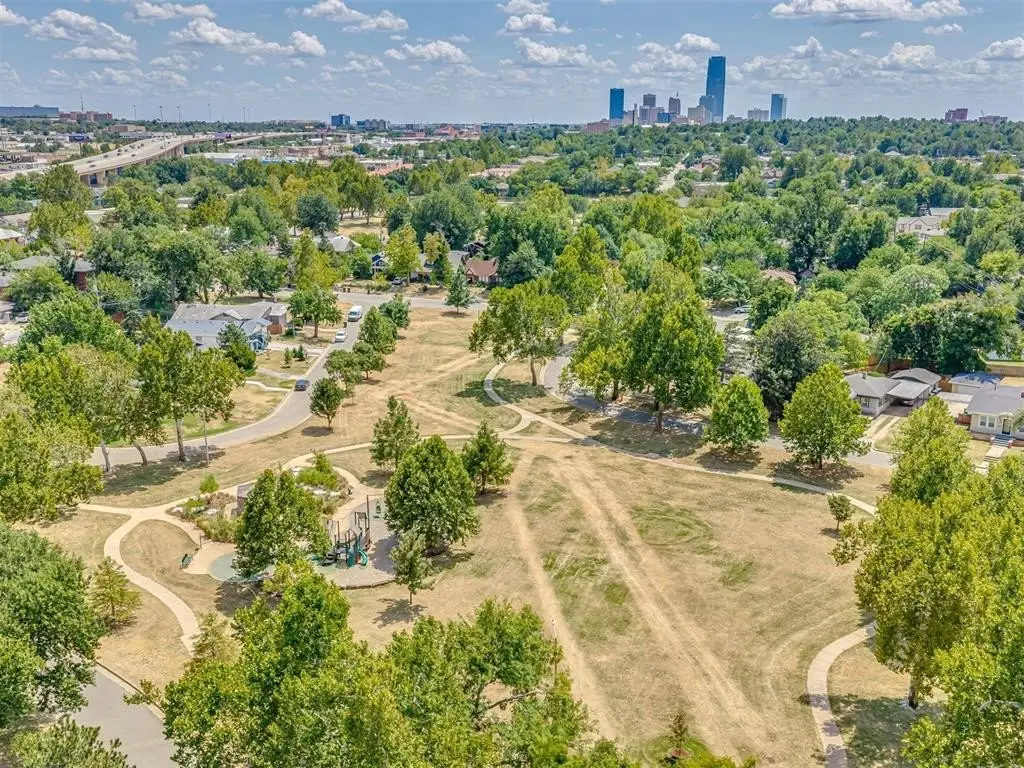
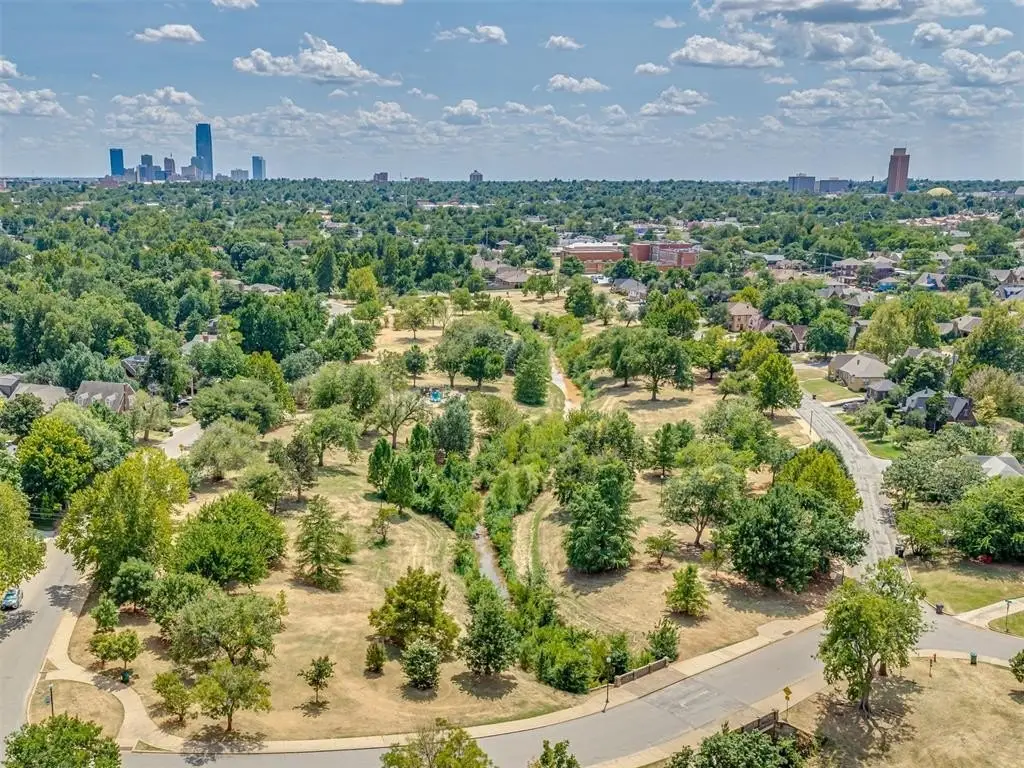
The property is positioned near the Health Science Center, State Capitol campus, Uptown 23rd, Plaza District, Asian District, Midtown, and downtown Oklahoma City. I-235, I-44, and I-40 provide regional access, while nearby destinations include restaurants, coffee shops, medical centers, universities, shopping, and major employers. The two-unit configuration supports owner occupancy with a second residence or leasing both sides.
The property is positioned near the Health Science Center, State Capitol campus, Uptown 23rd, Plaza District, Asian District, Midtown, and downtown Oklahoma City. I-235, I-44, and I-40 provide regional access, while nearby destinations include restaurants, coffee shops, medical centers, universities, shopping, and major employers. The two-unit configuration supports owner occupancy with a second residence or leasing both sides.
Key Highlights
- Two‑unit duplex with 2 bedrooms and 1 full bath per unit
- 1,968 square feet on a 0.1607‑acre lot
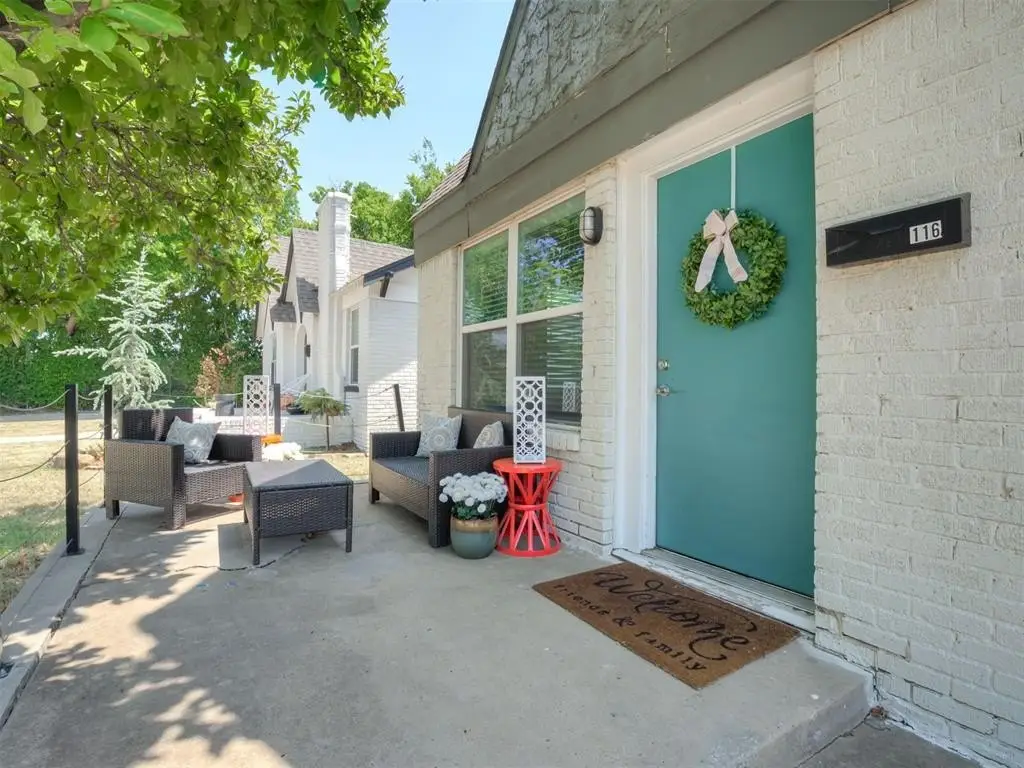
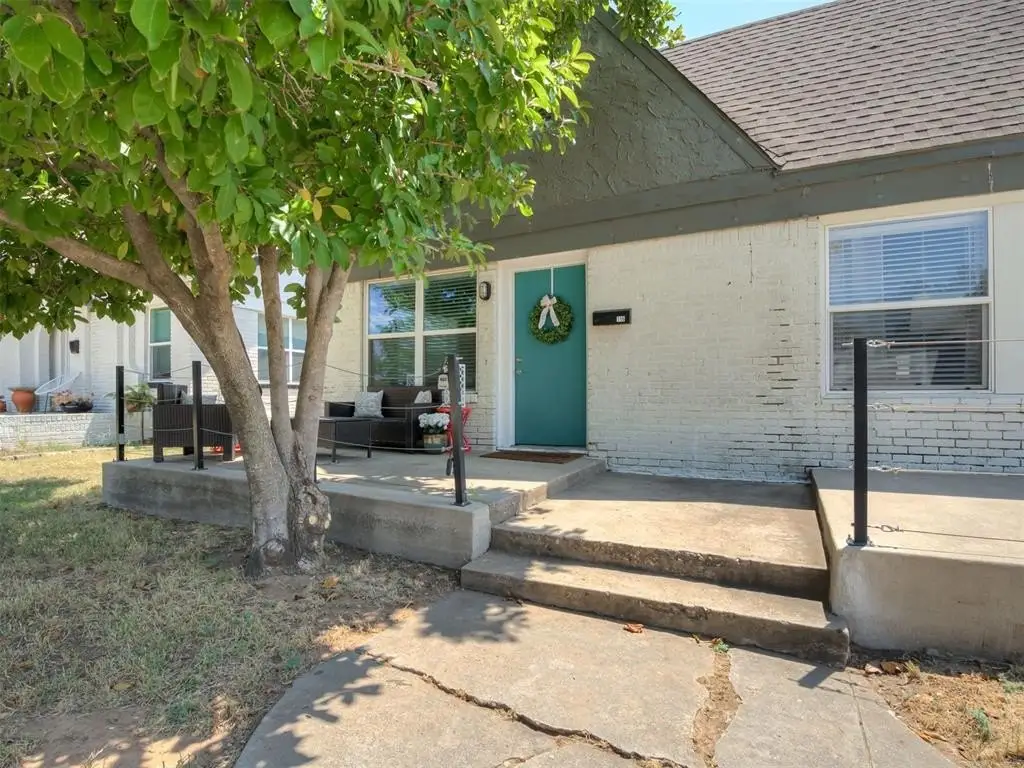
- Private entrance for each residence
Financial Insights
Estimated NOI and Cap Rate
NOI / Yr
$17,965
Cap Rate
5.70%
Suggested Prices Based on Cap Rates
Cap Rate 5%
$359,300
$359.3K
Cap Rate 7%
$256,643
$256.6K
Cap Rate 9%
$199,611
$199.6K
Market Conditions
NOI Build-Up for 1,968 SF
Gross rent
$27.2K $13.80/SF
− Vacancy
−$1.5K −$0.76/SF
EGI
$25.7K $13.04/SF
− OpEx
−$7.7K −$3.91/SF
NOI
$18.0K $9.13/SF
Area
Oklahoma City, OK
Vacancy
5.50%
Lease Rate
$13.80 /SF/Yr
Expense Ratio
30.00%
Simulate Cap Rate and NOI
Suggested Prices Based on Cap Rates
Cap Rate 5%
$359,300
Cap Rate 7%
$256,643
Cap Rate 9%
$199,611
Alternative Uses
Best Use
Multifamily LT 5
$256.6K
$224.6K – $299.4K
NOI $17,965 @ 7.0% cap · market cap 5.70%
Second Best
Apartment 5plus
$237.5K
$207.8K – $277.1K
NOI $16,623 @ 7.0% cap · market cap 5.28%
Theoretical Best
Specialty Retail
$673.1K
$588.9K – $785.2K
NOI $47,114 @ 7.0% cap · market cap 14.96%
Zoning and permitted uses should be independently verified with authorities.
How Realmo checks its estimates
Property Analytics
Unlock full access to Insights
Subscribe to Realmo Intelligence
Open Analytics
Current Use
Lease Details
2
Residential units
Yes
Highway access
Yes
Paved road access
Location Intelligence
Trade Area within ½ mile
916
Businesses Nearby
Explore this area
Business Placement
Demographics for 73118, OK
13,521
Population
7,856
Households
1.7
Avg Household Size
37
Median Age
49%
College-Educated
92%
High-School Grad
4.8 sq mi
ZIP Area
2,817
Density / Sq Mi
$69,321
Median Household Income
$45,494
Median Earnings
$1,064
Median Rent
$252,500
Median Home Value
Check the figures for this property
Cap Rate, Value Estimation, Potential NOI and more
View Realmo Analytics
Market
Vacancy Rate% for Multifamily in South region

Questions? Ask Rey
Realmo’s AI knows this listing — price, zoning, demand, history. Ask anything.




Frequently Asked Questions
What type of property is this?
Duplex - Two separate residences offer private entries, individual garages, and flexible occupancy options.
Where is this duplex located?
The property is located at 116 NW 31st Street Oklahoma City, OK.
What is the asking price?
The asking price for this property is $315,000.
What are key features of this property?
This property features: Two‑unit duplex with 2 bedrooms and 1 full bath per unit; 1,968 square feet on a 0.1607‑acre lot; Private entrance for each residence


