Updated Two-Unit
For Sale
$269,990
2436 NW 16th St, Oklahoma City, OK 73107
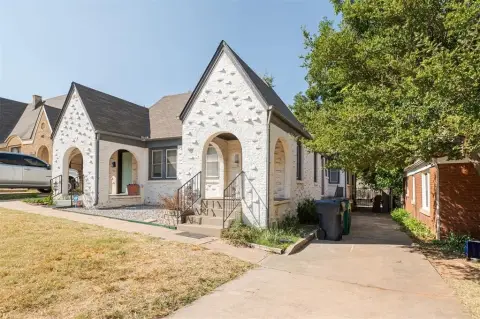
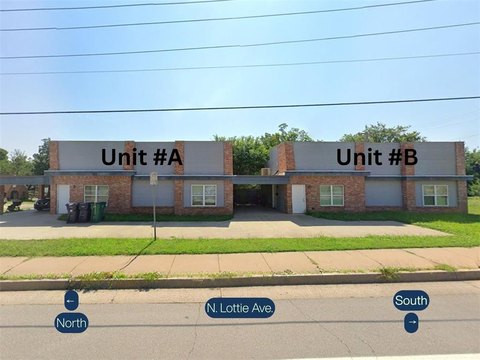
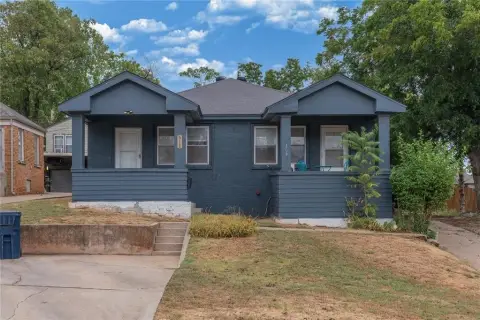
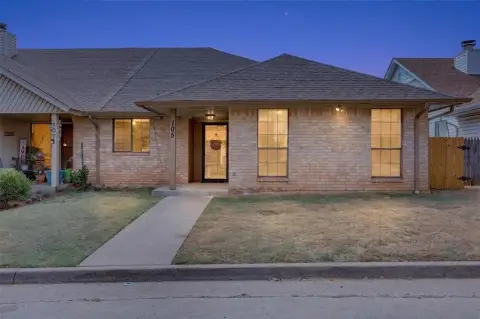
Two mirrored residences pair original character with renovated kitchens, bathrooms, and convenient laundry hookups.
Property Size1,776 SF
Price / SF$152.02
Days on Market82
Property Features for 2436 NW 16th St
General Information
Standard status
Active
Size
1,776 SF
Property subtype
Multi-Family
Building Details
Year Built
1920
Listing Agency:
Solas Real Estate LLC
Listed By:
Kaci Kaiser
(405) 312-3264
Source:
Sarahflemingestates
Added: Jul 28
Changed: Oct 5
Last Checked: Oct 7 at 4:13PM
Displayed information is deemed reliable but is not guaranteed and should be independently verified. All listing content including descriptions, pricing, images are the copyrighted material of Solas Real Estate LLC

Ask AI about this property
Review the available facts, identify missing information and prepare questions for the agent.
Investment Insights
Based on property information with market context.
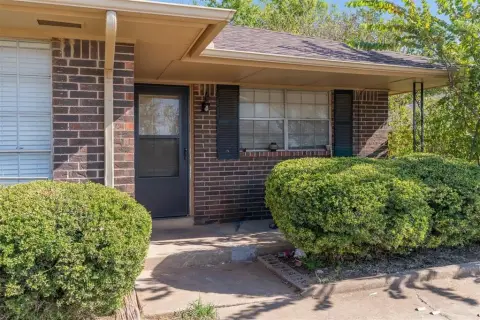
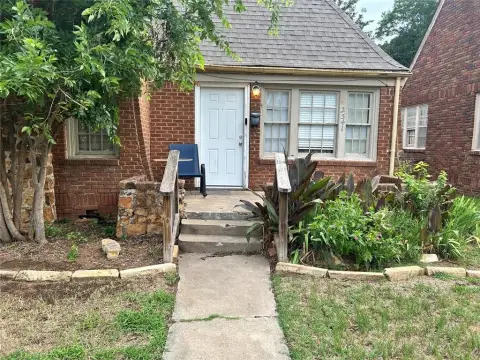
This 1,776-square-foot duplex, built in 1920, contains two matching residences with two bedrooms and one renovated bathroom per unit. Restored original hardwood floors bring period character, while updated kitchens include granite countertops and newer appliances. Both sides also have washer and dryer hookups, supporting practical day-to-day living. A detached garage and front parking for two vehicles provide off-street parking.
The property is positioned in Oklahoma City’s urban core, less than a mile west of the Plaza District. Restaurants, bars, shopping, and entertainment are located nearby. One unit is leased through March 2027, while the other lease ends July 31st, creating different occupancy timelines within the duplex. Tenants pay all utilities.
The property is positioned in Oklahoma City’s urban core, less than a mile west of the Plaza District. Restaurants, bars, shopping, and entertainment are located nearby. One unit is leased through March 2027, while the other lease ends July 31st, creating different occupancy timelines within the duplex. Tenants pay all utilities.
Key Highlights
- Two‑unit duplex with 1,776 SF of living area, built in 1920
- Both residences offer two bedrooms, one renovated bathroom, and matching layouts
- Updated kitchens feature granite countertops and newer appliances
Financial Insights
Estimated NOI and Cap Rate
NOI / Yr
$16,213
Cap Rate
6.01%
Suggested Prices Based on Cap Rates
Cap Rate 5%
$324,260
$324.3K
Cap Rate 7%
$231,614
$231.6K
Cap Rate 9%
$180,144
$180.1K
Market Conditions
NOI Build-Up for 1,776 SF
Gross rent
$24.5K $13.80/SF
− Vacancy
−$1.3K −$0.76/SF
EGI
$23.2K $13.04/SF
− OpEx
−$6.9K −$3.91/SF
NOI
$16.2K $9.13/SF
Area
Oklahoma City, OK
Vacancy
5.50%
Lease Rate
$13.80 /SF/Yr
Expense Ratio
30.00%
Simulate Cap Rate and NOI
Suggested Prices Based on Cap Rates
Cap Rate 5%
$324,260
Cap Rate 7%
$231,614
Cap Rate 9%
$180,144
Alternative Uses
Best Use
Multifamily LT 5
$231.6K
$202.7K – $270.2K
NOI $16,213 @ 7.0% cap · market cap 6.01%
Second Best
Apartment 5plus
$214.3K
$187.5K – $250.0K
NOI $15,001 @ 7.0% cap · market cap 5.56%
Theoretical Best
Specialty Retail
$607.4K
$531.5K – $708.6K
NOI $42,517 @ 7.0% cap · market cap 15.75%
Zoning and permitted uses should be independently verified with authorities.
How Realmo checks its estimates
Property Analytics
Unlock full access to Insights
Subscribe to Realmo Intelligence
Open Analytics
Current Use
Location Intelligence
Trade Area within ½ mile
541
Businesses Nearby
Explore this area
Business Placement
Demographics for 73107, OK
26,318
Population
12,621
Households
2.1
Avg Household Size
34
Median Age
31%
College-Educated
80%
High-School Grad
7.6 sq mi
ZIP Area
3,463
Density / Sq Mi
$58,428
Median Household Income
$38,753
Median Earnings
$1,014
Median Rent
$143,000
Median Home Value
Check the figures for this property
Cap Rate, Value Estimation, Potential NOI and more
View Realmo Analytics
Market
Vacancy Rate% for Multifamily in South region



Frequently Asked Questions
What type of property is this?
Duplex - Two mirrored residences pair original character with renovated kitchens, bathrooms, and convenient laundry hookups.
Where is this duplex located?
The property is located at 2436 NW 16th St Oklahoma City, OK.
What is the asking price?
The asking price for this property is $269,990.
What are key features of this property?
This property features: Two‑unit duplex with 1,776 SF of living area, built in 1920; Both residences offer two bedrooms, one renovated bathroom, and matching layouts; Updated kitchens feature granite countertops and newer appliances