Freestanding Medical Office
For Sale
$495,000
11151 SPRING HILL DR, Spring Hill, FL 34609
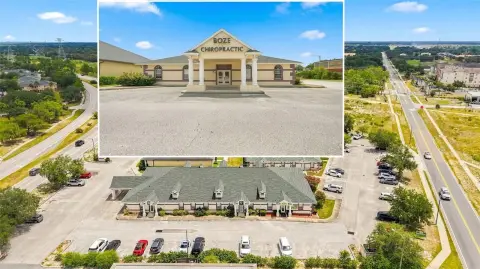
Zoned for medical office use with frontage and signage visibility along Spring Hill Dr.
Property Size1,943 SF
Days on Market134
Property Features for 11151 SPRING HILL DR
General Information
Standard status
Active
Size
1,943 SF
Property subtype
Office
Taxes and HOA fees
Annual Taxes
$3,722
Building Details
Building Size
1,943 SF
Year Built
1984
Listing Agency:
CHARLES RUTENBERG REALTY INC
Listed By:
Caroline Hanna · License #3177435
(727) 667-8377
Source:
Kingofrealestate
Added: May 28
Changed: Sep 27
Last Checked: Oct 7 at 4:53PM
Displayed information is deemed reliable but is not guaranteed and should be independently verified. All listing content including descriptions, pricing, images are the copyrighted material of CHARLES RUTENBERG REALTY INC
Investment Insights
Based on property information with market context.
This freestanding medical office building is positioned along Spring Hill Dr in Spring Hill, Florida, with frontage, signage visibility, and convenient access for patients and staff. The property is zoned specifically for medical office use and may also accommodate conversion to retail space, according to the stated property information.
The 1984-built building is located within a residential and commercial corridor and is surrounded by CVS, Walgreens, and Winn-Dixie. Its placement along one of Spring Hill’s primary thoroughfares provides neighborhood access and exposure to the surrounding commercial area.
The 1984-built building is located within a residential and commercial corridor and is surrounded by CVS, Walgreens, and Winn-Dixie. Its placement along one of Spring Hill’s primary thoroughfares provides neighborhood access and exposure to the surrounding commercial area.
Key Highlights
- Freestanding medical office building built in 1984
- Zoned specifically for medical office use
- Frontage and signage visibility along Spring Hill Dr
Financial Insights
Estimated NOI and Cap Rate
NOI / Yr
$28,497
Cap Rate
5.76%
Suggested Prices Based on Cap Rates
Cap Rate 5%
$569,940
$569.9K
Cap Rate 7%
$407,100
$407.1K
Cap Rate 9%
$316,633
$316.6K
Market Conditions
NOI Build-Up for 1,943 SF
Gross rent
$49.0K $25.20/SF
− Vacancy
−$11.0K −$5.64/SF
EGI
$38.0K $19.56/SF
− OpEx
−$9.5K −$4.89/SF
NOI
$28.5K $14.67/SF
Area
Spring Hill, FL
Vacancy
22.40%
Lease Rate
$25.20 /SF/Yr
Expense Ratio
25.00%
Simulate Cap Rate and NOI
Suggested Prices Based on Cap Rates
Cap Rate 5%
$569,940
Cap Rate 7%
$407,100
Cap Rate 9%
$316,633
Alternative Uses
Best Use
Office B
$407.1K
$356.2K – $475.0K
NOI $28,497 @ 7.0% cap · market cap 5.76%
Second Best
Healthcare Medical
$357.7K
$313.0K – $417.4K
NOI $25,041 @ 7.0% cap · market cap 5.06%
Theoretical Best
Office A
$621.2K
$543.6K – $724.8K
NOI $43,485 @ 7.0% cap · market cap 8.78%
Zoning and permitted uses should be independently verified with authorities.
Property Analytics
Unlock full access to Insights
Subscribe to Realmo Intelligence
Open Analytics
Current Use
Location Intelligence
Trade Area within ½ mile
608
Businesses Nearby
Under-served
Demand for This Use
Explore this area
Business Placement
Demographics for 34609, FL
43,997
Population
18,426
Households
2.4
Avg Household Size
46
Median Age
22%
College-Educated
91%
High-School Grad
22.2 sq mi
ZIP Area
1,982
Density / Sq Mi
$79,284
Median Household Income
$40,789
Median Earnings
$1,593
Median Rent
$275,900
Median Home Value
Check the figures for this property
Cap Rate, Value Estimation, Potential NOI and more
View Realmo Analytics
Market
Vacancy Rate% for Office in South region

Questions? Ask Rey
Realmo’s AI knows this listing — price, zoning, demand, history. Ask anything.






Frequently Asked Questions
What type of property is this?
Medical Office Space - Zoned for medical office use with frontage and signage visibility along Spring Hill Dr.
Where is this medical office space located?
The property is located at 11151 SPRING HILL DR Spring Hill, FL.
What is the asking price?
The asking price for this property is $495,000.
What are key features of this property?
This property features: Freestanding medical office building built in 1984; Zoned specifically for medical office use; Frontage and signage visibility along Spring Hill Dr