Downtown Tavares Mixed-Use Investment
For Sale
$499,000
107 W MAIN STREET, Tavares, FL 32778
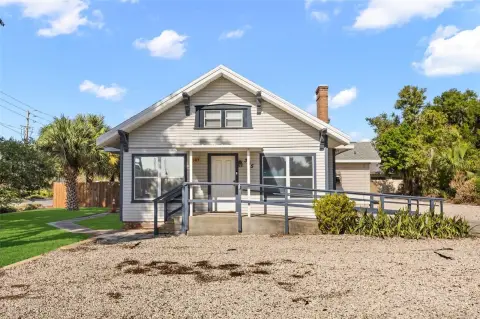
Two-unit mixed-use building in historic downtown Tavares, fully occupied.
Property Size1,662 SF
Lot Size0.05 Acres
Price / SF$300.24
Days on Market403
Property Features for 107 W MAIN STREET
General Information
Standard status
Active
Size
1,662 SF
Lot size
0.05 Acres
Property subtype
Commercial
Taxes and HOA fees
Annual Taxes
$3,540
Amenities
Central air
Pool
Public Pool
Central Air Cooling
Shingle Roof
Building Details
Year Built
1918
Listing Agency:
GRIZZARD COMMERCIAL REALESTATE
(352) 787-6966
Listed By:
DANIEL TATRO · License #3190991
(352) 396-9136
Source:
Corcoran
Added: Aug 31, 2025
Changed: Oct 6
Last Checked: Oct 5 at 7:04PM
Displayed information is deemed reliable but is not guaranteed and should be independently verified. All listing content including descriptions, pricing, images are the copyrighted material of GRIZZARD COMMERCIAL REALESTATE
Investment Insights
Based on property information with market context.
This mixed-use property is located in historic downtown Tavares, the county seat for Lake County. The building is fully occupied with two tenants. The upstairs unit is a renovated two-bedroom, one-and-a-half-bathroom apartment featuring a newly renovated deck and patio with a view of Lake Dora. The downstairs unit is occupied by an established hair salon. Renovations include new windows, appliances, paint, and flooring, as well as a completely new kitchen in the upstairs apartment. Both units have new HVAC units as of 2024. The property offers an investment opportunity with income potential.
Key Highlights
- Income‑generating investment property with 100% occupancy.
- Prime location in historic downtown Tavares.
- Renovated 2 BR / 1.5 BA apartment with lake views and a newly renovated deck/patio.
Financial Insights
Estimated NOI and Cap Rate
NOI / Yr
$21,938
Cap Rate
4.40%
Suggested Prices Based on Cap Rates
Cap Rate 5%
$438,760
$438.8K
Cap Rate 7%
$313,400
$313.4K
Cap Rate 9%
$243,756
$243.8K
Market Conditions
NOI Build-Up for 1,662 SF
Gross rent
$39.9K $24.00/SF
− Vacancy
−$4.8K −$2.88/SF
EGI
$35.1K $21.12/SF
− OpEx
−$13.2K −$7.92/SF
NOI
$21.9K $13.20/SF
Area
Lake County, FL
Vacancy
12.00%
Lease Rate
$24.00 /SF/Yr
Expense Ratio
37.50%
Simulate Cap Rate and NOI
Suggested Prices Based on Cap Rates
Cap Rate 5%
$438,760
Cap Rate 7%
$313,400
Cap Rate 9%
$243,756
Alternative Uses
Best Use
Mixed Use
$313.4K
$274.2K – $365.6K
NOI $21,938 @ 7.0% cap · market cap 4.40%
Second Best
Apartment 5plus
$291.6K
$255.1K – $340.2K
NOI $20,410 @ 7.0% cap · market cap 4.09%
Theoretical Best
Office A
$473.0K
$413.8K – $551.8K
NOI $33,107 @ 7.0% cap · market cap 6.63%
Zoning and permitted uses should be independently verified with authorities.
Property Analytics
Unlock full access to Insights
Subscribe to Realmo Intelligence
Open Analytics
Current Use
Location Intelligence
Trade Area within ½ mile
761
Businesses Nearby
Explore this area
Business Placement
Demographics for 32778, FL
23,993
Population
12,720
Households
1.9
Avg Household Size
52
Median Age
25%
College-Educated
88%
High-School Grad
25.4 sq mi
ZIP Area
945
Density / Sq Mi
$61,815
Median Household Income
$40,942
Median Earnings
$1,384
Median Rent
$241,500
Median Home Value
Check the figures for this property
Cap Rate, Value Estimation, Potential NOI and more
View Realmo Analytics
Market
Vacancy Rate% for Multifamily in South region

Questions? Ask Rey
Realmo’s AI knows this listing — price, zoning, demand, history. Ask anything.


Frequently Asked Questions
What type of property is this?
Mixed-use property - Two-unit mixed-use building in historic downtown Tavares, fully occupied.
Where is this mixed-use property located?
The property is located at 107 W MAIN STREET Tavares, FL.
What is the asking price?
The asking price for this property is $499,000.
What are key features of this property?
This property features: Income‑generating investment property with 100% occupancy.; Prime location in historic downtown Tavares.; Renovated 2 BR / 1.5 BA apartment with lake views and a newly renovated deck/patio.


