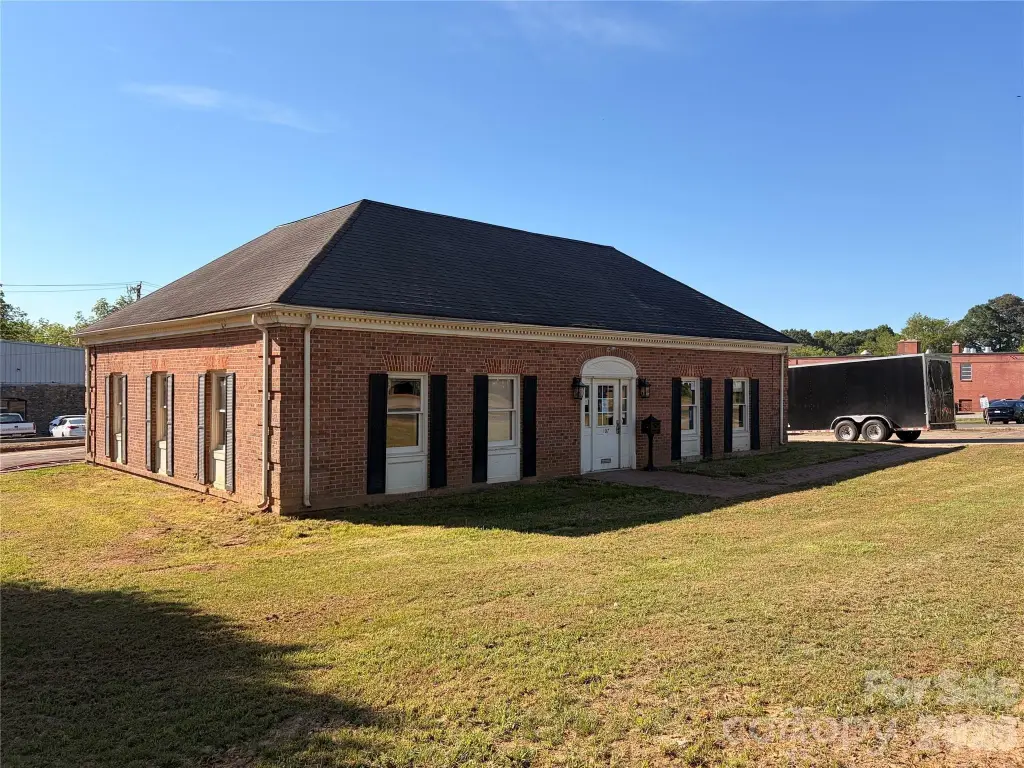
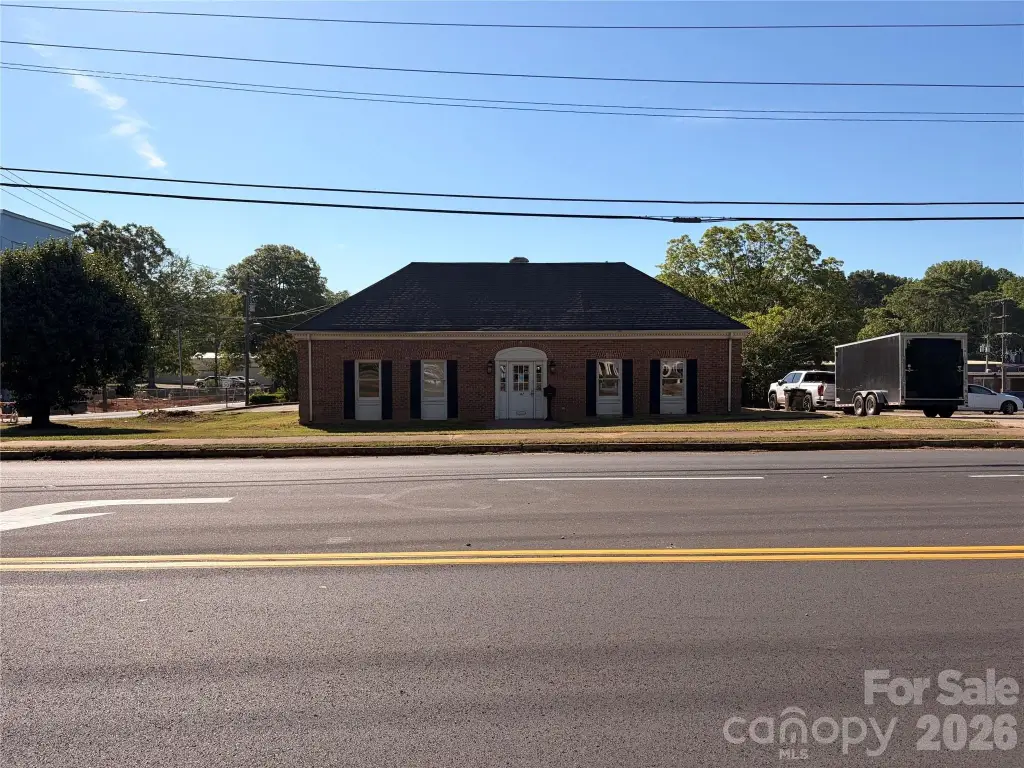
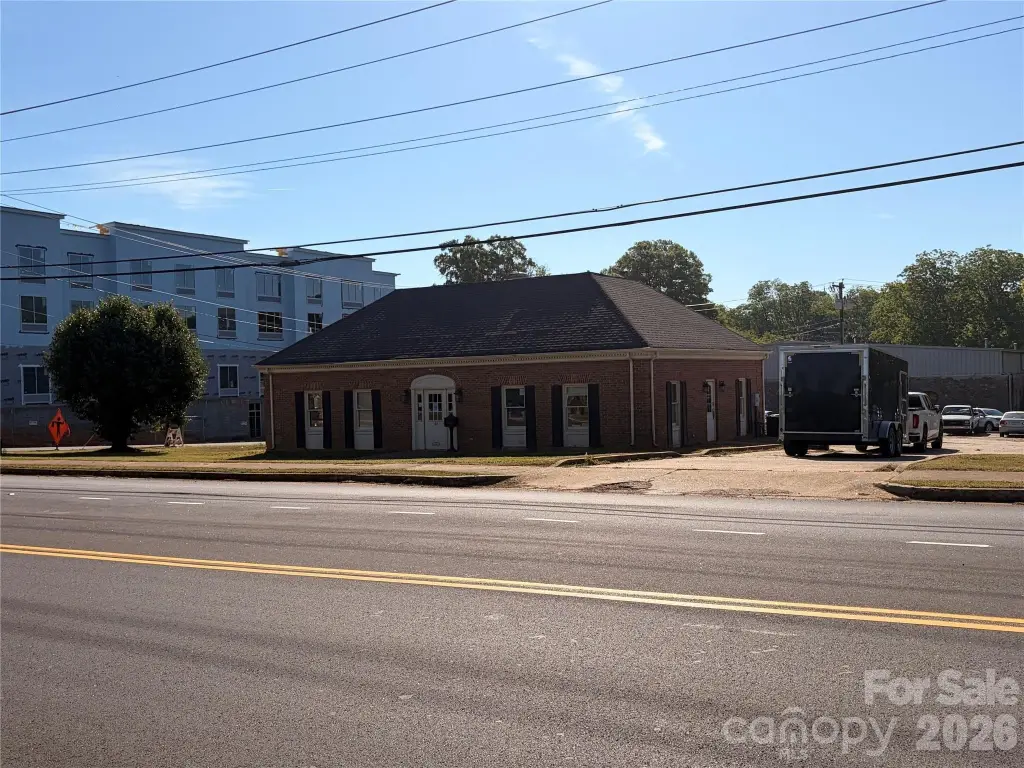
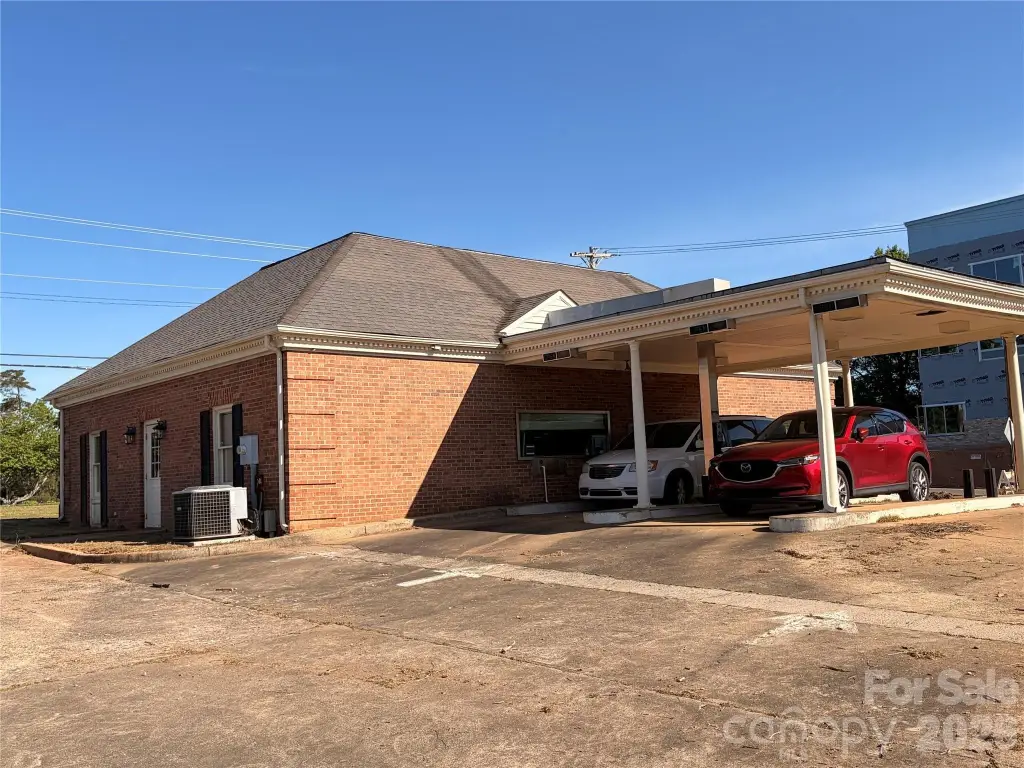
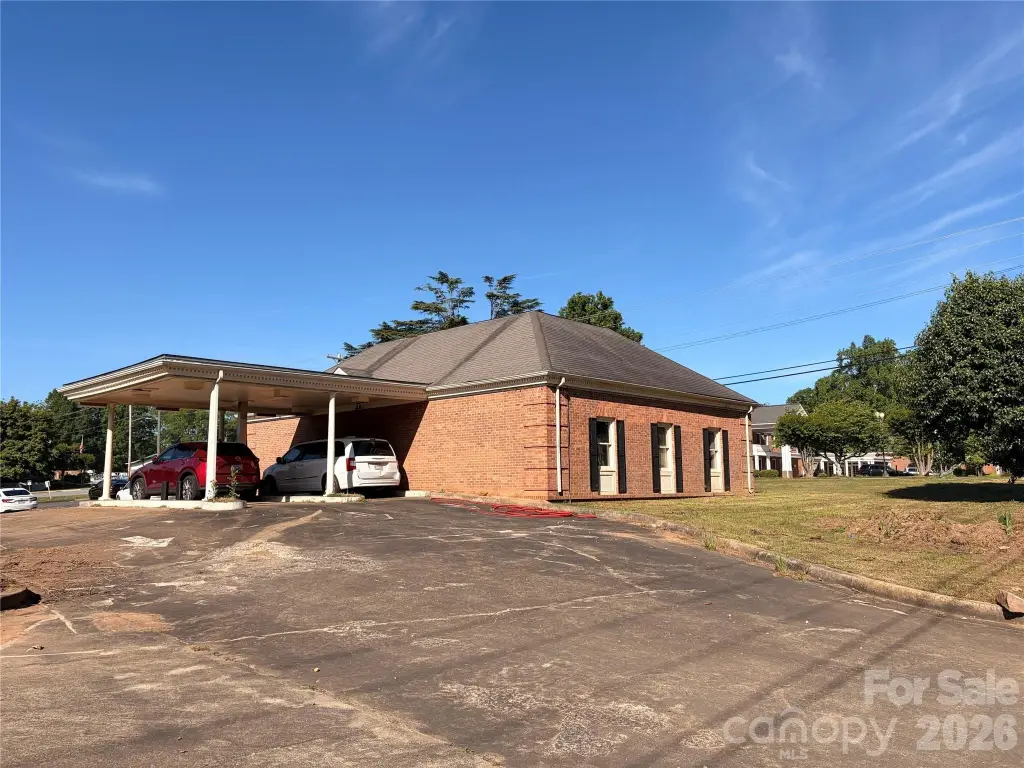
Brick Office Building with Bank
For Sale
$675,000
107 Congress Street S, York, SC 29745
Commercial Sale, York, SC
Property Size1,800 SF
Lot Size0.64 Acres
Price / SF$375
Days on Market156
Property Features for 107 Congress Street S
General Information
Property type
Commercial Sale
Property subtype
Other
Zoning description
GI
Directions
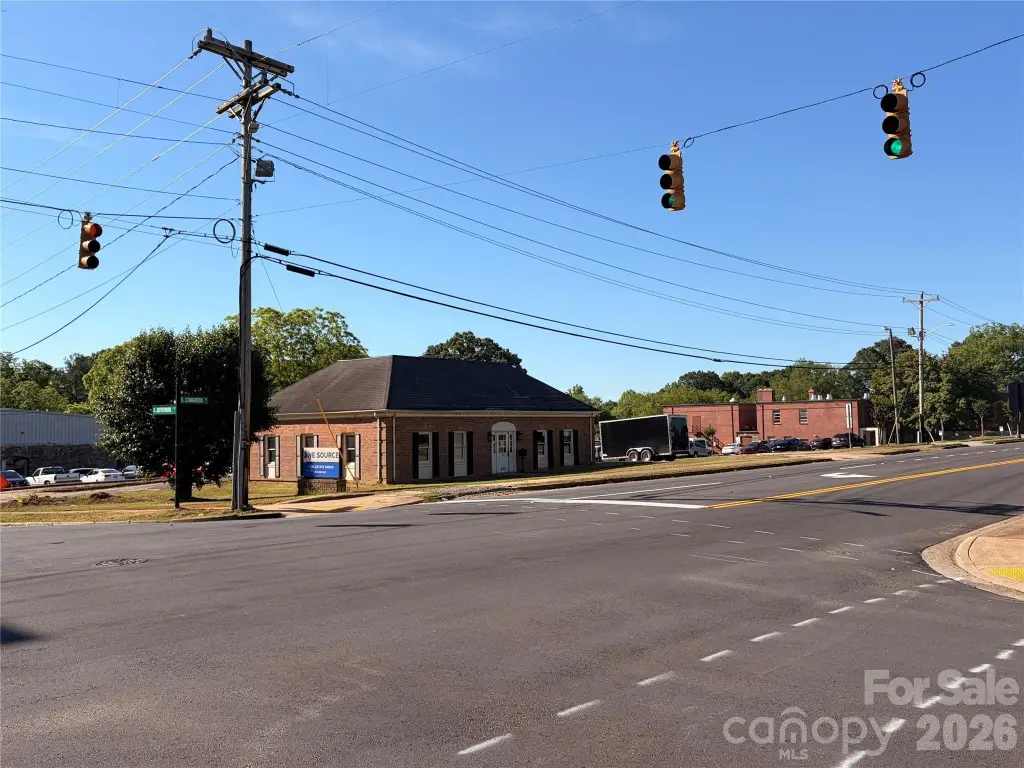
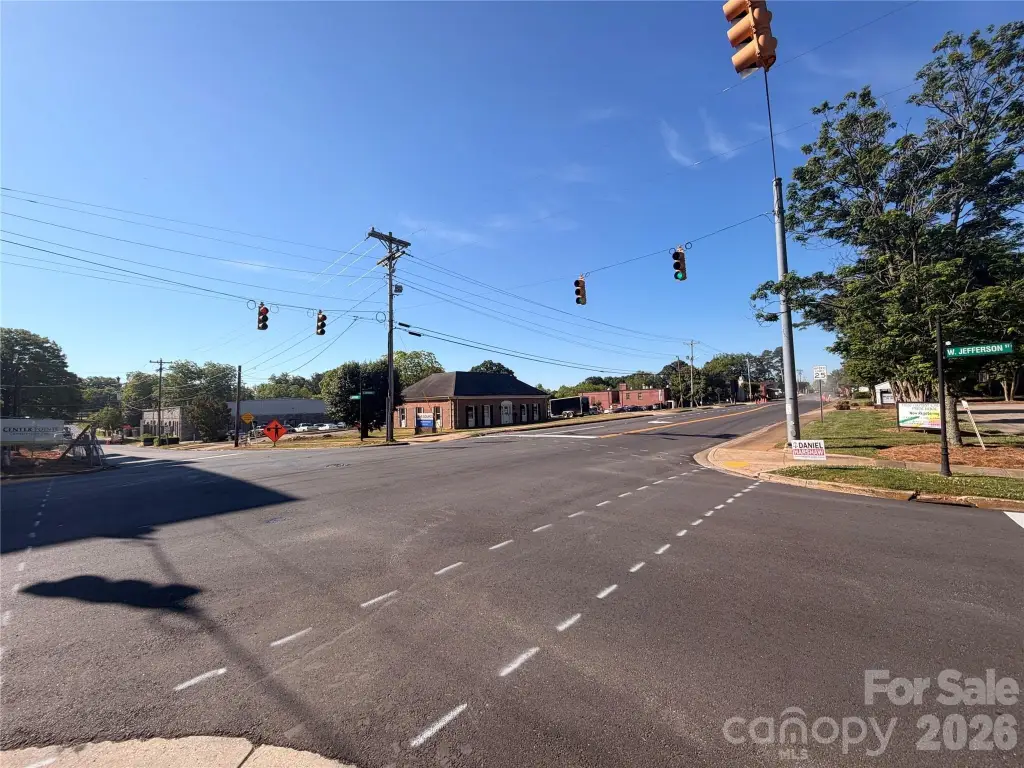
Next to the new hotel in downtown York SC
Standard status
Active
APN
070-10-06-006
Lot size
0.64 Acres
Taxes and HOA fees
Tax Description
S CONGRESS ZENS BANK) NEAR COURT HOUSE
Legal Description
S CONGRESS ZENS BANK) NEAR COURT HOUSE
Building Details
Year built
1979
Listing Agency:
1 Source Property Management
(803) 250-1062
Listed By:
Christopher Newbern
(803) 866-9063
Added: May 4
Changed: Aug 19
Last Checked: Oct 6 at 12:06AM
MLS# 4377710
Copyright © 2026 Canopy MLS. All rights reserved. All information provided by the listing agent/broker is deemed reliable but is not guaranteed and should be independently verified.
Investment Insights
Based on property information with market context.
This brick office building in downtown York, South Carolina, offers a flexible arrangement for professional office use. The interior includes an open reception and lobby area, several private offices, a kitchenette, private restrooms, and an original bank vault. The building was constructed in 1979 and sits on 0.64 acres.
Located at 107 Congress Street S, the property is positioned near local amenities and the York County Courthouse. Its central York setting and adaptable interior support uses including law, insurance, real estate, and counseling offices. The combination of private rooms, shared reception space, and specialized vault construction provides a distinctive configuration for an owner-user or office operator.
Located at 107 Congress Street S, the property is positioned near local amenities and the York County Courthouse. Its central York setting and adaptable interior support uses including law, insurance, real estate, and counseling offices. The combination of private rooms, shared reception space, and specialized vault construction provides a distinctive configuration for an owner-user or office operator.
Key Highlights
- 0.64‑acre office property in downtown York, SC
- Brick office building constructed in 1979
- Original bank vault remains in the building
Financial Insights
Estimated NOI and Cap Rate
NOI / Yr
$23,983
Cap Rate
3.55%
Suggested Prices Based on Cap Rates
Cap Rate 5%
$479,660
$479.7K
Cap Rate 7%
$342,614
$342.6K
Cap Rate 9%
$266,478
$266.5K
Market Conditions
NOI Build-Up for 1,800 SF
Gross rent
$34.1K $18.96/SF
− Vacancy
−$2.2K −$1.19/SF
EGI
$32.0K $17.77/SF
− OpEx
−$8.0K −$4.44/SF
NOI
$24.0K $13.32/SF
Area
York County, SC
Vacancy
6.30%
Lease Rate
$18.96 /SF/Yr
Expense Ratio
25.00%
Simulate Cap Rate and NOI
Suggested Prices Based on Cap Rates
Cap Rate 5%
$479,660
Cap Rate 7%
$342,614
Cap Rate 9%
$266,478
Alternative Uses
Best Use
Office B
$342.6K
$299.8K – $399.7K
NOI $23,983 @ 7.0% cap · market cap 3.55%
Second Best
—
—
no second resolved use
Theoretical Best
Office A
$423.3K
$370.4K – $493.8K
NOI $29,630 @ 7.0% cap · market cap 4.39%
Zoning and permitted uses should be independently verified with authorities.
Property Analytics
Unlock full access to Insights
Subscribe to Realmo Intelligence
Open Analytics
Current Use
Location Intelligence
Trade Area within ½ mile
474
Businesses Nearby
Explore this area
Business Placement
Demographics for 29745, SC
32,602
Population
13,765
Households
2.4
Avg Household Size
41
Median Age
21%
College-Educated
87%
High-School Grad
135.8 sq mi
ZIP Area
240
Density / Sq Mi
$75,665
Median Household Income
$42,676
Median Earnings
$961
Median Rent
$242,200
Median Home Value
Check the figures for this property
Cap Rate, Value Estimation, Potential NOI and more
View Realmo Analytics
Market
Vacancy Rate% for Office in South region

Questions? Ask Rey
Realmo’s AI knows this listing — price, zoning, demand, history. Ask anything.


Frequently Asked Questions
What type of property is this?
Office building - Downtown York property with private offices, reception space, and a kitchenette.
Where is this office building located?
The property is located at 107 Congress Street S York, SC.
What is the asking price?
The asking price for this property is $675,000.
What are key features of this property?
This property features: 0.64‑acre office property in downtown York, SC; Brick office building constructed in 1979; Original bank vault remains in the building


