Downtown Foley Commercial
For Sale
$650,000
Pending
106 W Myrtle Avenue AVE, Foley, AL 36535
Prime commercial property in downtown Foley, offering diverse possibilities.
Property Size4,351 SF
Days on Market142
Property Features for 106 W Myrtle Avenue AVE
General Information
Standard status
Pending
Size
4,351 SF
Property subtype
Commercial/Industrial
Taxes and HOA fees
Annual Taxes
$3,015
Building Details
Year Built
1935
Listing Agency:
RE/MAX on the Coast
(251) 980-2000
Listed By:
Dusty Cole · License #103880-1
(251) 213-8504
Source:
Exitrealty
Added: May 21
Changed: Sep 10
Last Checked: Sep 15 at 4:47AM
Displayed information is deemed reliable but is not guaranteed and should be independently verified. All listing content including descriptions, pricing, images are the copyrighted material of RE/MAX on the Coast
Investment Insights
Based on property information with market context.
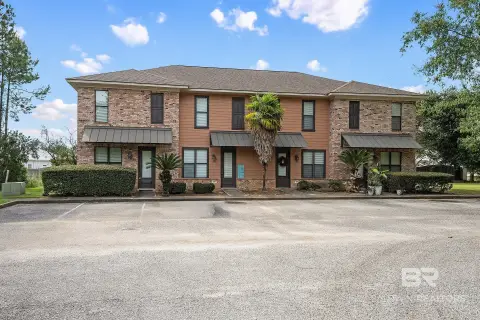
Located in downtown Foley, at the corner of W Myrtle Ave and S Alston St, this commercial property offers a central location with visibility and accessibility in a growing business district. The 4,351-square-foot building, previously used as a medical office, presents an opportunity for investors, developers, or business owners to renovate the existing structure. Zoned B-1 (Central Business District), the property allows for retail, dining, office, service, hospitality, entertainment, and mixed residential/commercial concepts. This downtown location provides possibilities for projects or investments.
Key Highlights
- Prime downtown Foley location at the corner of W Myrtle Ave and S Alston St with excellent visibility and easy access.
- Zoned B‑1 (Central Business District) allowing for retail, dining, office, service, hospitality, entertainment, and mixed residential/commercial uses.
- 4,351‑square‑foot building suitable for renovation and redevelopment.
Financial Insights
Estimated NOI and Cap Rate
NOI / Yr
$52,044
Cap Rate
8.01%
Suggested Prices Based on Cap Rates
Cap Rate 5%
$1,040,880
$1.0M
Cap Rate 7%
$743,486
$743.5K
Cap Rate 9%
$578,267
$578.3K
Market Conditions
NOI Build-Up for 4,351 SF
Gross rent
$96.6K $22.20/SF
− Vacancy
−$9.9K −$2.26/SF
EGI
$86.7K $19.94/SF
− OpEx
−$34.7K −$7.97/SF
NOI
$52.0K $11.96/SF
Area
Baldwin County, AL
Vacancy
10.20%
Lease Rate
$22.20 /SF/Yr
Expense Ratio
40.00%
Simulate Cap Rate and NOI
Suggested Prices Based on Cap Rates
Cap Rate 5%
$1,040,880
Cap Rate 7%
$743,486
Cap Rate 9%
$578,267
Alternative Uses
Best Use
Healthcare Medical
$743.5K
$650.6K – $867.4K
NOI $52,044 @ 7.0% cap · market cap 8.01%
Second Best
Office B
$725.0K
$634.4K – $845.8K
NOI $50,750 @ 7.0% cap · market cap 7.81%
Theoretical Best
Office A
$1.05M
$915.5K – $1.22M
NOI $73,243 @ 7.0% cap · market cap 11.27%
Zoning and permitted uses should be independently verified with authorities.
Property Analytics
Unlock full access to Insights
Subscribe to Realmo Intelligence
Open Analytics
Current Use
Location Intelligence
Trade Area within ½ mile
27
Businesses Nearby
Well-served
Demand for This Use
Explore this area
Business Placement
Demographics for 36535, AL
35,484
Population
18,755
Households
1.9
Avg Household Size
46
Median Age
26%
College-Educated
90%
High-School Grad
92.5 sq mi
ZIP Area
384
Density / Sq Mi
$67,013
Median Household Income
$41,574
Median Earnings
$1,168
Median Rent
$250,800
Median Home Value
Check the figures for this property
Cap Rate, Value Estimation, Potential NOI and more
View Realmo Analytics
Market
Vacancy Rate% for Office in South region

Questions? Ask Rey
Realmo’s AI knows this listing — price, zoning, demand, history. Ask anything.






Frequently Asked Questions
What type of property is this?
Medical Office Space - Prime commercial property in downtown Foley, offering diverse possibilities.
Where is this medical office space located?
The property is located at 106 W Myrtle Avenue AVE Foley, AL.
What is the asking price?
The asking price for this property is $650,000.
What are key features of this property?
This property features: Prime downtown Foley location at the corner of W Myrtle Ave and S Alston St with excellent visibility and easy access.; Zoned B‑1 (Central Business District) allowing for retail, dining, office, service, hospitality, entertainment, and mixed residential/commercial uses.; 4,351‑square‑foot building suitable for renovation and redevelopment.