Residential Income Property with Golf
For Sale
$279,000
10416 W PRAIRIE HILLS Circle, Sun City, AZ 85351
Two-bedroom residence with an updated kitchen, Arizona room, and permitted rentals.
Property Size1,683 SF
Price / SF$165.78
Days on Market364
Property Features for 10416 W PRAIRIE HILLS Circle
General Information
Standard status
Active
Size
1,683 SF
Property subtype
Multi Family
Additional Details
Multifamily Units
1
Taxes and HOA fees
Annual Taxes
$1,433
Building Details
Year Built
1971
Listing Agency:
West USA Realty
(602) 942-4200
Listed By:
Jami L Tadda · License #SA545526000
(602) 321-4959
Source:
Exitrealty
Added: Oct 17, 2025
Changed: Sep 2
Last Checked: Sep 15 at 5:13AM
Displayed information is deemed reliable but is not guaranteed and should be independently verified. All listing content including descriptions, pricing, images are the copyrighted material of West USA Realty

Ask AI about this property
Review the available facts, identify missing information and prepare questions for the agent.
Investment Insights
Based on property information with market context.
This 1,683-square-foot D35 model, built in 1971, is configured with two bedrooms and two bathrooms. Interior improvements include premium kitchen cabinetry, granite countertops, and stainless-steel appliances. An Arizona room extends the living area, while the primary suite and main living spaces overlook the 16th hole at Lakes East. The property has no solar equipment, and rentals are allowed.
The home is located near Sundial Recreation Center, shopping, and dining, with Arrowhead and the P83 Entertainment District a short drive away. Its golf-course outlook, established residential setting, and permitted rental use provide a combination of personal-use and income-property functionality.
The home is located near Sundial Recreation Center, shopping, and dining, with Arrowhead and the P83 Entertainment District a short drive away. Its golf-course outlook, established residential setting, and permitted rental use provide a combination of personal-use and income-property functionality.
Key Highlights
- 1,683 SF D35 model built in 1971
- Two bedrooms and two bathrooms
- Updated kitchen with premium cabinetry, granite counters, and stainless‑steel appliances
Financial Insights
Estimated NOI and Cap Rate
NOI / Yr
$18,994
Cap Rate
6.81%
Suggested Prices Based on Cap Rates
Cap Rate 5%
$379,880
$379.9K
Cap Rate 7%
$271,343
$271.3K
Cap Rate 9%
$211,044
$211.0K
Market Conditions
NOI Build-Up for 1,683 SF
Gross rent
$36.4K $21.60/SF
− Vacancy
−$1.8K −$1.08/SF
EGI
$34.5K $20.52/SF
− OpEx
−$15.5K −$9.23/SF
NOI
$19.0K $11.29/SF
Area
Maricopa County, AZ
Vacancy
5.00%
Lease Rate
$21.60 /SF/Yr
Expense Ratio
45.00%
Simulate Cap Rate and NOI
Suggested Prices Based on Cap Rates
Cap Rate 5%
$379,880
Cap Rate 7%
$271,343
Cap Rate 9%
$211,044
Alternative Uses
Best Use
Apartment 5plus
$271.3K
$237.4K – $316.6K
NOI $18,994 @ 7.0% cap · market cap 6.81%
Second Best
—
—
no second resolved use
Theoretical Best
Office A
$520.6K
$455.5K – $607.4K
NOI $36,442 @ 7.0% cap · market cap 13.06%
Zoning and permitted uses should be independently verified with authorities.
How Realmo checks its estimates
Property Analytics
Current Use
Lease Details
1
Residential units
Location Intelligence
Trade Area within ½ mile
184
Businesses Nearby
Explore this area
Business Placement
Demographics for 85351, AZ
29,795
Population
20,414
Households
1.5
Avg Household Size
73
Median Age
24%
College-Educated
93%
High-School Grad
10.9 sq mi
ZIP Area
2,733
Density / Sq Mi
$50,812
Median Household Income
$29,786
Median Earnings
$1,477
Median Rent
$250,300
Median Home Value




Frequently Asked Questions
What type of property is this?
Residential income property - Two-bedroom residence with an updated kitchen, Arizona room, and permitted rentals.
Where is this residential income property located?
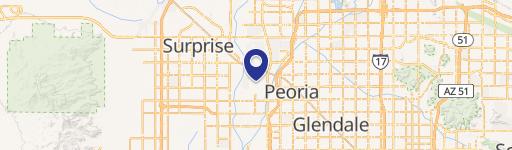
The property is located at 10416 W PRAIRIE HILLS Circle Sun City, AZ.
What is the asking price?
The asking price for this property is $279,000.
What are key features of this property?
This property features: 1,683 SF D35 model built in 1971; Two bedrooms and two bathrooms; Updated kitchen with premium cabinetry, granite counters, and stainless‑steel appliances