Historic Mixed-Use Event
For Sale
$599,000
104 & 105 N 13th St, Van Buren, AR 72956
Two adjacent downtown parcels combine an operating event venue with two short-term rental projects at different stages of completion.
Property Size5,774 SF
Price / SF$103.74
Days on Market54
Property Features for 104 & 105 N 13th St
General Information
Standard status
Active
Size
5,774 SF
Financials
Asking Price
$599,000
Business Included
Yes
Additional Details
Multifamily Units
2
Building Details
Year Built
1920
Listing Agency:
Keller Williams Platinum Realty
Listed By:
Michelle Pendergraft · License #SA00083314
(479) 439-3000
Source:
Thebesthomeprice
Added: Aug 25
Changed: Oct 16
Last Checked: Oct 7 at 1:12PM
Displayed information is deemed reliable but is not guaranteed and should be independently verified. All listing content including descriptions, pricing, images are the copyrighted material of Keller Williams Platinum Realty

Ask AI about this property
Review the available facts, identify missing information and prepare questions for the agent.
Investment Insights
Based on property information with market context.
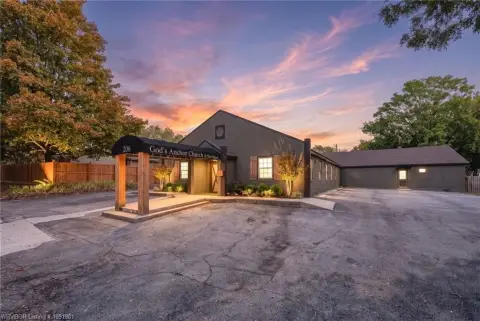
This mixed-use portfolio includes two adjacent parcels in Van Buren’s historic downtown. The primary improvement is a two-level event venue measuring 4,550 square feet, with cathedral ceilings, an original wood balcony, hardwood floors, and a kitchen. The building occupies a historic former church structure with a cornerstone dating to 1912 and dedication in 1913.
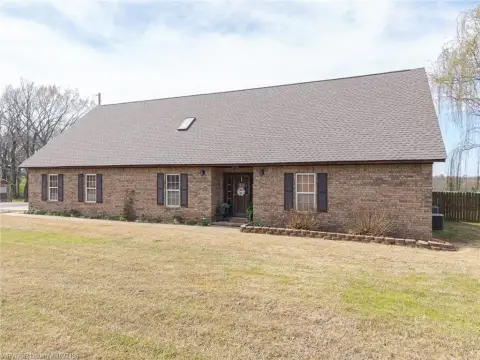
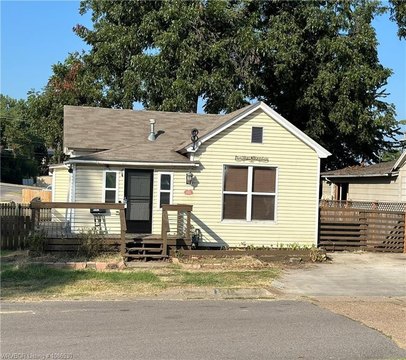
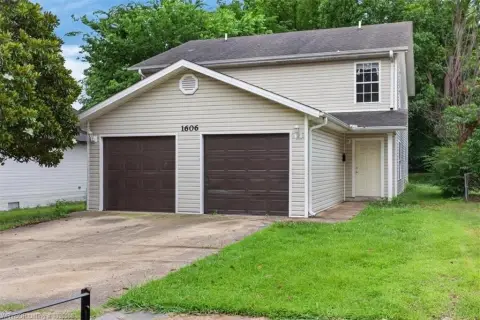
A studio apartment on the 0.82-acre parcel is undergoing renovation and is positioned as a short-term rental project. The neighboring 0.54-acre parcel contains an 1887 Victorian home currently used as a residence. Its unfinished primary-suite addition is intended to bring the home to 2,397 square feet, and the property also includes a walkout basement, attached garage, and corner-lot setting.
Short-term rental use is permitted in both applicable zoning areas. The portfolio is located at 104 and 105 N 13th Street in Van Buren, with the historic district, a Dardanelle & Russellville Railroad excursion train, and access to the Fort Smith MSA identified in the property information.
A studio apartment on the 0.82-acre parcel is undergoing renovation and is positioned as a short-term rental project. The neighboring 0.54-acre parcel contains an 1887 Victorian home currently used as a residence. Its unfinished primary-suite addition is intended to bring the home to 2,397 square feet, and the property also includes a walkout basement, attached garage, and corner-lot setting.
Short-term rental use is permitted in both applicable zoning areas. The portfolio is located at 104 and 105 N 13th Street in Van Buren, with the historic district, a Dardanelle & Russellville Railroad excursion train, and access to the Fort Smith MSA identified in the property information.
Key Highlights
- Operating event venue in a former church structure with a cornerstone dating to 1912 and dedication in 1913
- Two‑floor, 4,550‑square‑foot venue with cathedral ceilings, hardwood floors, original wood balcony, and kitchen
- 0.82‑acre parcel includes a studio apartment with renovations underway
Financial Insights
Estimated NOI and Cap Rate
NOI / Yr
$50,234
Cap Rate
8.39%
Suggested Prices Based on Cap Rates
Cap Rate 5%
$1,004,680
$1.0M
Cap Rate 7%
$717,629
$717.6K
Cap Rate 9%
$558,156
$558.2K
Market Conditions
NOI Build-Up for 5,774 SF
Gross rent
$86.6K $15.00/SF
− Vacancy
−$6.2K −$1.08/SF
EGI
$80.4K $13.92/SF
− OpEx
−$30.1K −$5.22/SF
NOI
$50.2K $8.70/SF
Area
Crawford County, AR
Vacancy
7.20%
Lease Rate
$15.00 /SF/Yr
Expense Ratio
37.50%
Simulate Cap Rate and NOI
Suggested Prices Based on Cap Rates
Cap Rate 5%
$1,004,680
Cap Rate 7%
$717,629
Cap Rate 9%
$558,156
Alternative Uses
Best Use
Mixed Use
$717.6K
$627.9K – $837.2K
NOI $50,234 @ 7.0% cap · market cap 8.39%
Second Best
Apartment 5plus
$507.4K
$444.0K – $592.0K
NOI $35,517 @ 7.0% cap · market cap 5.93%
Theoretical Best
Office A
$1.11M
$968.7K – $1.29M
NOI $77,492 @ 7.0% cap · market cap 12.94%
Zoning and permitted uses should be independently verified with authorities.
How Realmo checks its estimates
Property Analytics
Unlock full access to Insights
Subscribe to Realmo Intelligence
Open Analytics
Current Use
Lease Details
2
Residential units
Turnkey business
Opportunity
Location Intelligence
Trade Area within ½ mile
686
Businesses Nearby
Explore this area
Business Placement
Demographics for 72956, AR
33,870
Population
14,119
Households
2.4
Avg Household Size
39
Median Age
19%
College-Educated
87%
High-School Grad
103.8 sq mi
ZIP Area
326
Density / Sq Mi
$60,387
Median Household Income
$33,894
Median Earnings
$825
Median Rent
$177,100
Median Home Value
Check the figures for this property
Cap Rate, Value Estimation, Potential NOI and more
View Realmo Analytics
Market
Vacancy Rate% for Multifamily in South region






Frequently Asked Questions
What type of property is this?
Mixed-use property - Two adjacent downtown parcels combine an operating event venue with two short-term rental projects at different stages of completion.
Where is this mixed-use property located?
The property is located at 104 & 105 N 13th St Van Buren, AR.
What is the asking price?
The asking price for this property is $599,000.
What are key features of this property?
This property features: Operating event venue in a former church structure with a cornerstone dating to 1912 and dedication in 1913; Two‑floor, 4,550‑square‑foot venue with cathedral ceilings, hardwood floors, original wood balcony, and kitchen; 0.82‑acre parcel includes a studio apartment with renovations underway


