Two-Family Residential Income
For Sale
$680,000
103 Dalton Street, Lowell, MA 01850
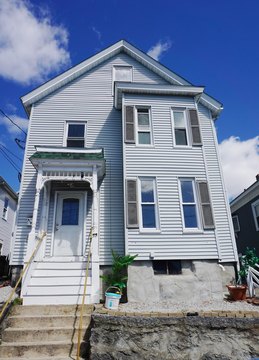
Oversized two-family home near UMASS Lowell with separate utilities, hardwood floors, and a large fenced yard.
Property Size3,497 SF
Price / SF$194.45
Days on Market116
Property Features for 103 Dalton Street
General Information
Standard status
Active
Size
3,497 SF
Property subtype
Multi-Family
Zoning
TTF
Net Operating Income
$12,000
Taxes and HOA fees
Annual Taxes
$7,845
Building Details
Building Size
3,497 SF
Year Built
1920
Stories
3
Listing Agency:
RE/MAX Partners
(978) 475-2100
Listed By:
James Pham · License #9570577
(617) 991-4607
Source:
Churchillprop
Added: Jun 18
Changed: Oct 6
Last Checked: Oct 11 at 4:39AM
Displayed information is deemed reliable but is not guaranteed and should be independently verified. All listing content including descriptions, pricing, images are the copyrighted material of RE/MAX Partners
Investment Insights
Based on property information with market context.
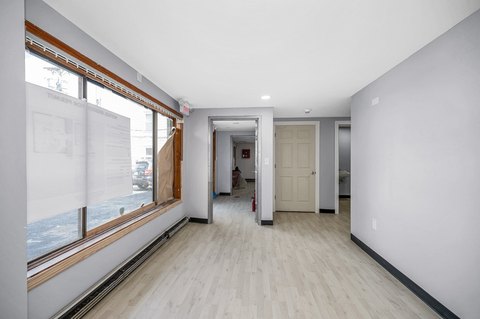
This well-cared-for two-family property offers approximately 3,500 square feet of living space with separate utilities and hardwood floors throughout. The home is configured as two distinct units with separate living arrangements. Unit 1 is set up for two-level living with three bedrooms and 1.5 bathrooms and will be delivered vacant. Unit 2 offers two bedrooms plus a potential third bedroom or office, and it is currently occupied on a month-to-month basis.
The property is located in Lowell near UMASS Lowell and the scenic Merrimack River. WalkScore is listed as 98, indicating a highly walkable setting, and transitScore is listed as 60, indicating good transit. bikeScore is listed as 49, indicating some bikeability.
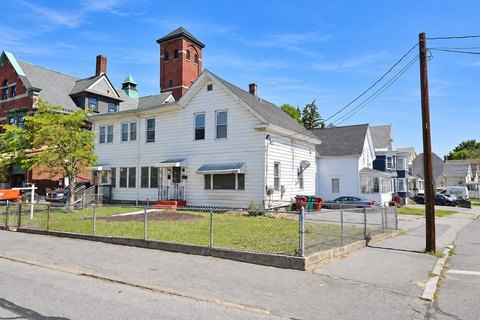
This format should appeal to buyers looking for an owner-occupant option alongside rental income, given Unit 1’s planned vacancy and Unit 2’s existing configuration. Investors may also find the separate utilities and two-level layout useful for tenant separation and day-to-day management. The fenced yard provides outdoor space suitable for gardening and general relaxation.
The property is located in Lowell near UMASS Lowell and the scenic Merrimack River. WalkScore is listed as 98, indicating a highly walkable setting, and transitScore is listed as 60, indicating good transit. bikeScore is listed as 49, indicating some bikeability.
This format should appeal to buyers looking for an owner-occupant option alongside rental income, given Unit 1’s planned vacancy and Unit 2’s existing configuration. Investors may also find the separate utilities and two-level layout useful for tenant separation and day-to-day management. The fenced yard provides outdoor space suitable for gardening and general relaxation.
Key Highlights
- Two‑family home with approximately 3,500 SF of living space
- Year built: 1920
- Separate utilities for the two units
Financial Insights
Estimated NOI and Cap Rate
NOI / Yr
$62,381
Cap Rate
9.17%
Suggested Prices Based on Cap Rates
Cap Rate 5%
$1,247,620
$1.2M
Cap Rate 7%
$891,157
$891.2K
Cap Rate 9%
$693,122
$693.1K
Market Conditions
NOI Build-Up for 3,497 SF
Gross rent
$121.7K $34.80/SF
− Vacancy
−$8.3K −$2.37/SF
EGI
$113.4K $32.43/SF
− OpEx
−$51.0K −$14.60/SF
NOI
$62.4K $17.84/SF
Area
Lowell, MA
Vacancy
6.80%
Lease Rate
$34.80 /SF/Yr
Expense Ratio
45.00%
Simulate Cap Rate and NOI
Suggested Prices Based on Cap Rates
Cap Rate 5%
$1,247,620
Cap Rate 7%
$891,157
Cap Rate 9%
$693,122
Alternative Uses
Best Use
Apartment 5plus
$891.2K
$779.8K – $1.04M
NOI $62,381 @ 7.0% cap · market cap 9.17%
Second Best
—
—
no second resolved use
Theoretical Best
Office A
$1.23M
$1.08M – $1.44M
NOI $86,157 @ 7.0% cap · market cap 12.67%
Zoning and permitted uses should be independently verified with authorities.
Property Analytics
Unlock full access to Insights
Subscribe to Realmo Intelligence
Open Analytics
Current Use
Location Intelligence
Trade Area within ½ mile
634
Businesses Nearby
Explore this area
Business Placement
Demographics for 01850, MA
16,670
Population
6,028
Households
2.8
Avg Household Size
34
Median Age
18%
College-Educated
83%
High-School Grad
1.4 sq mi
ZIP Area
11,907
Density / Sq Mi
$67,581
Median Household Income
$42,096
Median Earnings
$1,666
Median Rent
$367,200
Median Home Value
Check the figures for this property
Cap Rate, Value Estimation, Potential NOI and more
View Realmo Analytics
Market
Vacancy Rate% for Multifamily in Northeast region

Questions? Ask Rey
Realmo’s AI knows this listing — price, zoning, demand, history. Ask anything.




Frequently Asked Questions
What type of property is this?
Multifamily property - Oversized two-family home near UMASS Lowell with separate utilities, hardwood floors, and a large fenced yard.
Where is this multifamily property located?
The property is located at 103 Dalton Street Lowell, MA.
What is the asking price?
The asking price for this property is $680,000.
What are key features of this property?
This property features: Two‑family home with approximately 3,500 SF of living space; Year built: 1920; Separate utilities for the two units


