Historic Office Building with
For Sale
$825,000
1028 & 1022 E Colfax Ave, South Bend, IN 46617
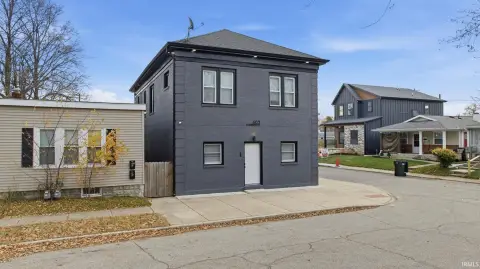
Historic office building with original woodwork, French doors, and a sunroom, plus corner frontage and onsite parking.
Property Size2,256 SF
Price / SF$365.69
Days on Market93
Property Features for 1028 & 1022 E Colfax Ave
General Information
Standard status
Active
Size
2,256 SF
Zoning
NC
Site & Location
Neighborhood
Howardpark
Building Details
Year Built
1911
Listing Agency:
Cressy & Everett - South Bend
Listed By:
Tarah Sheteron · License #6501334297
(269) 876-9276
Source:
Callcriswell
Added: Jul 24
Changed: Oct 12
Last Checked: Oct 23 at 8:45AM
Displayed information is deemed reliable but is not guaranteed and should be independently verified. All listing content including descriptions, pricing, images are the copyrighted material of Cressy & Everett - South Bend

Ask AI about this property
Review the available facts, identify missing information and prepare questions for the agent.
Investment Insights
Based on property information with market context.
Built in 1911, this historic office building at 1028 E Colfax Ave is located within the Howard Park–East Bank National Register Historic District. The property features original rich oak woodwork throughout, elegant French doors, architectural detailing, and a sun-drenched sunroom. It is currently configured as professional office space, with the flexibility to accommodate additional tenants while maintaining meaningful main-space availability.
The building sits on a highly visible, high-traffic corner with a parking lot. It is zoned NC (Neighborhood Center), and prospective buyers are encouraged to independently verify zoning uses, incentives, and eligibility prior to closing.
Information including measurements and taxes is not warranted, and all buyers should confirm details during their due diligence.
The building sits on a highly visible, high-traffic corner with a parking lot. It is zoned NC (Neighborhood Center), and prospective buyers are encouraged to independently verify zoning uses, incentives, and eligibility prior to closing.
Information including measurements and taxes is not warranted, and all buyers should confirm details during their due diligence.
Key Highlights
- Historic office building built in 1911 within the Howard Park–East Bank National Register Historic District
- Original rich oak woodwork, elegant French doors, and architectural detailing throughout
- Sun‑drenched sunroom and character‑rich interior features designed by Freyermuth & Maurer
Financial Insights
Estimated NOI and Cap Rate
NOI / Yr
$29,563
Cap Rate
3.58%
Suggested Prices Based on Cap Rates
Cap Rate 5%
$591,260
$591.3K
Cap Rate 7%
$422,329
$422.3K
Cap Rate 9%
$328,478
$328.5K
Market Conditions
NOI Build-Up for 2,256 SF
Gross rent
$47.4K $21.00/SF
− Vacancy
−$8.0K −$3.53/SF
EGI
$39.4K $17.47/SF
− OpEx
−$9.9K −$4.37/SF
NOI
$29.6K $13.10/SF
Area
South Bend, IN
Vacancy
16.80%
Lease Rate
$21.00 /SF/Yr
Expense Ratio
25.00%
Simulate Cap Rate and NOI
Suggested Prices Based on Cap Rates
Cap Rate 5%
$591,260
Cap Rate 7%
$422,329
Cap Rate 9%
$328,478
Alternative Uses
Best Use
Office B
$422.3K
$369.5K – $492.7K
NOI $29,563 @ 7.0% cap · market cap 3.58%
Second Best
—
—
no second resolved use
Theoretical Best
Office A
$570.7K
$499.4K – $665.9K
NOI $39,952 @ 7.0% cap · market cap 4.84%
Zoning and permitted uses should be independently verified with authorities.
How Realmo checks its estimates
Property Analytics
Unlock full access to Insights
Subscribe to Realmo Intelligence
Open Analytics
Current Use
Location Intelligence
Trade Area within ½ mile
1,375
Businesses Nearby
Explore this area
Business Placement
Demographics for 46617, IN
9,813
Population
5,502
Households
1.8
Avg Household Size
35
Median Age
60%
College-Educated
96%
High-School Grad
2.6 sq mi
ZIP Area
3,774
Density / Sq Mi
$73,700
Median Household Income
$37,331
Median Earnings
$1,422
Median Rent
$231,400
Median Home Value
Check the figures for this property
Cap Rate, Value Estimation, Potential NOI and more
View Realmo Analytics
Market
Vacancy Rate% for Office in Midwest region




Frequently Asked Questions
What type of property is this?
Office building - Historic office building with original woodwork, French doors, and a sunroom, plus corner frontage and onsite parking.
Where is this office building located?
The property is located at 1028 & 1022 E Colfax Ave South Bend, IN.
What is the asking price?
The asking price for this property is $825,000.
What are key features of this property?
This property features: Historic office building built in 1911 within the Howard Park–East Bank National Register Historic District; Original rich oak woodwork, elegant French doors, and architectural detailing throughout; Sun‑drenched sunroom and character‑rich interior features designed by Freyermuth & Maurer