Philadelphia Duplex with Finished
For Sale
$430,000
Pending
1026 LEVICK STREET, Philadelphia, PA 19111
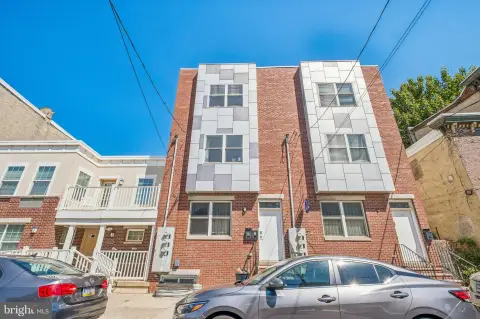
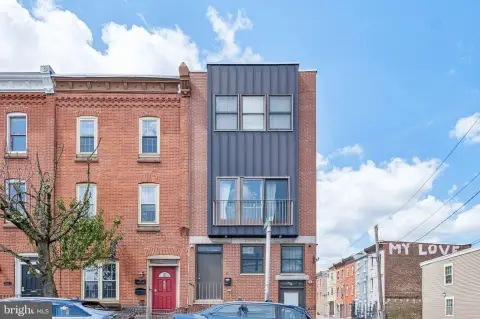
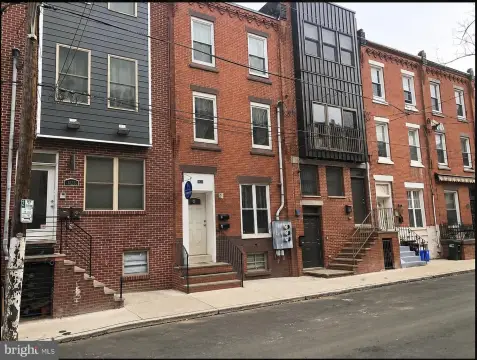
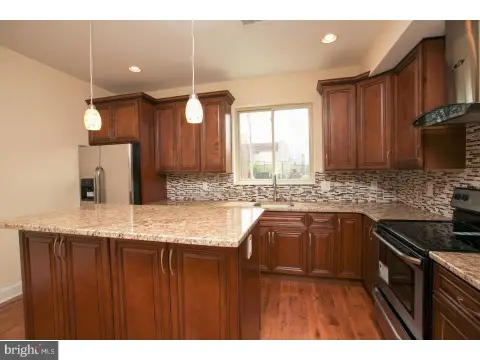
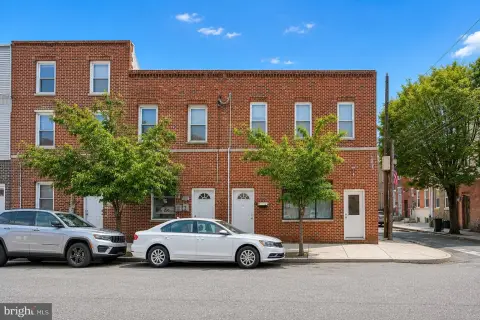
Two-unit property with finished basement, garages, and fenced yard.
Property Size2,400 SF
Days on Market208
Property Features for 1026 LEVICK STREET
General Information
Standard status
Pending
Size
2,400 SF
Total Parking Spaces
2
Property subtype
Residential Income
Zoning
MULTI- FAMILY
Taxes and HOA fees
Annual Taxes
$4,787
Amenities
Sidewalks, Street Lights
Ceiling Fan(s), Window Unit(s), Electric
Exhaust Fan, Natural Gas, Radiant
Cooktop, Electric Water Heater, Gas Water Heater, Exhaust Fan, Refrigerator, Washer, Water Heater
Ceiling Fan(s)
Street
Private, Garage, Attached
Lighting
Transitional
Building Details
Building Size
2,400 SF
Year Built
1952
Listing Agency:
Alliance Real Estate
Listed By:
Doreen Franklin-Burrows · License #RS297102
(215) 224-2101
Source:
Evrealestate
Added: Mar 17
Changed: Oct 6
Last Checked: Oct 9 at 8:33PM
Displayed information is deemed reliable but is not guaranteed and should be independently verified. All listing content including descriptions, pricing, images are the copyrighted material of Alliance Real Estate
Investment Insights
Based on property information with market context.
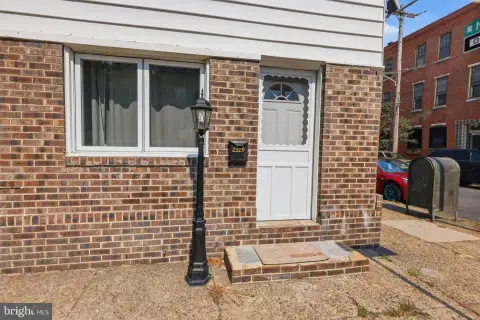
This multifamily property in Philadelphia features two apartments with separate entrances, plus a shared walk-down to the laundry area in the full finished basement. The property includes two full garages, a fenced side yard, and a patio. The building offers a side entrance to the basement. The property is located within the 19111 MLS area, in the Philadelphia City School District. Nearby schools include Laura H Carnell School for elementary and middle school, and Samuel S. Fels High School. The property is sold in "As Is" condition, and the seller will not perform any repairs. The property size is 2400 square feet.
Key Highlights
- Full finished basement with side entrance
- Two‑car garage
- Apartment potential: Separate entrances to both apartments
Financial Insights
Estimated NOI and Cap Rate
NOI / Yr
$32,223
Cap Rate
7.49%
Suggested Prices Based on Cap Rates
Cap Rate 5%
$644,460
$644.5K
Cap Rate 7%
$460,329
$460.3K
Cap Rate 9%
$358,033
$358.0K
Market Conditions
NOI Build-Up for 2,400 SF
Gross rent
$47.5K $19.80/SF
− Vacancy
−$1.5K −$0.62/SF
EGI
$46.0K $19.18/SF
− OpEx
−$13.8K −$5.75/SF
NOI
$32.2K $13.43/SF
Area
ZIP 19111
Vacancy
3.13%
Lease Rate
$19.80 /SF/Yr
Expense Ratio
30.00%
Simulate Cap Rate and NOI
Suggested Prices Based on Cap Rates
Cap Rate 5%
$644,460
Cap Rate 7%
$460,329
Cap Rate 9%
$358,033
Alternative Uses
Best Use
Multifamily LT 5
$460.3K
$402.8K – $537.1K
NOI $32,223 @ 7.0% cap · market cap 7.49%
Second Best
Apartment 5plus
$424.5K
$371.5K – $495.3K
NOI $29,716 @ 7.0% cap · market cap 6.91%
Theoretical Best
Office A
$727.7K
$636.7K – $848.9K
NOI $50,936 @ 7.0% cap · market cap 11.85%
Zoning and permitted uses should be independently verified with authorities.
Property Analytics
Unlock full access to Insights
Subscribe to Realmo Intelligence
Open Analytics
Current Use
Location Intelligence
Trade Area within ½ mile
958
Businesses Nearby
Explore this area
Business Placement
Demographics for 19111, PA
67,017
Population
27,518
Households
2.4
Avg Household Size
38
Median Age
25%
College-Educated
86%
High-School Grad
4.8 sq mi
ZIP Area
13,962
Density / Sq Mi
$60,441
Median Household Income
$39,065
Median Earnings
$1,221
Median Rent
$244,000
Median Home Value
Check the figures for this property
Cap Rate, Value Estimation, Potential NOI and more
View Realmo Analytics
Market
Vacancy Rate% for Multifamily in Northeast region

Questions? Ask Rey
Realmo’s AI knows this listing — price, zoning, demand, history. Ask anything.




Frequently Asked Questions
What type of property is this?
Duplex - Two-unit property with finished basement, garages, and fenced yard.
Where is this duplex located?
The property is located at 1026 LEVICK STREET Philadelphia, PA.
What is the asking price?
The asking price for this property is $430,000.
What are key features of this property?
This property features: Full finished basement with side entrance; Two‑car garage; Apartment potential: Separate entrances to both apartments


