Two-Story Office
For Sale
$389,500
1000 Main Street, Van Buren, AR 72956
Flexible two-level layout with potential to separate the first and second floors.
Property Size2,096 SF
Price / SF$185.83
Days on Market89
Property Features for 1000 Main Street
General Information
Standard status
Active
Size
2,096 SF
Building Details
Buildings
1
Stories
2
Listing Agency:
Sagely & Edwards Realtors
(479) 782-8911
Listed By:
Jeff Beauchamp · License #SA00088441
(479) 719-5037
Source:
Assurancerealtyfsm
Added: Jul 20
Changed: Oct 6
Last Checked: Oct 14 at 10:28PM
Displayed information is deemed reliable but is not guaranteed and should be independently verified. All listing content including descriptions, pricing, images are the copyrighted material of Sagely & Edwards Realtors

Ask AI about this property
Review the available facts, identify missing information and prepare questions for the agent.
Investment Insights
Based on property information with market context.
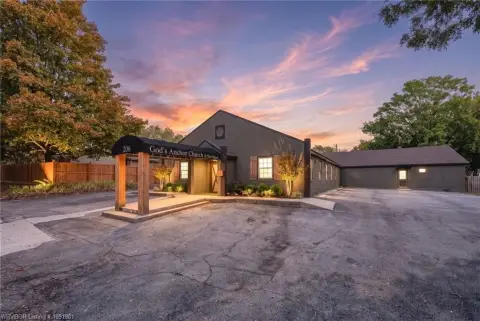
This 2,096-square-foot office building offers two levels connected by a staircase at the southwest end. The property was most recently used as an attorney’s office and previously operated as retail space, providing a documented commercial-use history. Its configuration may support separating the first and second floors.
The building is located at 1000 Main Street in Van Buren, across from First Baptist Church, First Presbyterian Church, and City Hall. Offices face Main Street with views along the corridor, placing the property within an established civic and commercial setting.
The building is located at 1000 Main Street in Van Buren, across from First Baptist Church, First Presbyterian Church, and City Hall. Offices face Main Street with views along the corridor, placing the property within an established civic and commercial setting.
Key Highlights
- 2,096‑square‑foot office building
- Two‑story configuration with southwest‑end staircase
- Potential to separate first- and second‑floor areas
Financial Insights
Estimated NOI and Cap Rate
NOI / Yr
$21,097
Cap Rate
5.42%
Suggested Prices Based on Cap Rates
Cap Rate 5%
$421,940
$421.9K
Cap Rate 7%
$301,386
$301.4K
Cap Rate 9%
$234,411
$234.4K
Market Conditions
NOI Build-Up for 2,096 SF
Gross rent
$30.2K $14.40/SF
− Vacancy
−$2.1K −$0.98/SF
EGI
$28.1K $13.42/SF
− OpEx
−$7.0K −$3.36/SF
NOI
$21.1K $10.07/SF
Area
Crawford County, AR
Vacancy
6.80%
Lease Rate
$14.40 /SF/Yr
Expense Ratio
25.00%
Simulate Cap Rate and NOI
Suggested Prices Based on Cap Rates
Cap Rate 5%
$421,940
Cap Rate 7%
$301,386
Cap Rate 9%
$234,411
Alternative Uses
Best Use
Office B
$301.4K
$263.7K – $351.6K
NOI $21,097 @ 7.0% cap · market cap 5.42%
Second Best
—
—
no second resolved use
Theoretical Best
Office A
$401.9K
$351.6K – $468.8K
NOI $28,130 @ 7.0% cap · market cap 7.22%
Zoning and permitted uses should be independently verified with authorities.
How Realmo checks its estimates
Property Analytics
Unlock full access to Insights
Subscribe to Realmo Intelligence
Open Analytics
Current Use
Location Intelligence
Trade Area within ½ mile
604
Businesses Nearby
Explore this area
Business Placement
Demographics for 72956, AR
33,870
Population
14,119
Households
2.4
Avg Household Size
39
Median Age
19%
College-Educated
87%
High-School Grad
103.8 sq mi
ZIP Area
326
Density / Sq Mi
$60,387
Median Household Income
$33,894
Median Earnings
$825
Median Rent
$177,100
Median Home Value
Check the figures for this property
Cap Rate, Value Estimation, Potential NOI and more
View Realmo Analytics
Market
Vacancy Rate% for Office in South region





Frequently Asked Questions
What type of property is this?
Office building - Flexible two-level layout with potential to separate the first and second floors.
Where is this office building located?
The property is located at 1000 Main Street Van Buren, AR.
What is the asking price?
The asking price for this property is $389,500.
What are key features of this property?
This property features: 2,096‑square‑foot office building; Two‑story configuration with southwest‑end staircase; Potential to separate first- and second‑floor areas


