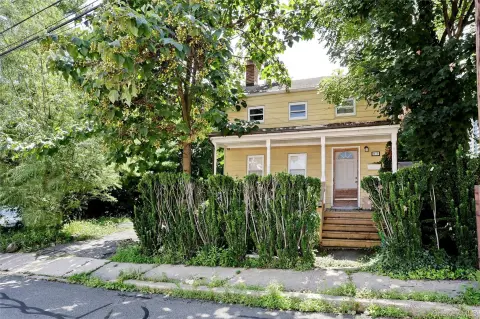
Historic Nyack Colonial Multifamily
For Sale
$950,000
Pending
10 N Prospect St, Nyack, NY 10960
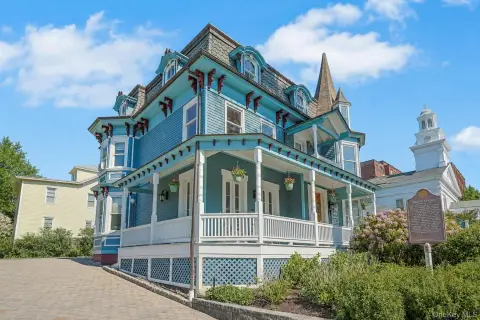
Charming 4-family home in historic Nyack, near village amenities.
Property Size2,937 SF
Lot Size0.11 Acres
Days on Market218
Property Features for 10 N Prospect St
General Information
Standard status
Pending
Size
2,937 SF
Lot size
0.11 Acres
Property subtype
Investment
Taxes and HOA fees
Annual Taxes
$20,919
Building Details
Building Size
2,937 SF
Year Built
1940
Units
4
Listing Agency:
Ellis Sotheby's International Realty
Listed By:
Alex A Vursta · License #40VU0892886
(845) 641-2525
Source:
Elliman
Added: Mar 11
Changed: Oct 7
Last Checked: Oct 12 at 7:13PM
Displayed information is deemed reliable but is not guaranteed and should be independently verified. All listing content including descriptions, pricing, images are the copyrighted material of Ellis Sotheby's International Realty
Investment Insights
Based on property information with market context.
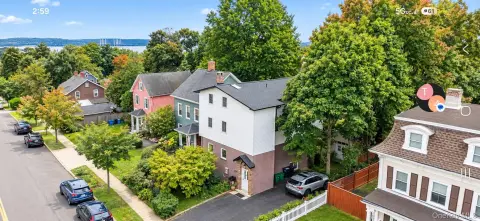
This early 20th-century Colonial home, located in the heart of historic Nyack, features period details and charm. Situated on a picturesque street with timeless architecture, the property has been converted into a legal 4-family residence. The residence offers flexibility for investors or those interested in restoring it to a single-family home. Each of the four one-bedroom apartments occupies its own level, spanning floors 1 through 3, plus a walk-out lower level. This layout is suitable for rental income or multigenerational living. The property is located a short distance from the heart of town, providing access to Nyack's village life, including dining, shopping, parks, and cultural spots. The location also offers access to the Old Rail Trail, which extends into New Jersey, as well as community amenities such as tennis courts, gardens, and the Hudson River waterfront. The property is located in a village rich with history, community, and charm.
Key Highlights
- Prime location in the heart of historic Nyack, offering walkability to dining, shopping, parks, and cultural attractions.**
- Legal 4‑family residence providing immediate rental income potential or multigenerational living options.
- Opportunity to restore the property to its original single‑family grandeur.
Financial Insights
Estimated NOI and Cap Rate
NOI / Yr
$51,901
Cap Rate
5.46%
Suggested Prices Based on Cap Rates
Cap Rate 5%
$1,038,020
$1.0M
Cap Rate 7%
$741,443
$741.4K
Cap Rate 9%
$576,678
$576.7K
Market Conditions
NOI Build-Up for 2,937 SF
Gross rent
$79.3K $27.00/SF
− Vacancy
−$5.2K −$1.76/SF
EGI
$74.1K $25.25/SF
− OpEx
−$22.2K −$7.57/SF
NOI
$51.9K $17.67/SF
Area
Rockland County, NY
Vacancy
6.50%
Lease Rate
$27.00 /SF/Yr
Expense Ratio
30.00%
Simulate Cap Rate and NOI
Suggested Prices Based on Cap Rates
Cap Rate 5%
$1,038,020
Cap Rate 7%
$741,443
Cap Rate 9%
$576,678
Alternative Uses
Best Use
Multifamily LT 5
$741.4K
$648.8K – $865.0K
NOI $51,901 @ 7.0% cap · market cap 5.46%
Second Best
Apartment 5plus
$687.6K
$601.7K – $802.2K
NOI $48,132 @ 7.0% cap · market cap 5.07%
Theoretical Best
Specialty Retail
$1.94M
$1.70M – $2.27M
NOI $135,932 @ 7.0% cap · market cap 14.31%
Zoning and permitted uses should be independently verified with authorities.
How Realmo checks its estimates
Property Analytics
Unlock full access to Insights
Subscribe to Realmo Intelligence
Open Analytics
Current Use
Location Intelligence
Trade Area within ½ mile
1,977
Businesses Nearby
Explore this area
Business Placement
Demographics for 10960, NY
14,680
Population
6,680
Households
2.2
Avg Household Size
44
Median Age
63%
College-Educated
95%
High-School Grad
4.7 sq mi
ZIP Area
3,123
Density / Sq Mi
$126,404
Median Household Income
$69,067
Median Earnings
$2,148
Median Rent
$662,600
Median Home Value
Check the figures for this property
Cap Rate, Value Estimation, Potential NOI and more
View Realmo Analytics
Market
Vacancy Rate% for Multifamily in Northeast region

Questions? Ask Rey
Realmo’s AI knows this listing — price, zoning, demand, history. Ask anything.





Frequently Asked Questions
What type of property is this?
Quadplex - Charming 4-family home in historic Nyack, near village amenities.
Where is this quadplex located?
The property is located at 10 N Prospect St Nyack, NY.
What is the asking price?
The asking price for this property is $950,000.
What are key features of this property?
This property features: Prime location in the heart of historic Nyack, offering walkability to dining, shopping, parks, and cultural attractions.**; Legal 4‑family residence providing immediate rental income potential or multigenerational living options.; Opportunity to restore the property to its original single‑family grandeur.


