Expandable Industrial Property in
For Sale
Contact for pricing
10 Airpark Vista Boulevard, Dayton, NV 89403
53,144 SF industrial space expandable to 110,000 SF.
Property Size53,144 SF
Lot Size6.25 Acres
Price / SF$174
Days on Market782
Property Features for 10 Airpark Vista Boulevard
General Information
Standard status
Active
Size
53,144 SF
Class
B
Lot size
6.25 Acres
Property subtype
Industrial
Investment Type
Owner/User
Building Details
Year Built
1990
Stories
1
Listing Agency:
Colliers - Reno, Nevada
Listed By:
Casey Scott CCIM · License #NV S.173901
Source:
Crexi
Added: Aug 19, 2024
Changed: Oct 6
Last Checked: Oct 7 at 9:32AM
Displayed information is deemed reliable but is not guaranteed and should be independently verified. All listing content including descriptions, pricing, images are the copyrighted material of Colliers - Reno, Nevada
Investment Insights
Based on property information with market context.
This commercial real estate offering features approximately 53,144 square feet of available space, with expansion potential up to 110,000 square feet. The property includes approximately 5,232 square feet of office space. Loading and access are facilitated by seven 9’x9’ dock-high doors and three drive-in doors. The property is equipped with 800 amp / 480 volt power. Situated on 6.25 acres, the site offers additional land suitable for expansion, storage, or parking. The property is located at 10 Airpark Vista Boulevard, Dayton, NV 89403.
Key Highlights
- Substantial ±53,144 SF available space on 6.25 acres.
- Expandable to 110,000 SF, offering significant growth potential.
- Seven dock‑high doors and three drive‑in doors facilitate efficient logistics.
Financial Insights
Estimated NOI and Cap Rate
NOI / Yr
$399,114
Cap Rate
4.29%
Suggested Prices Based on Cap Rates
Cap Rate 5%
$7,982,280
$8.0M
Cap Rate 7%
$5,701,629
$5.7M
Cap Rate 9%
$4,434,600
$4.4M
Market Conditions
NOI Build-Up for 53,144 SF
Gross rent
$503.8K $9.48/SF
− Vacancy
−$34.3K −$0.64/SF
EGI
$469.5K $8.84/SF
− OpEx
−$70.4K −$1.33/SF
NOI
$399.1K $7.51/SF
Area
Lyon County, NV
Vacancy
6.80%
Lease Rate
$9.48 /SF/Yr
Expense Ratio
15.00%
Simulate Cap Rate and NOI
Suggested Prices Based on Cap Rates
Cap Rate 5%
$7,982,280
Cap Rate 7%
$5,701,629
Cap Rate 9%
$4,434,600
Alternative Uses
Best Use
Office B
$13.42M
$11.74M – $15.66M
NOI $939,445 @ 7.0% cap · market cap 10.10%
Second Best
Warehouse
$5.70M
$4.99M – $6.65M
NOI $399,114 @ 7.0% cap · market cap 4.29%
Theoretical Best
Office A
$16.38M
$14.33M – $19.11M
NOI $1,146,482 @ 7.0% cap · market cap 12.33%
Zoning and permitted uses should be independently verified with authorities.
Property Analytics
Unlock full access to Insights
Subscribe to Realmo Intelligence
Open Analytics
Current Use
Location Intelligence
Trade Area within ½ mile
24
Businesses Nearby
Well-served
Demand for This Use
Explore this area
Business Placement
Demographics for 89403, NV
16,824
Population
6,906
Households
2.4
Avg Household Size
46
Median Age
20%
College-Educated
89%
High-School Grad
162.0 sq mi
ZIP Area
104
Density / Sq Mi
$87,226
Median Household Income
$46,997
Median Earnings
$1,275
Median Rent
$391,500
Median Home Value
Check the figures for this property
Cap Rate, Value Estimation, Potential NOI and more
View Realmo Analytics
Market
Vacancy Rate% for Office in West region

Questions? Ask Rey
Realmo’s AI knows this listing — price, zoning, demand, history. Ask anything.

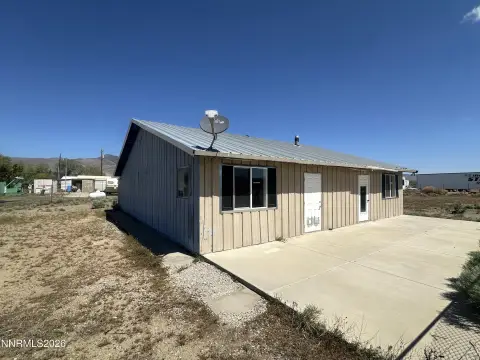

Similar Off Market Nearby
- El Dorado Storage & Office Suites, LLC — 401 Dayton Valley Rd, Dayton, NV 89403
Frequently Asked Questions
What type of property is this?
Warehouse - 53,144 SF industrial space expandable to 110,000 SF.
Where is this warehouse located?
The property is located at 10 Airpark Vista Boulevard Dayton, NV.
What is the asking price?
The asking price for this property is $9,300,000.
What are key features of this property?
This property features: Substantial ±53,144 SF available space on 6.25 acres.; Expandable to 110,000 SF, offering significant growth potential.; Seven dock‑high doors and three drive‑in doors facilitate efficient logistics.



