Edwards Village Professional Office
For Sale
$610,000
Pending
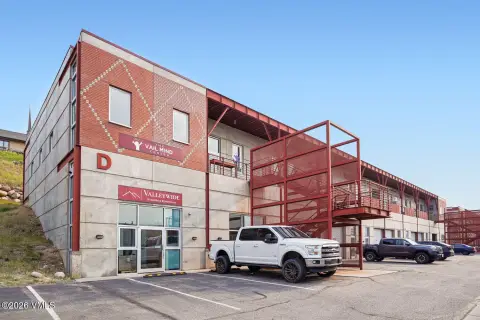
0105 Edwards Village Boulevard #D201, Edwards, CO 81632
Professional office in Edwards Village Center with natural light.
Property Size1,603 SF
Lot Size0.13 Acres
Days on Market386
Property Features for 0105 Edwards Village Boulevard #D201
General Information
Standard status
Pending
Size
1,603 SF
Lot size
0.13 Acres
Property subtype
Commercial
Taxes and HOA fees
Annual Taxes
$9,326
Amenities
Forced Air Heating
Synthetic Roof
Unassigned
Building Details
Year Built
1997
Listing Agency:
WALTER REALTY GROUP, INC.
(970) 926-5748
Listed By:
MICHAEL WALTER
(970) 390-8574
Source:
Corcoran
Added: Sep 30, 2025
Changed: Oct 7
Last Checked: Oct 19 at 6:43AM
Displayed information is deemed reliable but is not guaranteed and should be independently verified. All listing content including descriptions, pricing, images are the copyrighted material of WALTER REALTY GROUP, INC.

Ask AI about this property
Review the available facts, identify missing information and prepare questions for the agent.
Investment Insights
Based on property information with market context.
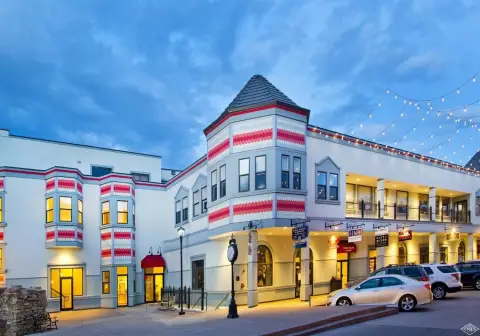
This well-appointed professional office space is located in the Edwards Village Center. The surrounding area includes a post office, coffee shop, four restaurants, retail stores, three banks, and various medical service providers. The office layout features a reception area, a conference room, two enclosed office suites, two partially enclosed workstations, two open workstations, and a kitchenette. Natural light from three sides and western views contribute to a comfortable work environment. The property size is 1603 square feet.
Key Highlights
- Prime location in the vibrant Edwards Village Center with high foot traffic and proximity to essential services.
- Functional office layout including a reception area, conference room, enclosed offices, and workstations.
- Abundant natural light from three sides and western views creating a pleasant work environment.
Financial Insights
Estimated NOI and Cap Rate
NOI / Yr
$22,506
Cap Rate
3.69%
Suggested Prices Based on Cap Rates
Cap Rate 5%
$450,120
$450.1K
Cap Rate 7%
$321,514
$321.5K
Cap Rate 9%
$250,067
$250.1K
Market Conditions
NOI Build-Up for 1,603 SF
Gross rent
$38.5K $24.00/SF
− Vacancy
−$8.5K −$5.28/SF
EGI
$30.0K $18.72/SF
− OpEx
−$7.5K −$4.68/SF
NOI
$22.5K $14.04/SF
Area
Eagle County, CO
Vacancy
22.00%
Lease Rate
$24.00 /SF/Yr
Expense Ratio
25.00%
Simulate Cap Rate and NOI
Suggested Prices Based on Cap Rates
Cap Rate 5%
$450,120
Cap Rate 7%
$321,514
Cap Rate 9%
$250,067
Alternative Uses
Best Use
Office B
$321.5K
$281.3K – $375.1K
NOI $22,506 @ 7.0% cap · market cap 3.69%
Second Best
—
—
no second resolved use
Theoretical Best
Office A
$439.7K
$384.7K – $513.0K
NOI $30,778 @ 7.0% cap · market cap 5.05%
Zoning and permitted uses should be independently verified with authorities.
How Realmo checks its estimates
Property Analytics
Unlock full access to Insights
Subscribe to Realmo Intelligence
Open Analytics
Current Use
Location Intelligence
Trade Area within ½ mile
1,137
Businesses Nearby
Explore this area
Business Placement
Demographics for 81632, CO
11,343
Population
5,529
Households
2.1
Avg Household Size
39
Median Age
58%
College-Educated
94%
High-School Grad
115.9 sq mi
ZIP Area
98
Density / Sq Mi
$92,304
Median Household Income
$49,709
Median Earnings
$1,885
Median Rent
$734,300
Median Home Value
Check the figures for this property
Cap Rate, Value Estimation, Potential NOI and more
View Realmo Analytics
Market
Vacancy Rate% for Office in West region




Frequently Asked Questions
What type of property is this?
Office unit - Professional office in Edwards Village Center with natural light.
Where is this office unit located?
The property is located at 0105 Edwards Village Boulevard #D201 Edwards, CO.
What is the asking price?
The asking price for this property is $610,000.
What are key features of this property?
This property features: Prime location in the vibrant Edwards Village Center with high foot traffic and proximity to essential services.; Functional office layout including a reception area, conference room, enclosed offices, and workstations.; Abundant natural light from three sides and western views creating a pleasant work environment.


