Mixed-Use Space with
For Sale
$610,500
O201-137 Main St, Edwards, CO 81632
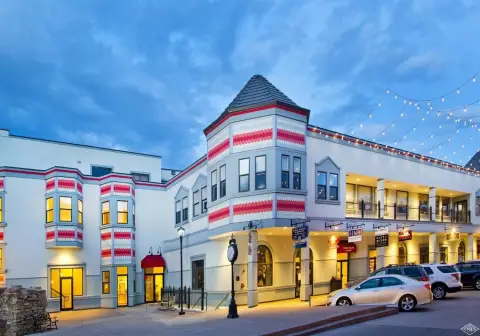
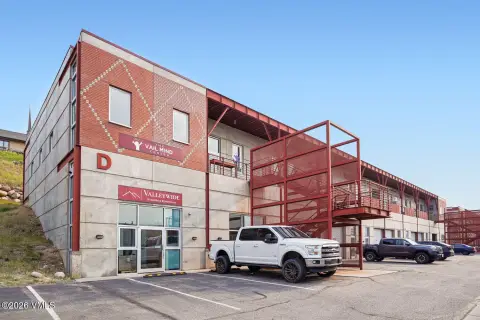
Flexible downtown space with street-level and underground parking plus elevator access for business operations.
Property Size1,221 SF
Price / SF$500
Days on Market273
Property Features for O201-137 Main St
General Information
Standard status
Active
Size
1,221 SF
Elevators
Yes
Additional Details
Road Access
Yes
Taxes and HOA fees
Annual Taxes
$7,436
Amenities
street-front parking
underground parking
elevator access
Listing Agency:
Berkshire Hathaway - Edwards
(970) 926-8440
Listed By:
Jennie Longville May · License #FA1300765
(970) 390-6617
Source:
Exprealty
Added: Jan 16
Changed: Oct 12
Last Checked: Oct 15 at 1:46AM
Displayed information is deemed reliable but is not guaranteed and should be independently verified. All listing content including descriptions, pricing, images are the copyrighted material of Berkshire Hathaway - Edwards

Ask AI about this property
Review the available facts, identify missing information and prepare questions for the agent.
Investment Insights
Based on property information with market context.
This mixed-use property at The Riverwalk provides a flexible interior layout that can be configured around a business’s operational needs. Elevator access supports convenient movement through the building, while both street-front and underground parking are available for clients and employees.
Positioned in downtown Edwards, the space offers a business setting within The Riverwalk. The existing configuration is also described as suitable for exploring a residential conversion, subject to applicable requirements and approvals.
Positioned in downtown Edwards, the space offers a business setting within The Riverwalk. The existing configuration is also described as suitable for exploring a residential conversion, subject to applicable requirements and approvals.
Key Highlights
- Flexible floor plan for a customized business workspace
- Street‑front and underground parking available
- Elevator access for clients and employees
Financial Insights
Estimated NOI and Cap Rate
NOI / Yr
$17,143
Cap Rate
2.81%
Suggested Prices Based on Cap Rates
Cap Rate 5%
$342,860
$342.9K
Cap Rate 7%
$244,900
$244.9K
Cap Rate 9%
$190,478
$190.5K
Market Conditions
NOI Build-Up for 1,221 SF
Gross rent
$29.3K $24.00/SF
− Vacancy
−$6.4K −$5.28/SF
EGI
$22.9K $18.72/SF
− OpEx
−$5.7K −$4.68/SF
NOI
$17.1K $14.04/SF
Area
Eagle County, CO
Vacancy
22.00%
Lease Rate
$24.00 /SF/Yr
Expense Ratio
25.00%
Simulate Cap Rate and NOI
Suggested Prices Based on Cap Rates
Cap Rate 5%
$342,860
Cap Rate 7%
$244,900
Cap Rate 9%
$190,478
Alternative Uses
Best Use
Office B
$244.9K
$214.3K – $285.7K
NOI $17,143 @ 7.0% cap · market cap 2.81%
Second Best
Mixed Use
$216.6K
$189.6K – $252.8K
NOI $15,165 @ 7.0% cap · market cap 2.48%
Theoretical Best
Office A
$334.9K
$293.0K – $390.7K
NOI $23,443 @ 7.0% cap · market cap 3.84%
Zoning and permitted uses should be independently verified with authorities.
How Realmo checks its estimates
Property Analytics
Current Use
Lease Details
Yes
Paved road access
Location Intelligence
Trade Area within ½ mile
1,143
Businesses Nearby
Explore this area
Business Placement
Demographics for 81632, CO
11,343
Population
5,529
Households
2.1
Avg Household Size
39
Median Age
58%
College-Educated
94%
High-School Grad
115.9 sq mi
ZIP Area
98
Density / Sq Mi
$92,304
Median Household Income
$49,709
Median Earnings
$1,885
Median Rent
$734,300
Median Home Value
Market
Vacancy Rate% for Office in West region



Frequently Asked Questions
What type of property is this?
Mixed-use property - Flexible downtown space with street-level and underground parking plus elevator access for business operations.
Where is this mixed-use property located?
The property is located at O201-137 Main St Edwards, CO.
What is the asking price?
The asking price for this property is $610,500.
What are key features of this property?
This property features: Flexible floor plan for a customized business workspace; Street‑front and underground parking available; Elevator access for clients and employees


