Retail Condo with Corner Lot
7001 HARRISON Road Fredericksburg, VA 22407
For Sale
$575,000
Commercial Sale - FREDERICKSBURG, VA
Property Size1,400 SF
Price / SF$410.71
Days on Market1271
Property Features for 7001 HARRISON Road
General Information
Property type
Other
Property subtype
Retail
Parking
60
Standard status
Active
Taxes and HOA fees
Tax Annual Amount
23211
Utilities
Heating system
Heat Pump (Heating)
Cooling system
Heat Pump
Building Details
Year built
2007
Number of units
6
Building materials
Masonry, Dryvit
Listing Agency:
Janet M Bahmer
(540) 785-6295
Listed By:
Janet M Bahmer · License #0225110975
(540) 785-6295
Added: Feb 3, 2023
Changed: Jun 9
Last Checked: Jul 28 at 7:06AM
MLS# VASP2015358
Copyright © 2026 Bright MLS. All rights reserved. All information provided by the listing agent/broker is deemed reliable but is not guaranteed and should be independently verified.
Investment Insights
Based on property information with market context.
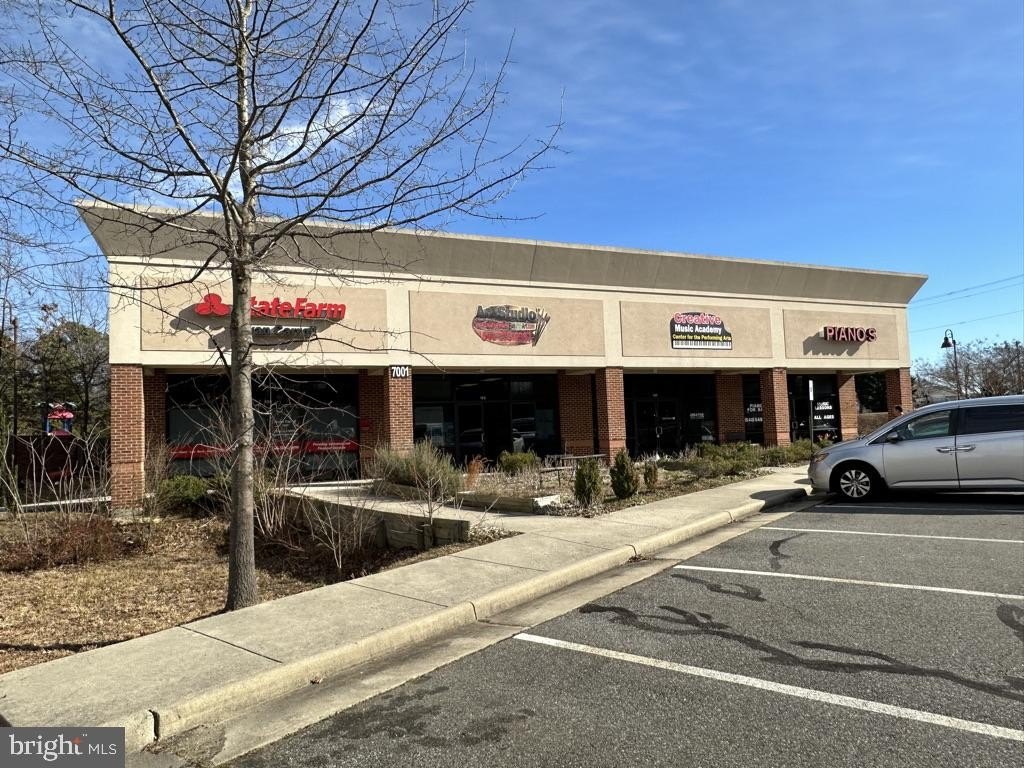
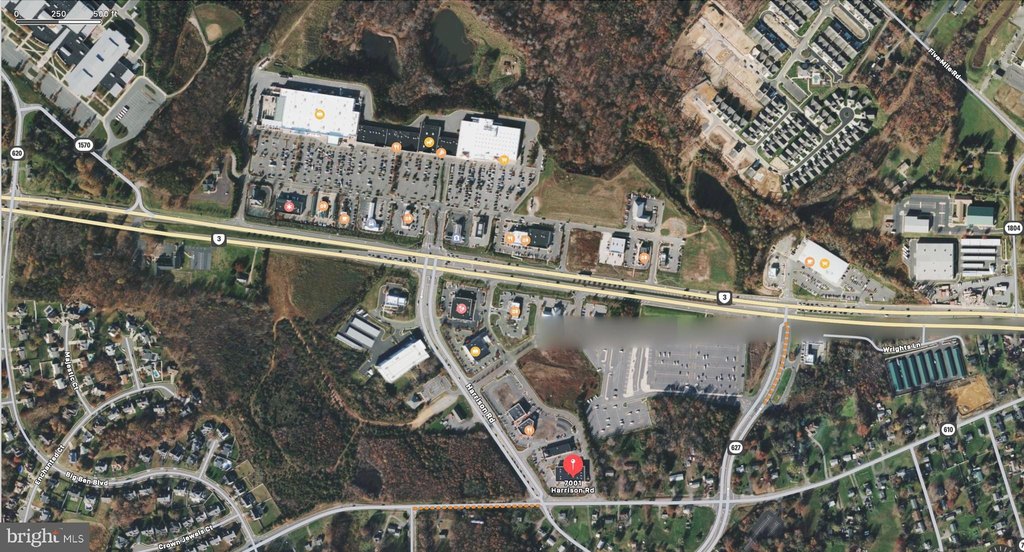
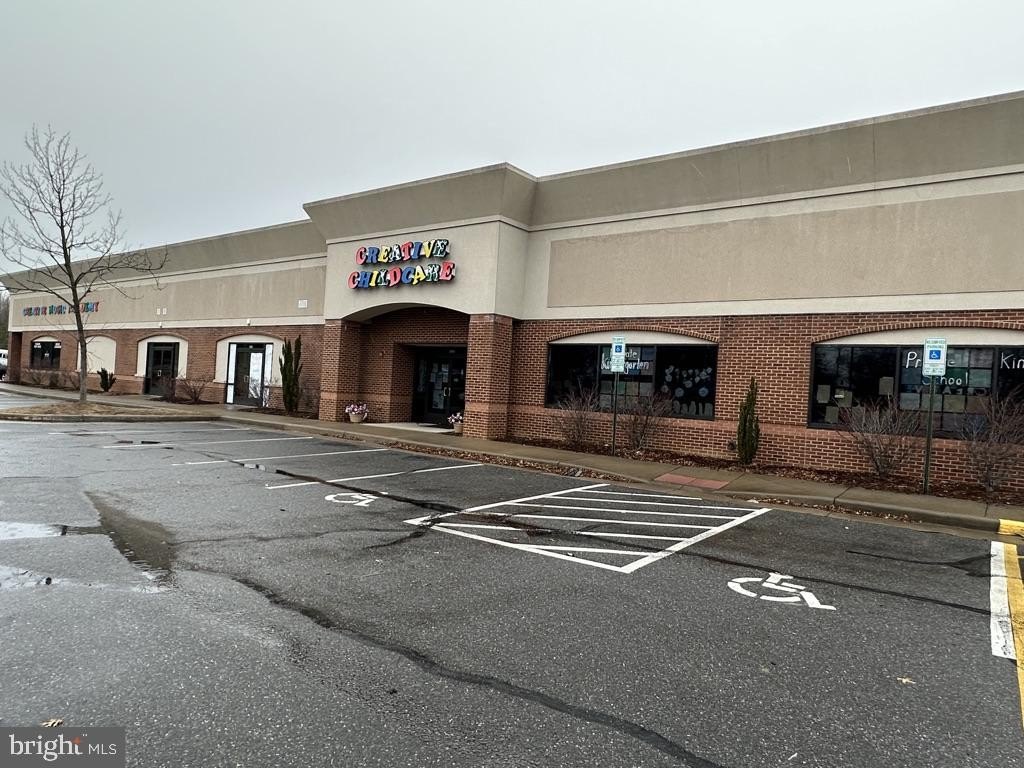
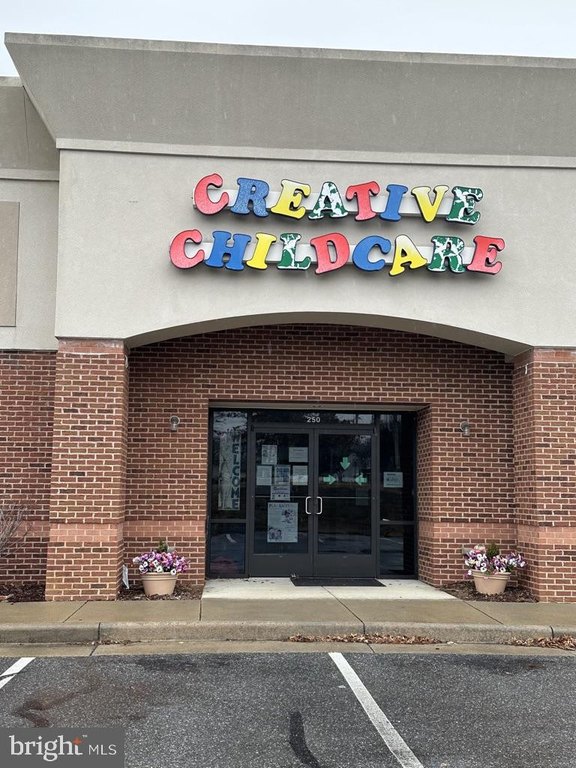
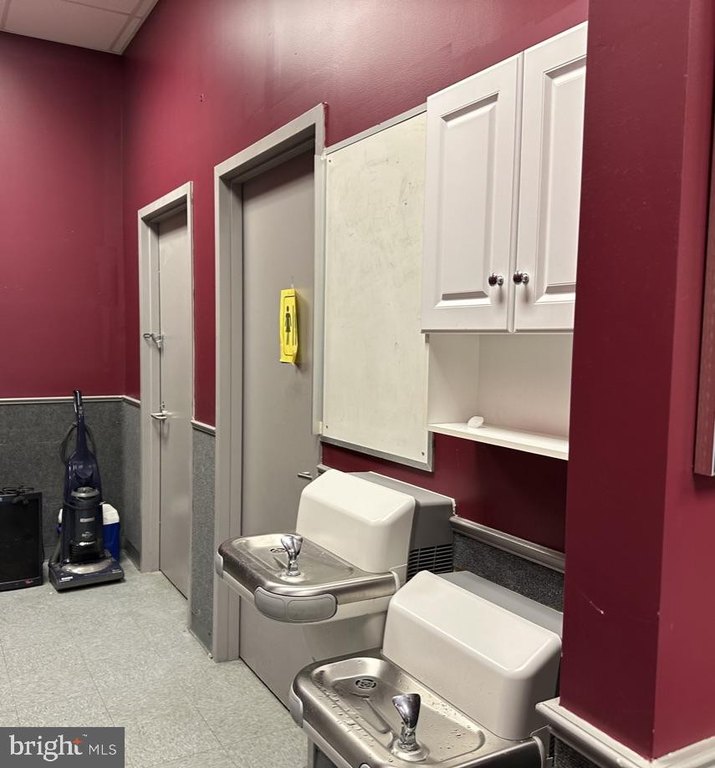
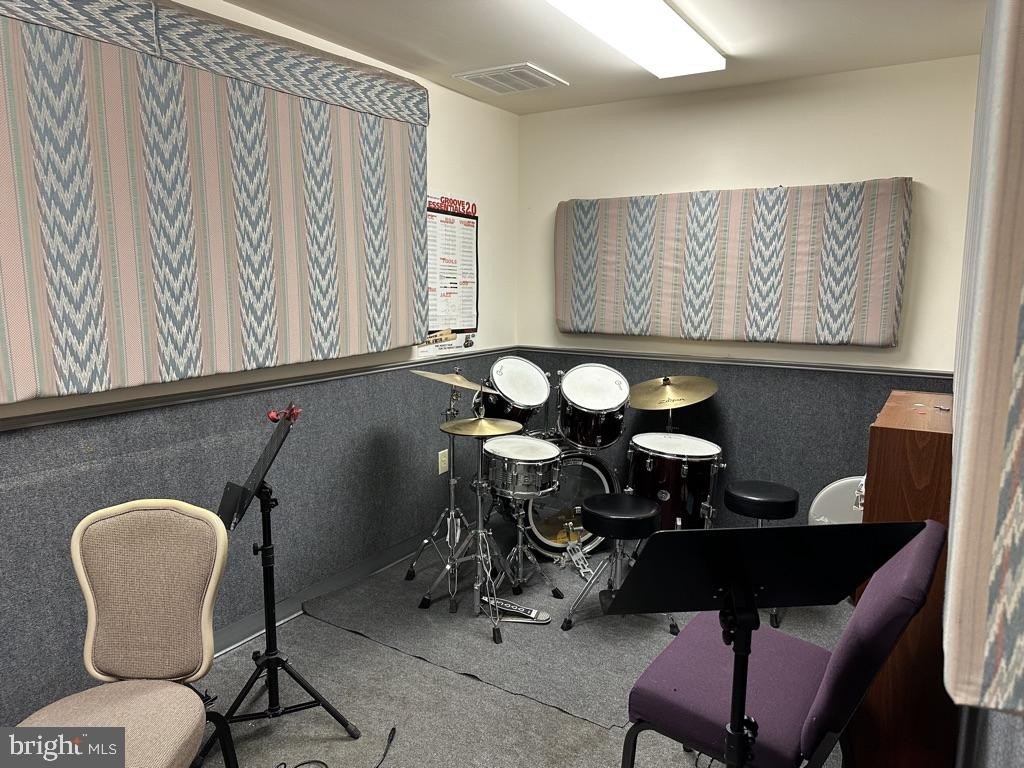
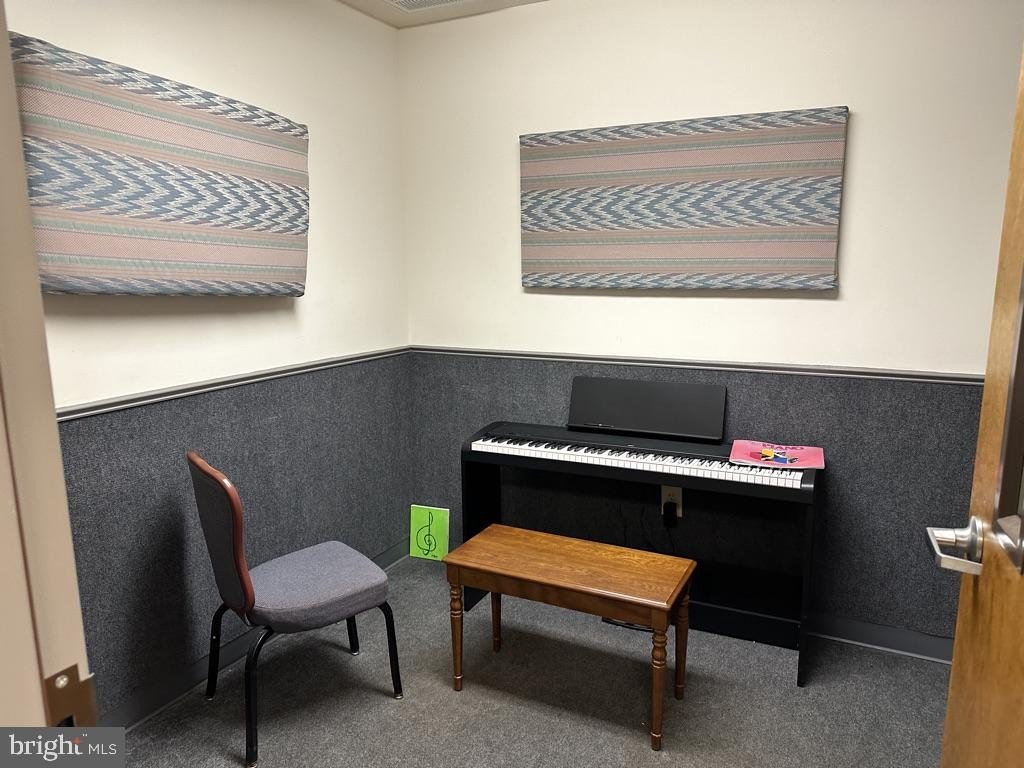
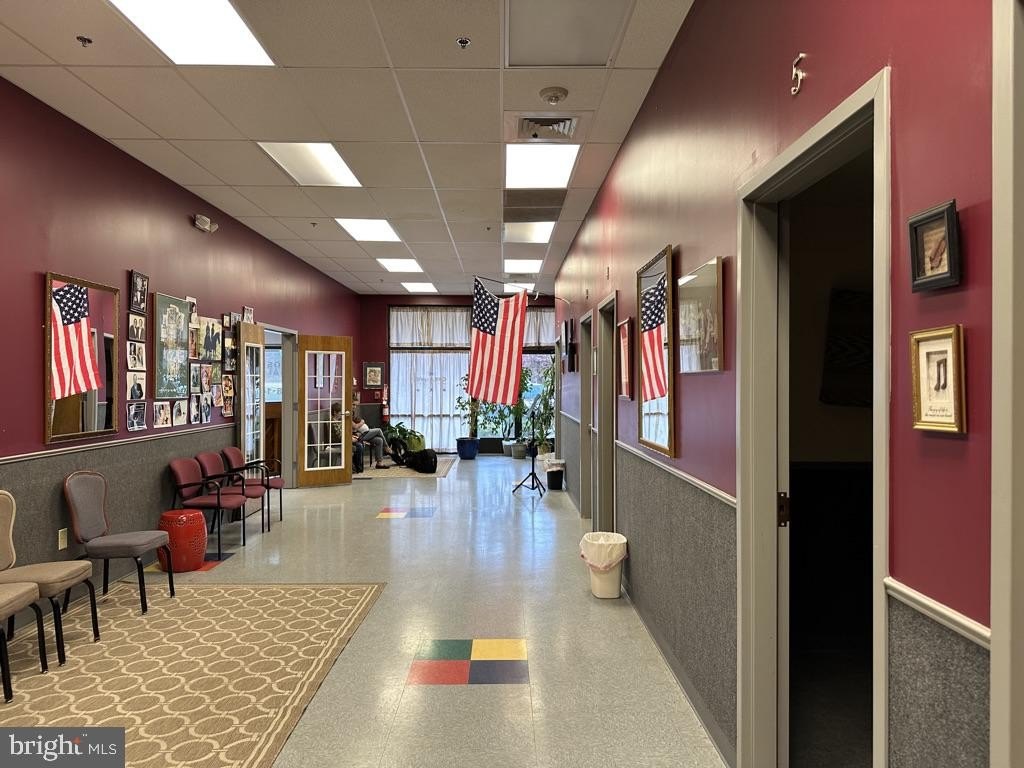
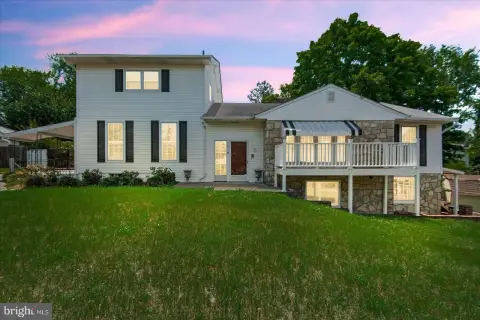
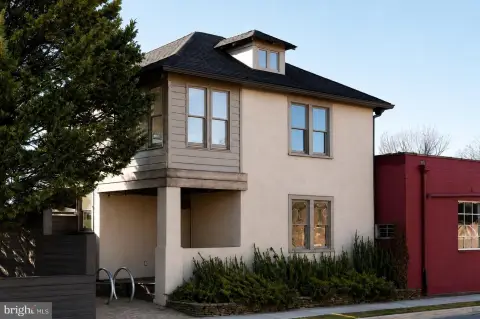
This 1,400-square-foot retail condo is available for purchase in Harrison Crossing South and is located within a multi-tenant building. The property sits on a corner lot and provides frontage on Harrison Road and Old Plank Road, supporting retail-oriented site access and presentation. The center includes multiple co-tenants, including Creative Child Care, Creative Music Academy, and State Farm Insurance, within a total 14,000-square-foot building footprint.
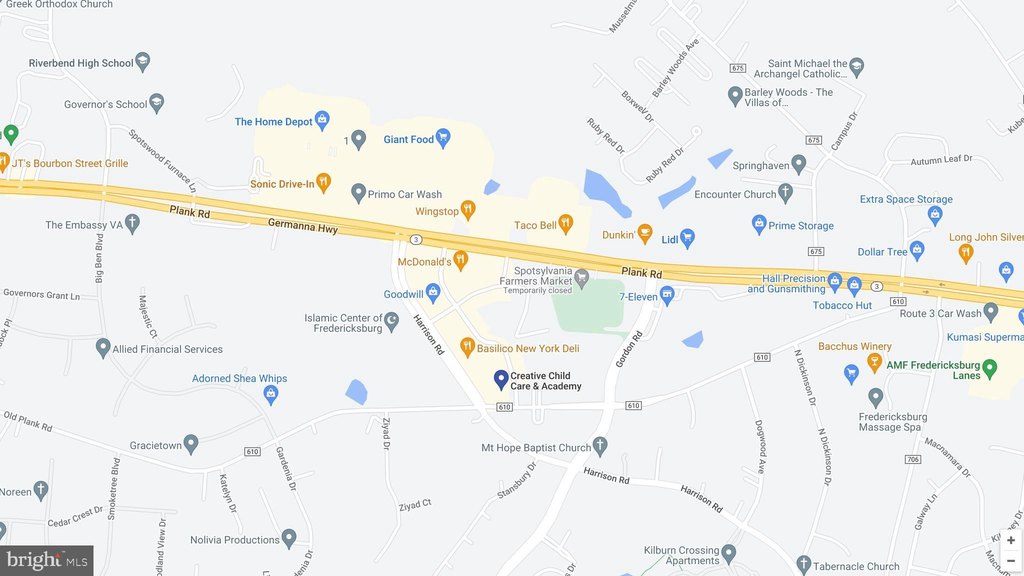
The surrounding area is anchored by major retailers and restaurants within walking distance, including Giant Foods, Lidl, Home Depot, Walgreens, McDonald’s, Petco, Taco Bell, and Harry’s Ale House. The site also benefits from nearby educational activity from Riverbend High School, Chancellor HS, and Harrison Road Elementary. Public remarks cite VDOT 2022 estimated traffic volumes of 39,000 vehicles per day on Route 3, 15,000 vehicles per day on Harrison Road, and 11,000 vehicles per day on Old Plank Road.
The property is suitable for an owner-user or investor seeking a C-3 zoned location that supports a range of retail, office, or medical uses. With additional population and household income noted within a 5-mile radius, this unit offers a practical option for businesses looking to operate in an active, established retail environment.
The surrounding area is anchored by major retailers and restaurants within walking distance, including Giant Foods, Lidl, Home Depot, Walgreens, McDonald’s, Petco, Taco Bell, and Harry’s Ale House. The site also benefits from nearby educational activity from Riverbend High School, Chancellor HS, and Harrison Road Elementary. Public remarks cite VDOT 2022 estimated traffic volumes of 39,000 vehicles per day on Route 3, 15,000 vehicles per day on Harrison Road, and 11,000 vehicles per day on Old Plank Road.
The property is suitable for an owner-user or investor seeking a C-3 zoned location that supports a range of retail, office, or medical uses. With additional population and household income noted within a 5-mile radius, this unit offers a practical option for businesses looking to operate in an active, established retail environment.
Key Highlights
- High‑traffic location with excellent visibility on a corner lot with frontage on Harrison Road and Old Plank Road.
- C‑3 zoning allows for a wide range of retail, office, or medical uses.
- Located in a high‑profile area with major retailers (Giant Foods, Lidl, Home Depot, Walgreens, McDonalds, PetCo, Taco Bell) within walking distance.
Financial Insights For Retail
Simulate Cap Rate and NOI
NOI Build-Up
- Vacancy
- income lost from leasable area expected to sit empty during the year — subtracted from gross rent.
- EGI (Effective Gross Income)
- gross rent minus vacancy losses — the realistic income before paying operating costs.
- OpEx (Operating Expenses)
- recurring costs to operate the property (property tax, insurance, utilities, maintenance, management) — excludes financing and capital improvements.
- NOI (Net Operating Income)
- income a property generates after operating costs but before financing and taxes.
| Component | $ | $/SF |
|---|---|---|
| Gross rent | $29.2k | $20.88 |
| − Vacancy | −$760 | −$0.54 |
| EGI | $28.5k | $20.34 |
| − OpEx | −$8.5k | −$6.10 |
| NOI | $19.9k | $14.24 |
1,400 SF · lease $20.88/SF/yr · vacancy 2.60% · expense 30.00%
Alternative Uses
Best Use
Retail
$284.7K
$249.1K – $332.2K
NOI $19,930 @ 7.0% cap · market cap 3.47%
Second Best
—
—
no second resolved use
Theoretical Best
Office A
$438.8K
$384.0K – $512.0K
NOI $30,719 @ 7.0% cap · market cap 5.34%
Zoning and permitted uses should be independently verified with authorities.
Property Analytics
Property Profile
Location Intelligence
Current Use


Frequently Asked Questions
What type of property is this?
Retail property - Retail condo in a multi-tenant corner setting with major road frontage for strong day-to-day retail and service visibility.
Where is this retail property located?
The property is located at 7001 HARRISON Road Fredericksburg, VA.
What is the asking price?
The asking price for this property is $575,000.
What are key features of this property?
This property features: High‑traffic location with **excellent visibility on a corner lot** with frontage on Harrison Road and Old Plank Road.; C‑3 zoning allows for a wide range of retail, office, or medical uses.; Located in a high‑profile area with major retailers (Giant Foods, Lidl, Home Depot, Walgreens, McDonalds, PetCo, Taco Bell) within walking distance.