Historic Office
For Sale
$735,000
4638 E State Road 45, Bloomington, IN 47408
INVESTMENT, One Story, Bloomington, IN
Property Size4,302 SF
Lot Size1.05 Acres
Price / SF$170.85
Days on Market243
Property Features for 4638 E State Road 45
General Information
Property type
Residential Multi Family
Property subtype
Single Family Residence
Zoning description
Limited Business
Bathrooms
1
Half bathrooms
1
Rooms
Basement, Bathroom 1
Parking
25
Parking features
Off Street
Basement
Block
Lot features
City/ Town/ Suburb, Level, Partially Wooded, 0-2.9999
Elementary school
University
Middle school
Tri-North
High school
Bloomington North
Elementary school district
Monroe County Community School C
Middle school district
Monroe County Community School C
High school district
Monroe County Community School C
Directions
Property is on your right, right before Prairie Green Court.
Subdivision
Monroe County
Standard status
Active
APN
53-05-36-200-017.000-004
Size
4,302 SF
Lot size
1.05 Acres
Taxes and HOA fees
Tax Year
3789
Tax Description
012-04420-00 PT NE NW 36-9-1W 0.89 A Plat 4 012-04435-00 PT SE SW 25-9-1W 0.16 A Plat 14
Legal Description
012-04420-00 PT NE NW 36-9-1W 0.89 A Plat 4 012-04435-00 PT SE SW 25-9-1W 0.16 A Plat 14
Utilities
Cooling system
Central Air
Amenities
fiber internet
Building Details
Year built
1928
Floors in Building
1
Number of units
1
Flooring type
Carpet, Wood
Roof type
Shingle
Architectural style
Ranch
Listing Agency:
Sterling Real Estate
(812) 333-1966
Listed By:
Heather Groves · License #RB15001614
(812) 606-4239
Added: Feb 5
Changed: Sep 12
Last Checked: Oct 6 at 6:06PM
MLS# 202603593
Copyright © 2026 Indiana Uplands Realtor® Association. All rights reserved. All information provided by the listing agent/broker is deemed reliable but is not guaranteed and should be independently verified.
Investment Insights
Based on property information with market context.
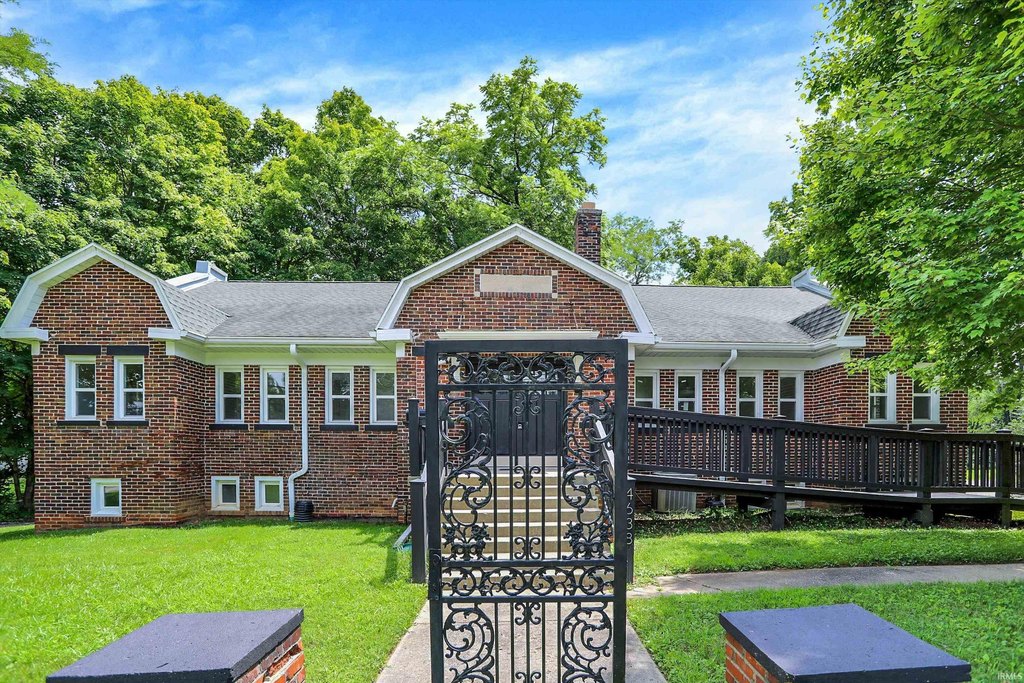
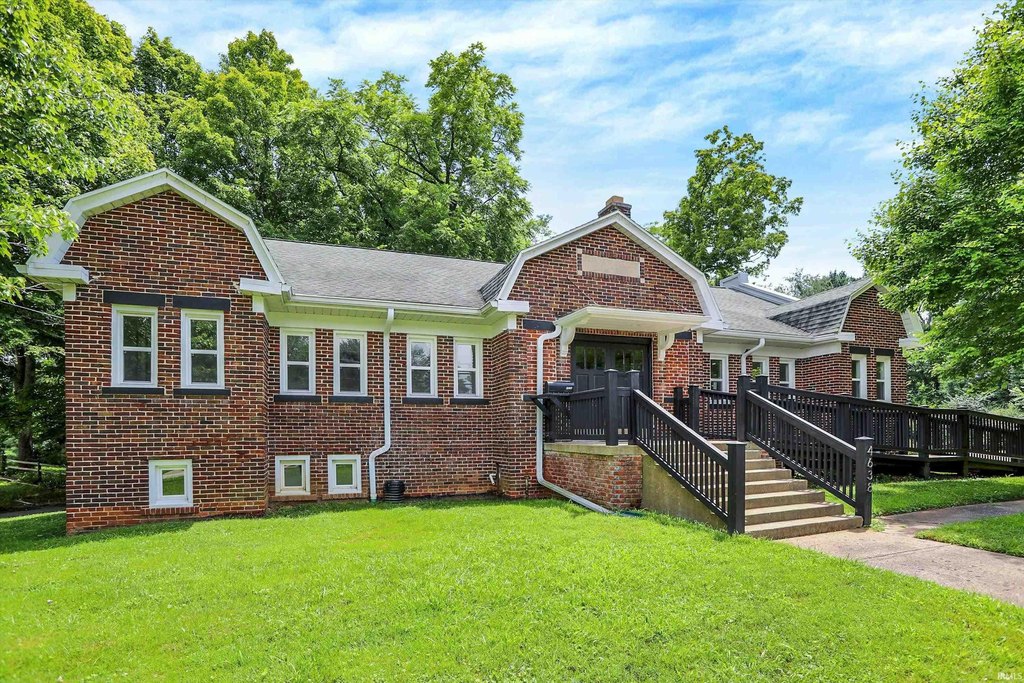
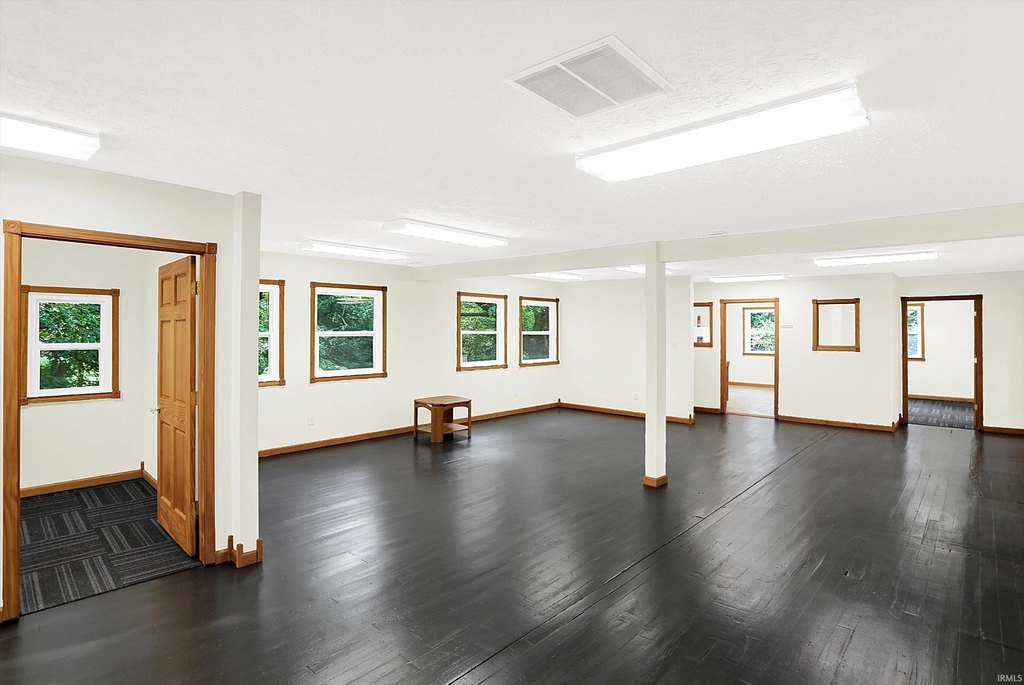
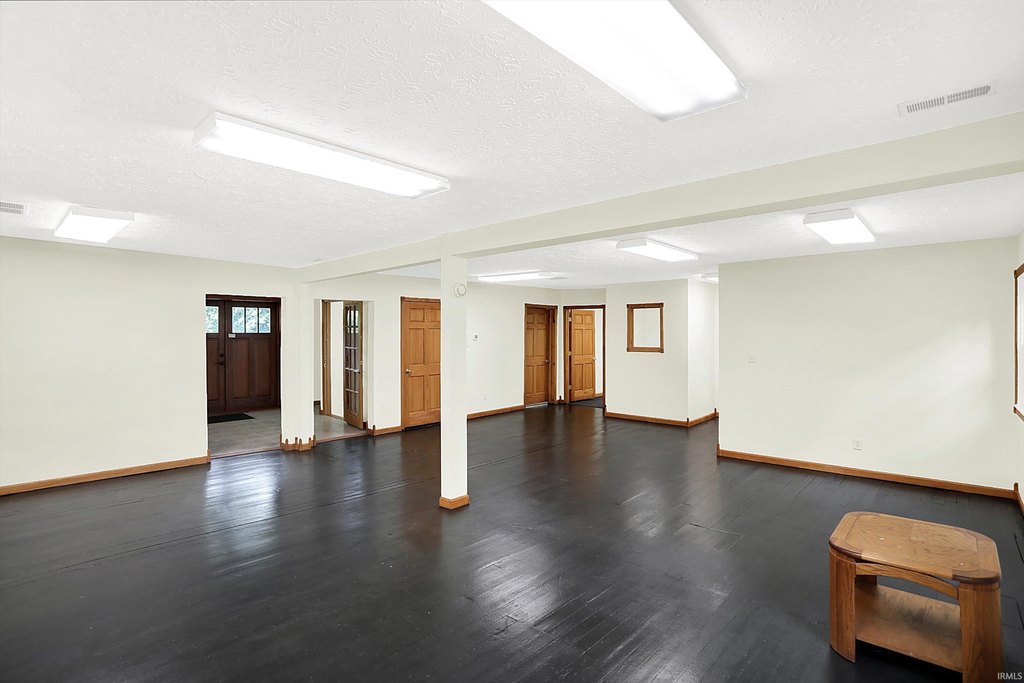
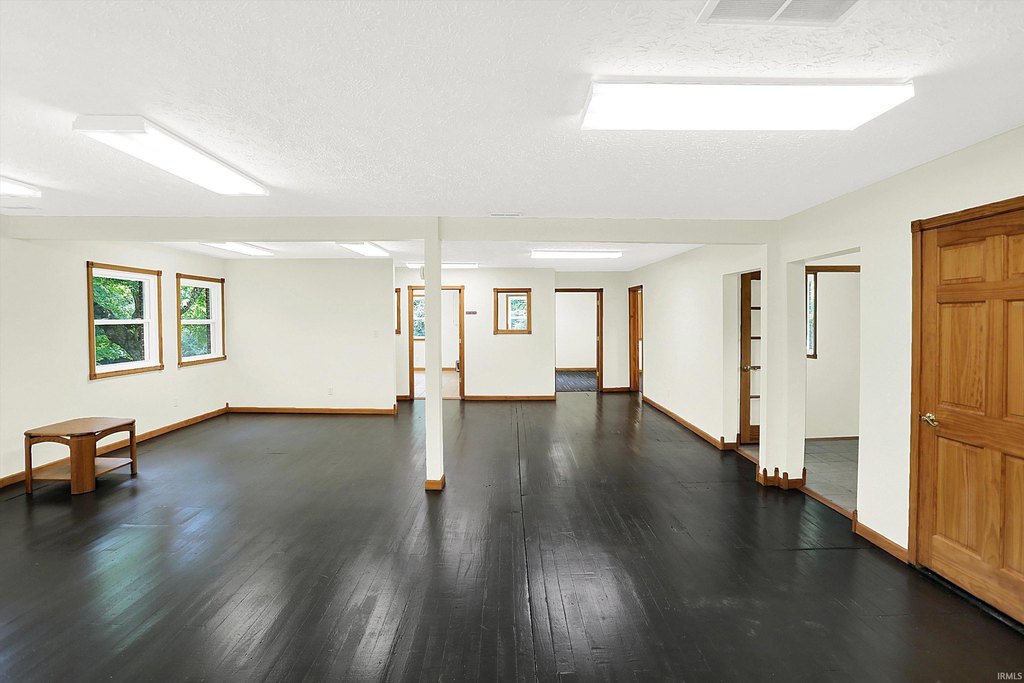
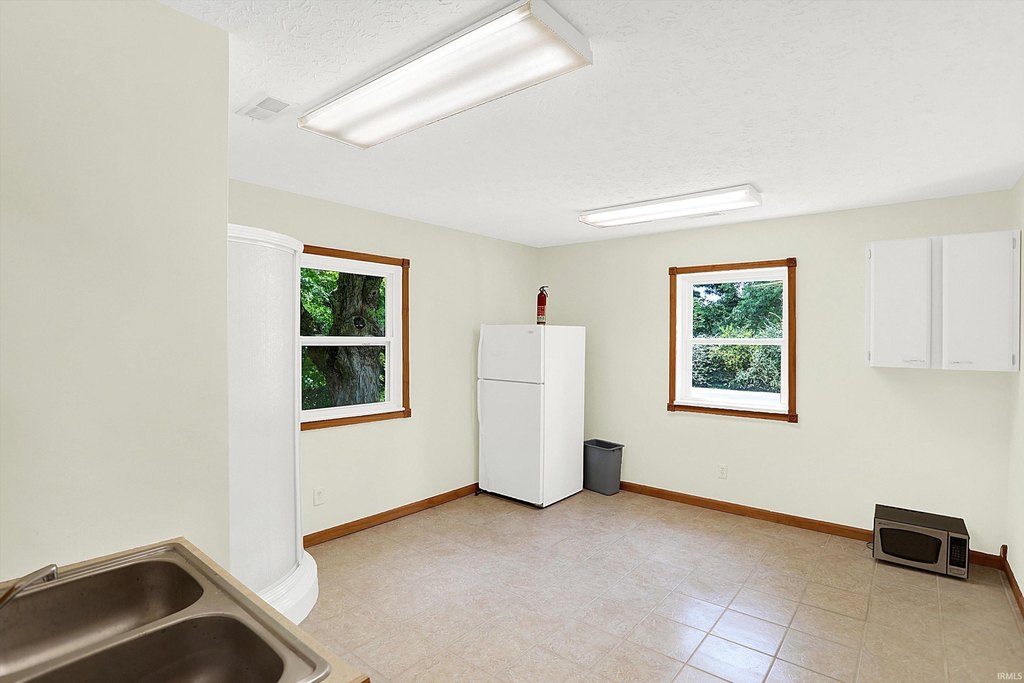
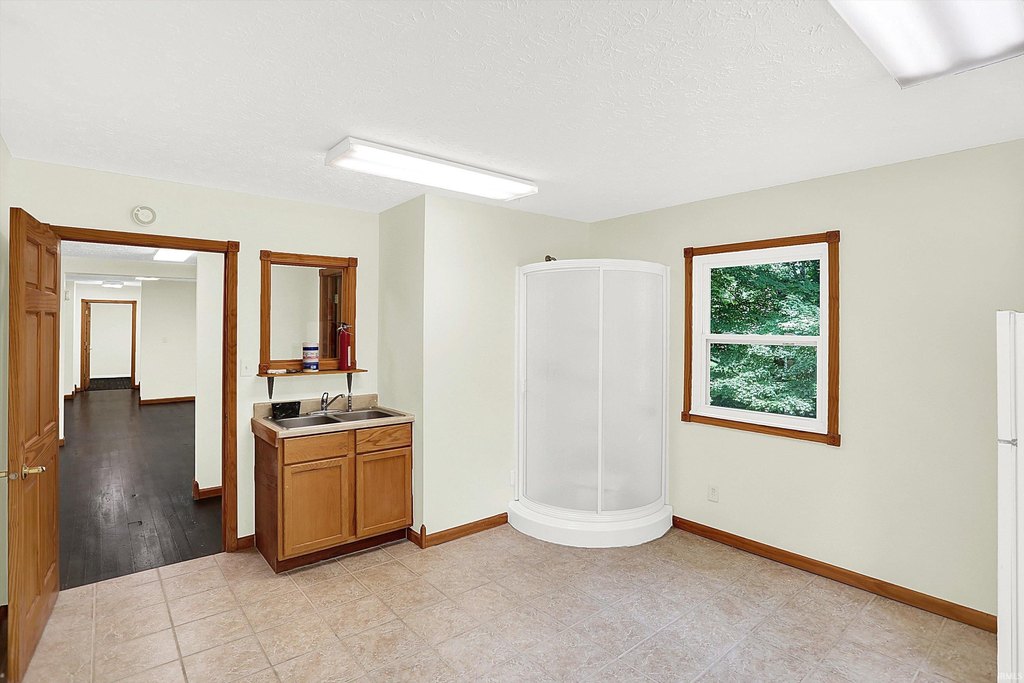
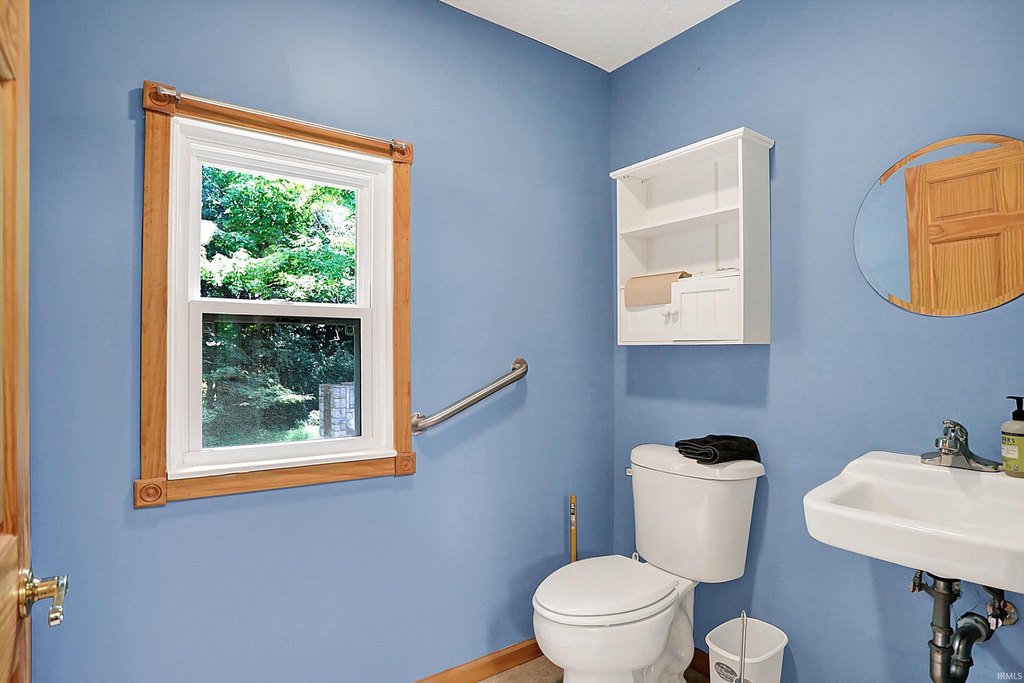
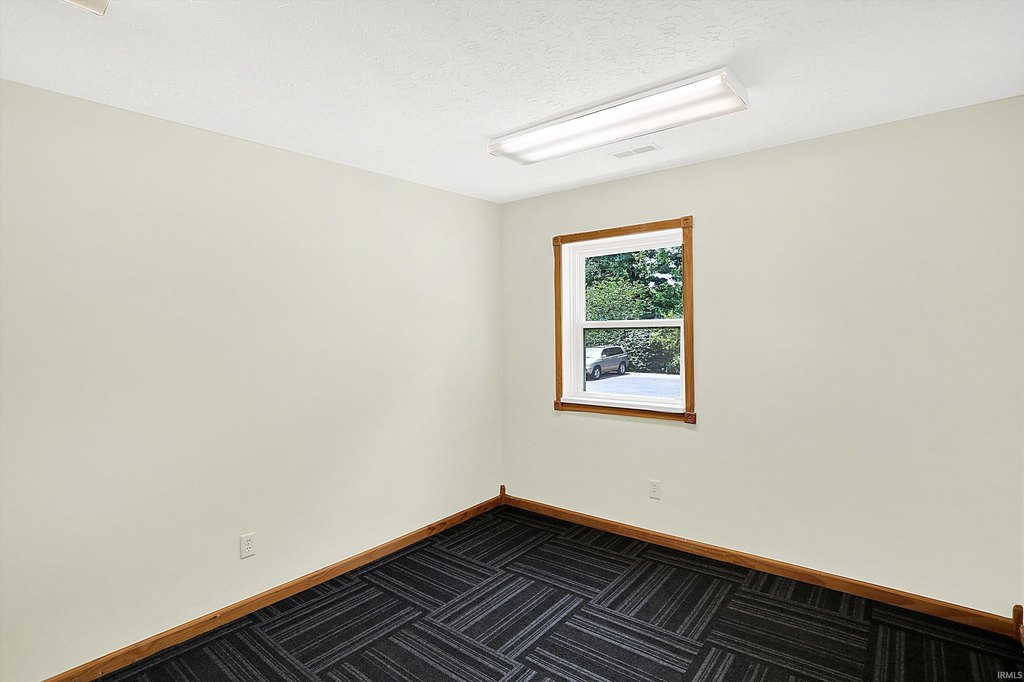
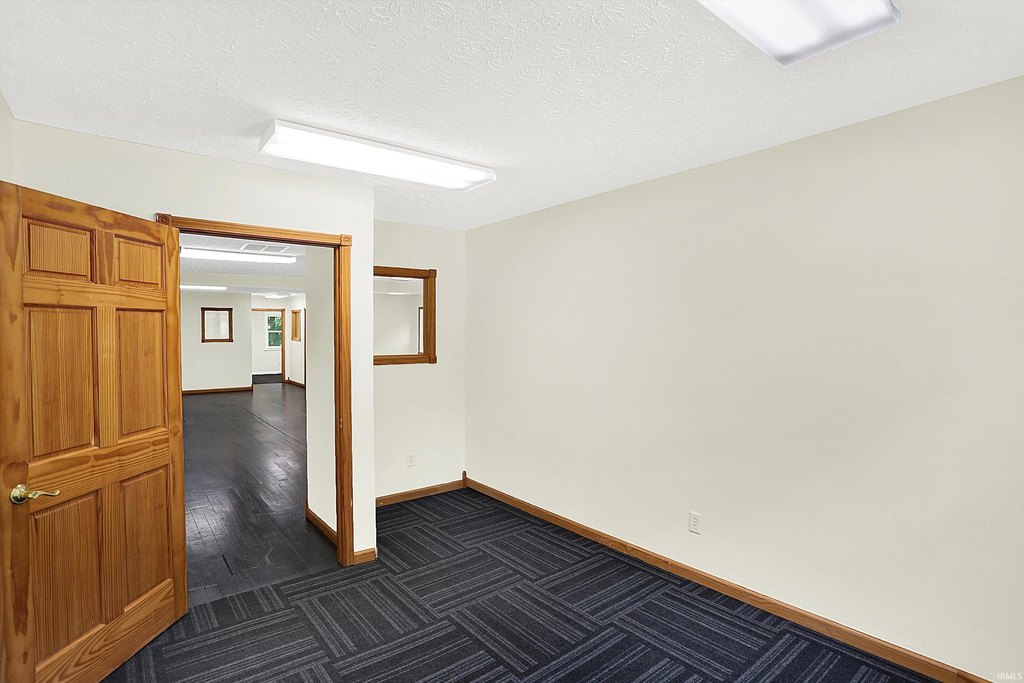
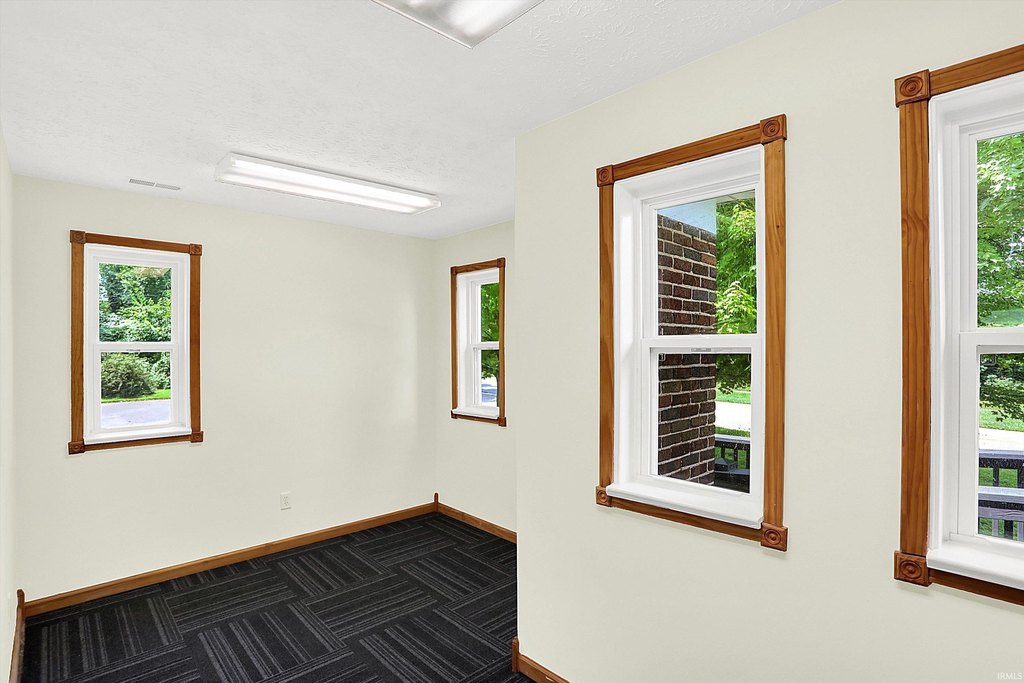
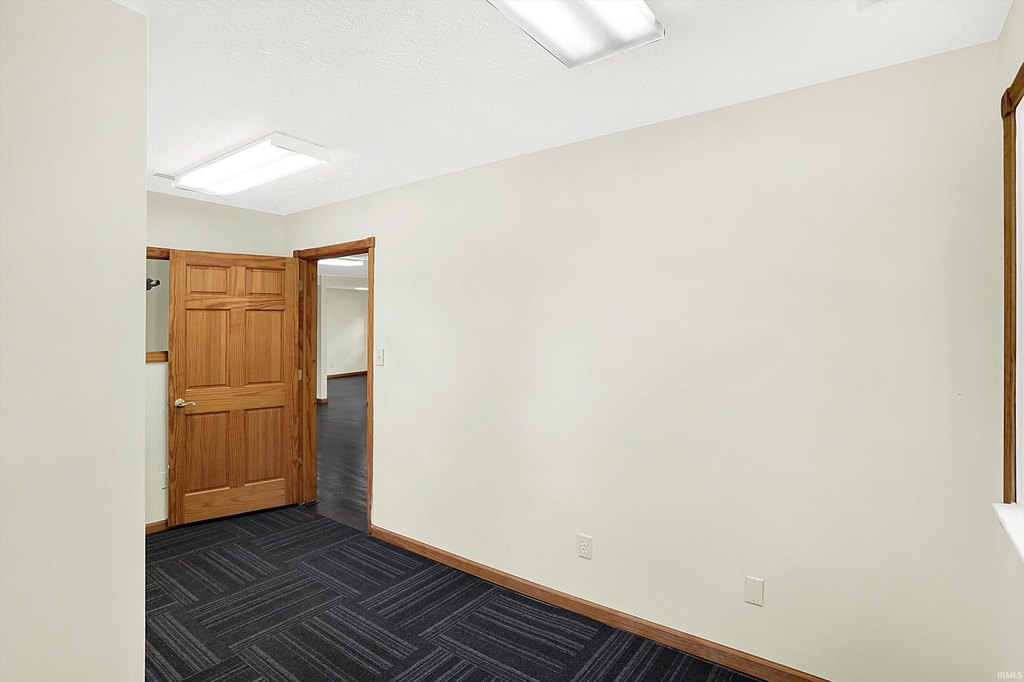
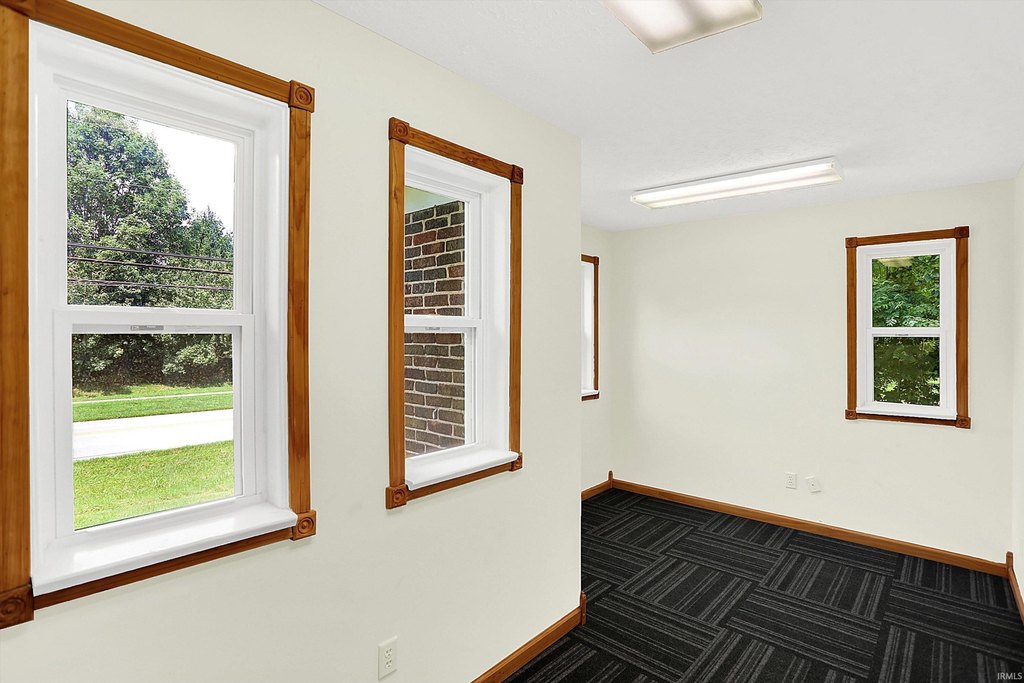
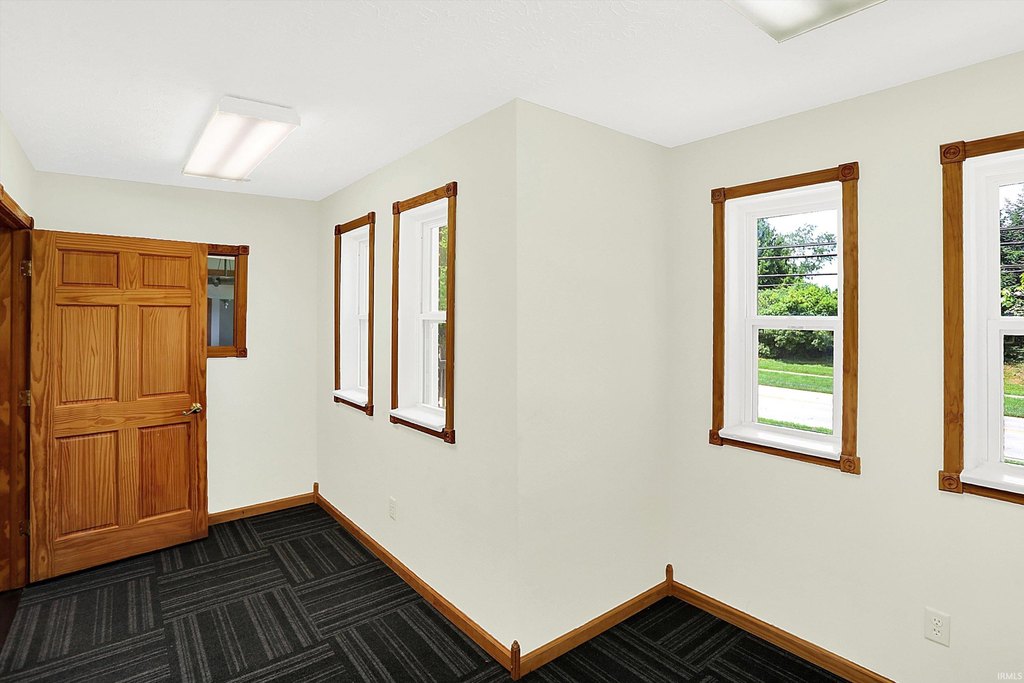
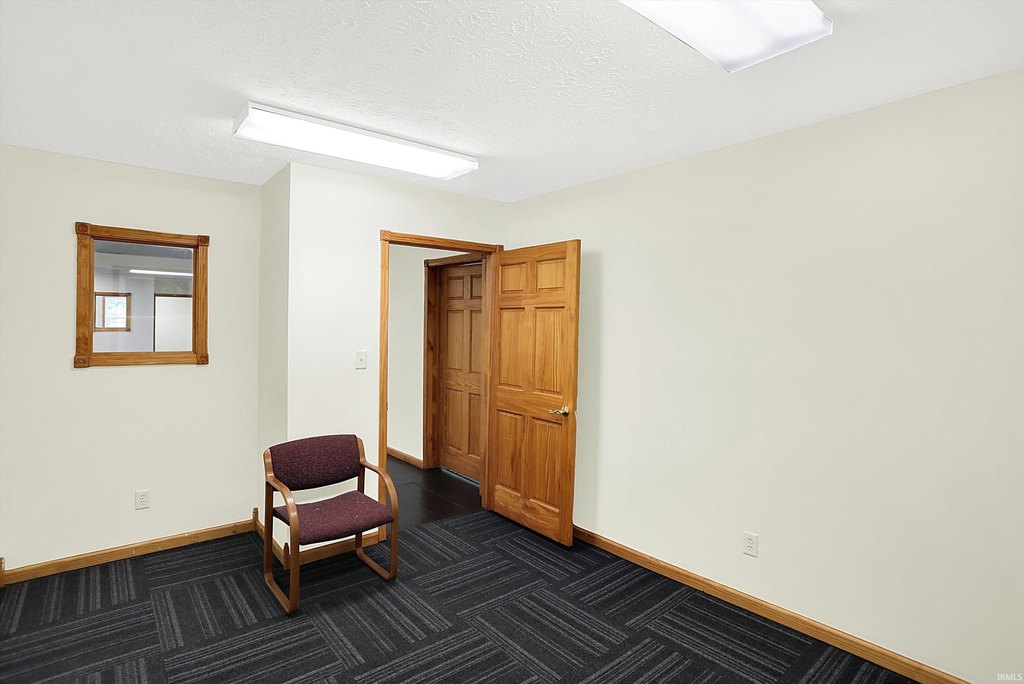
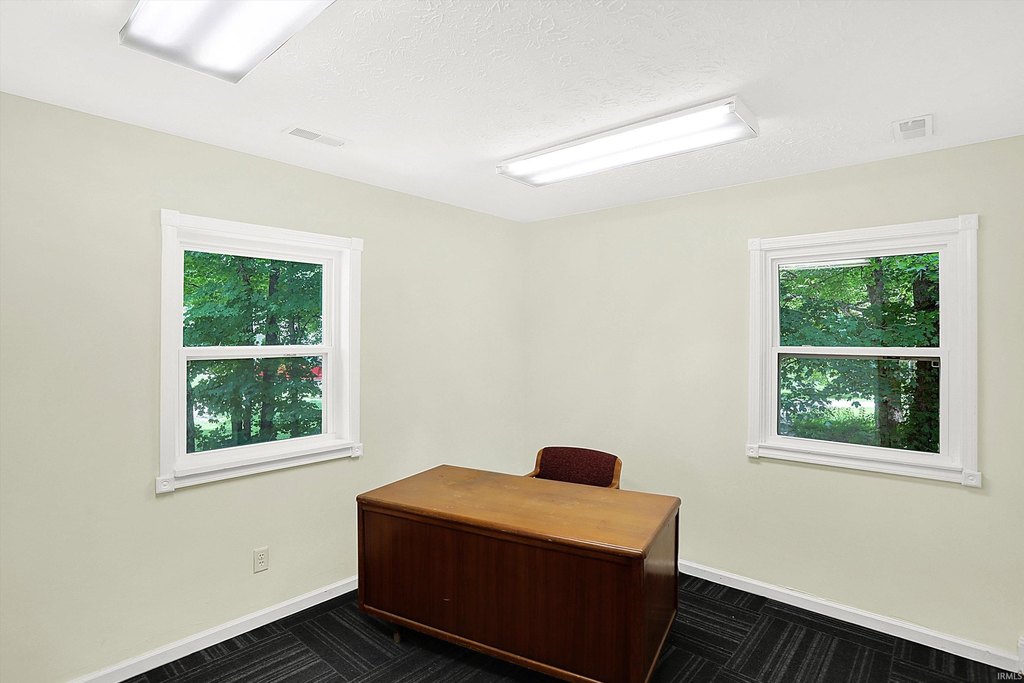
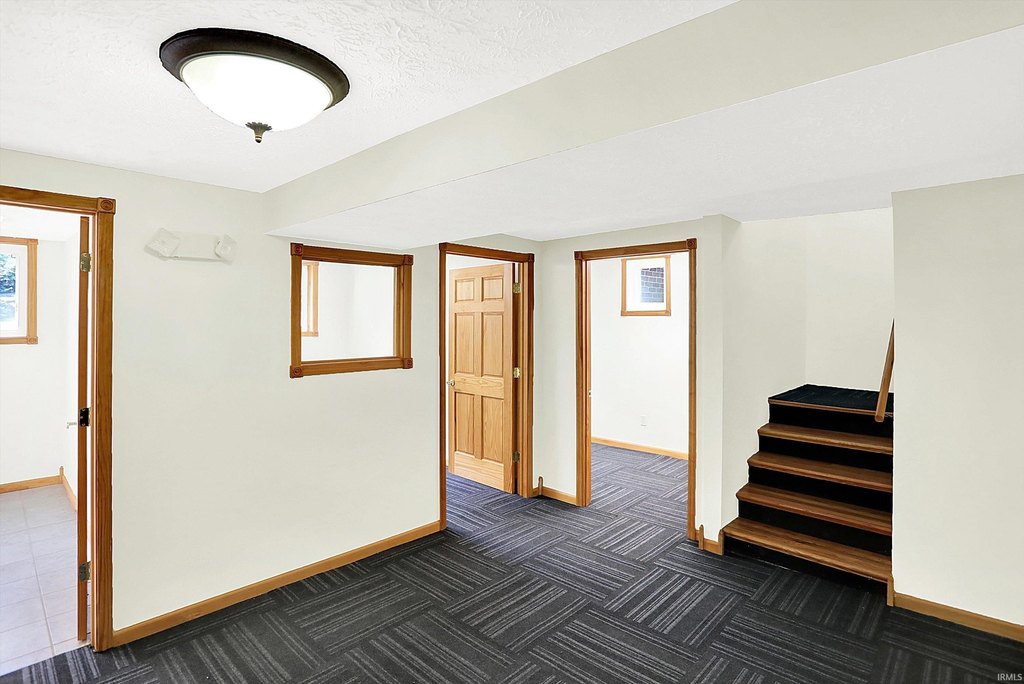
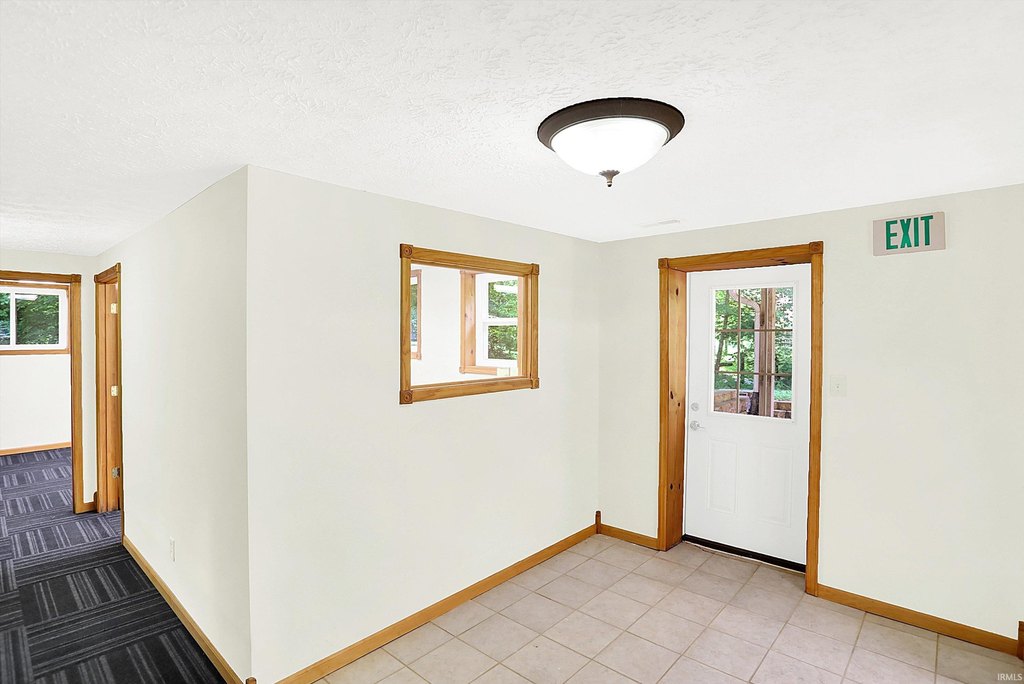
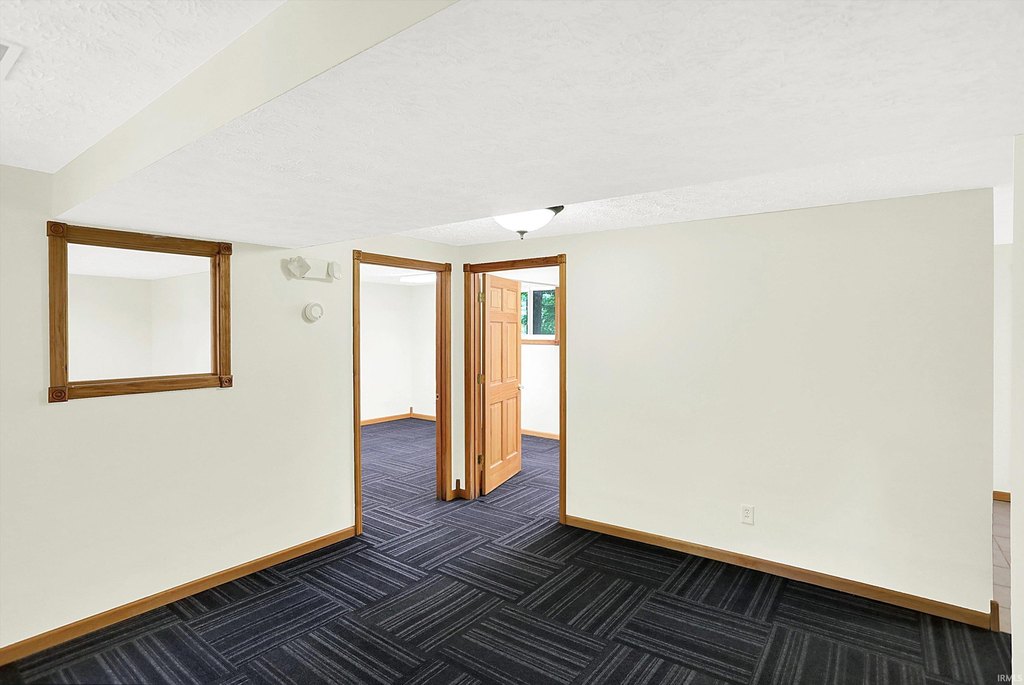
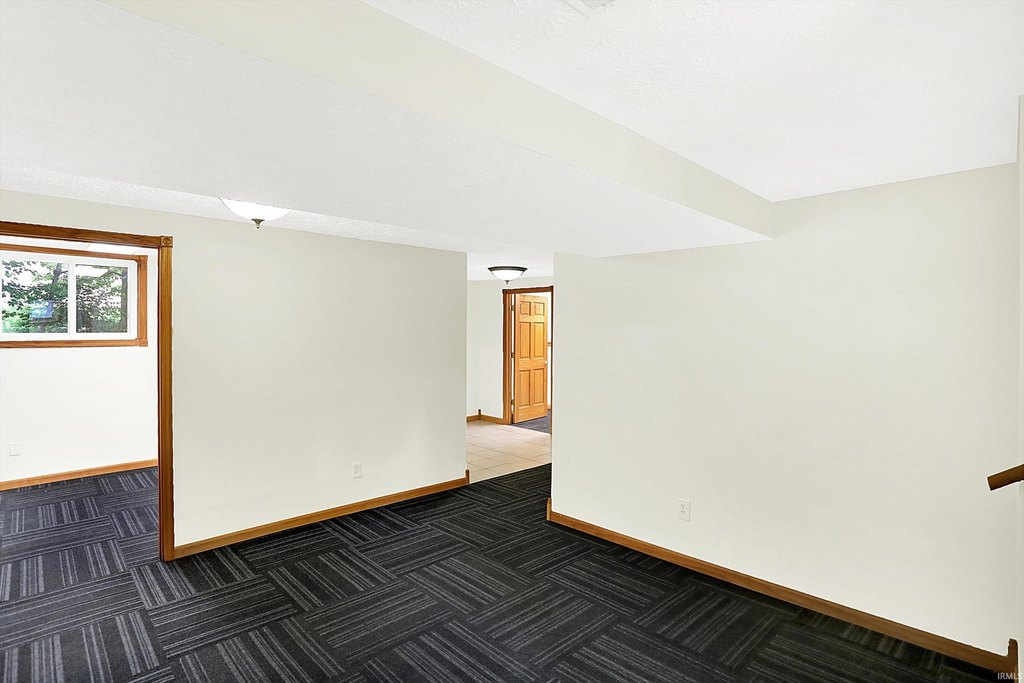
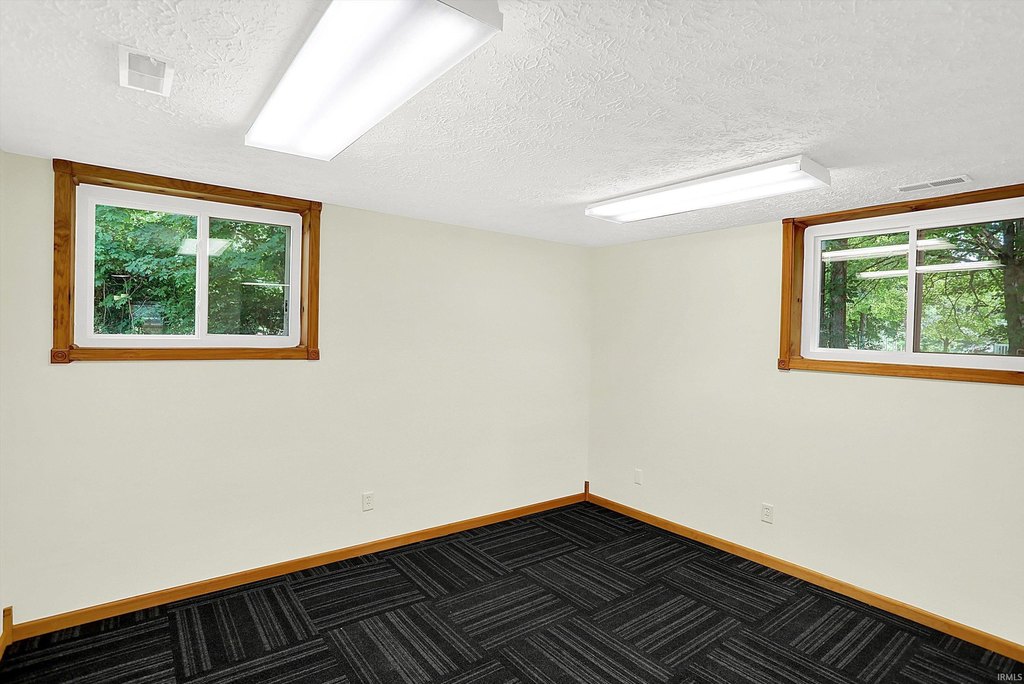
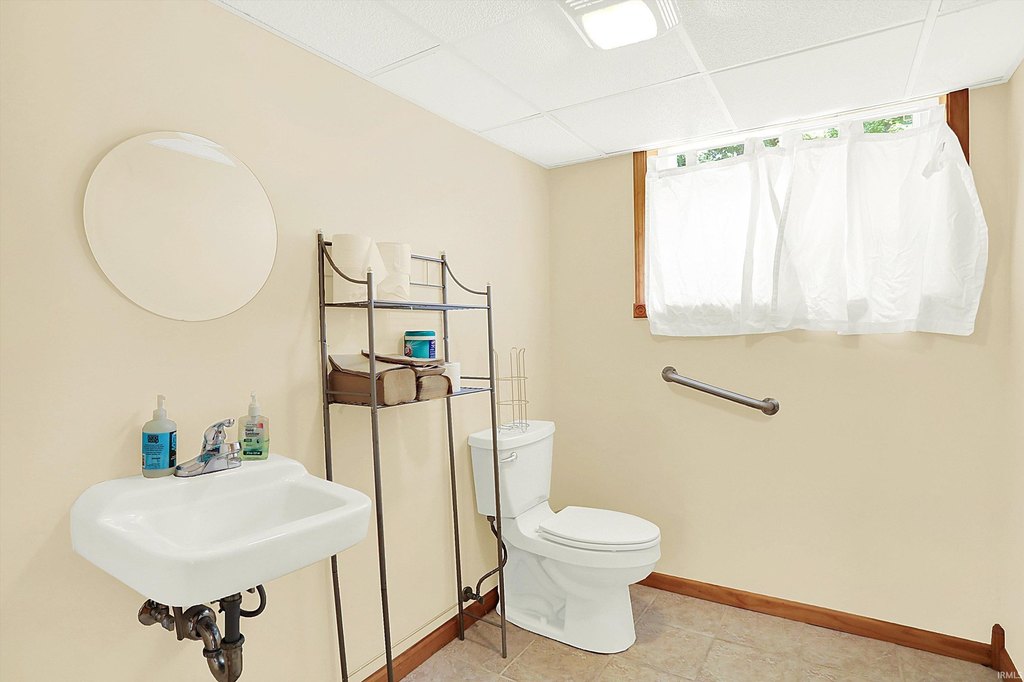
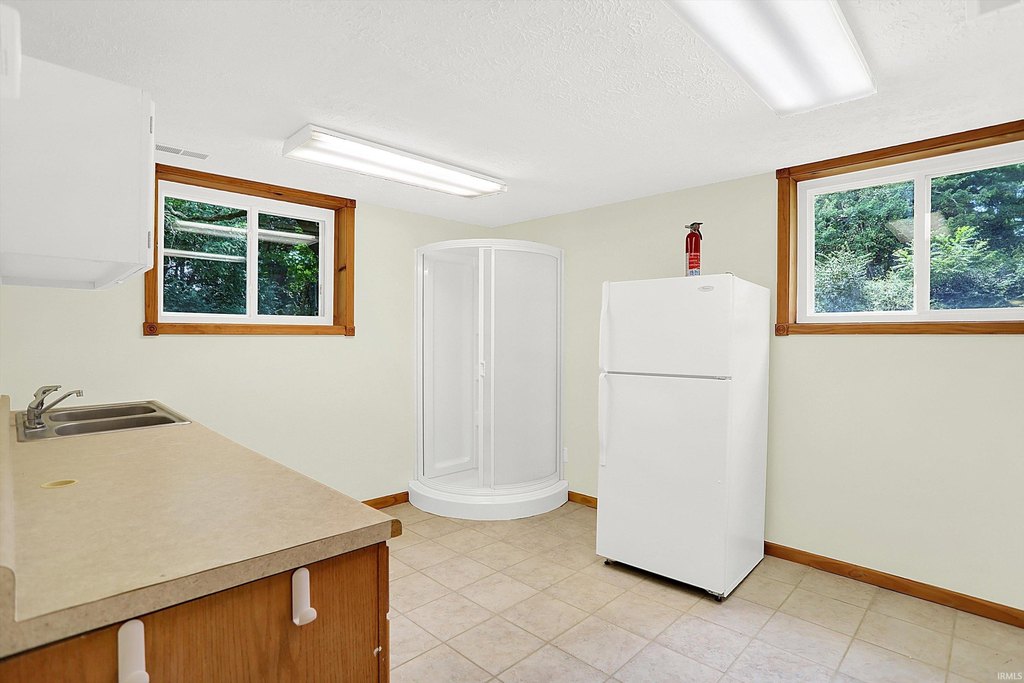
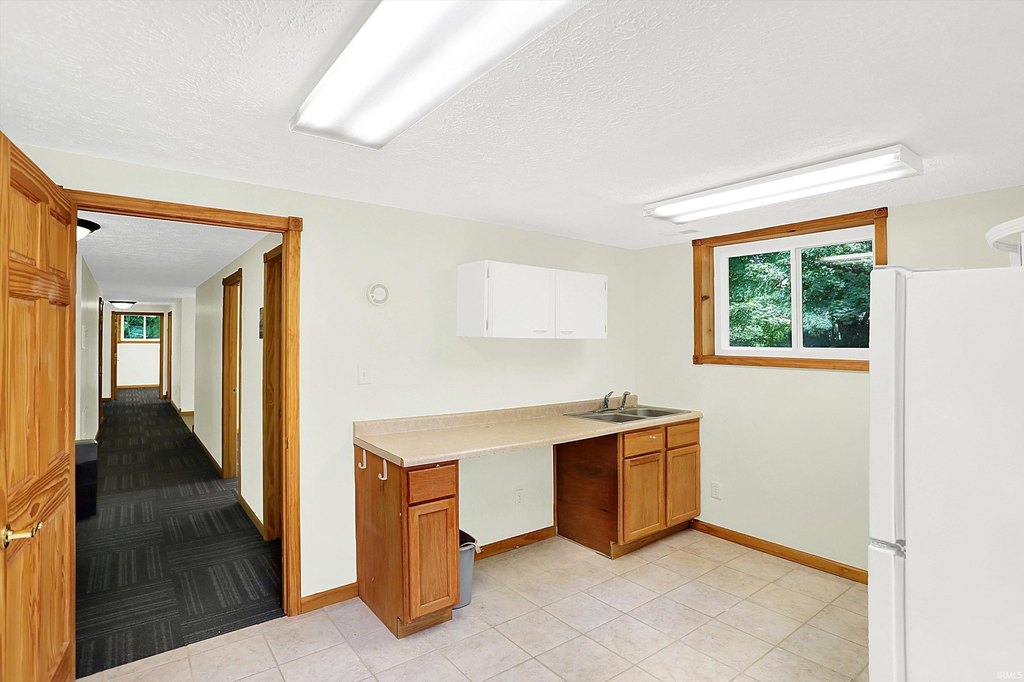
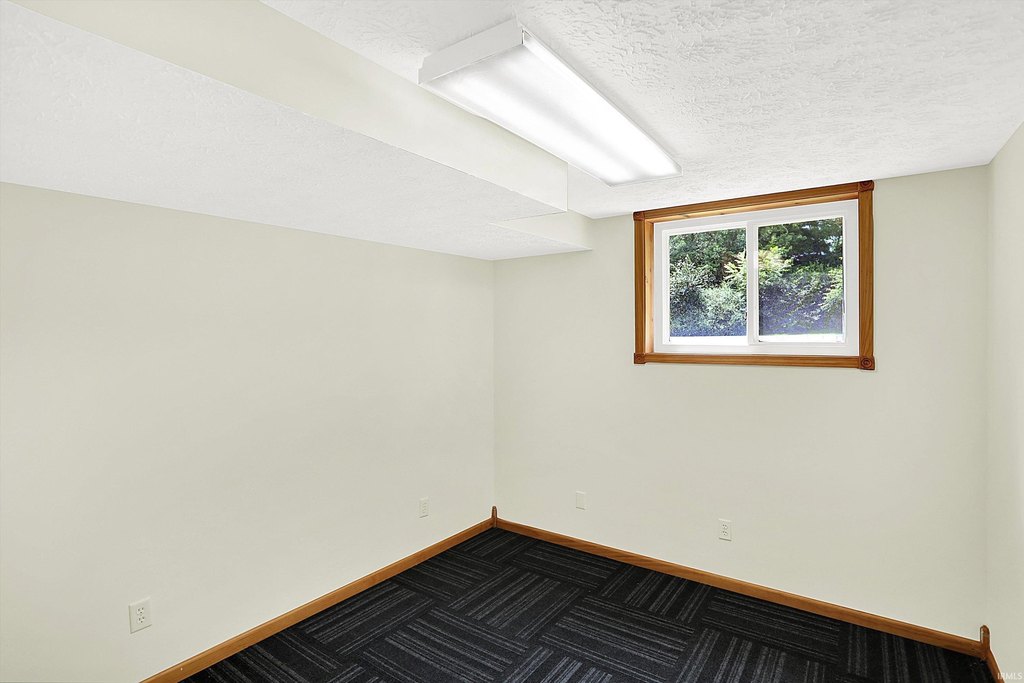
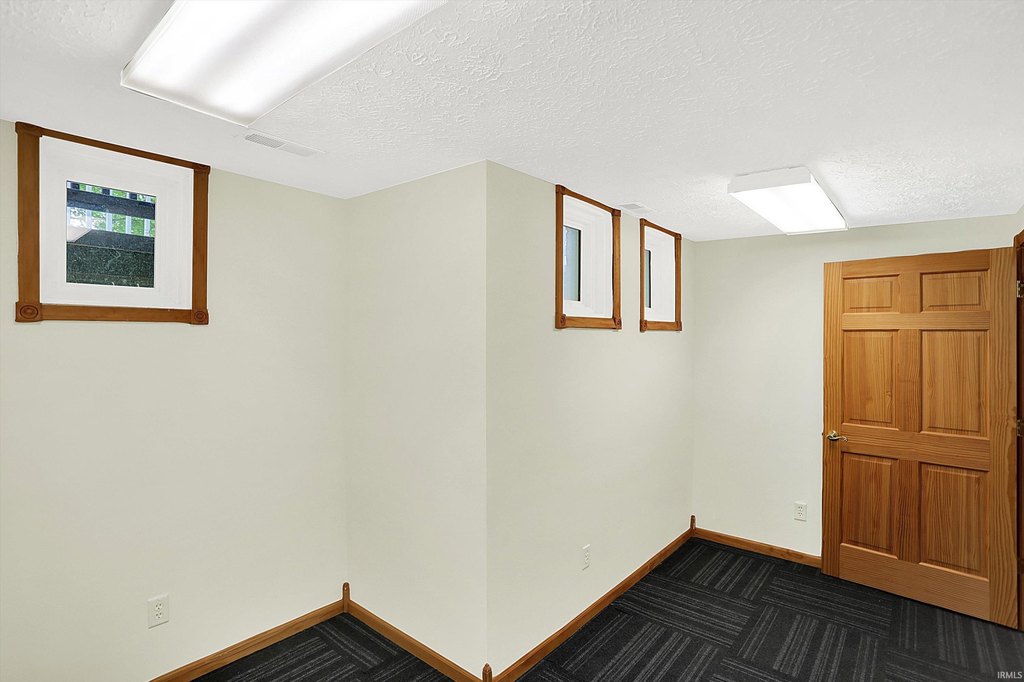
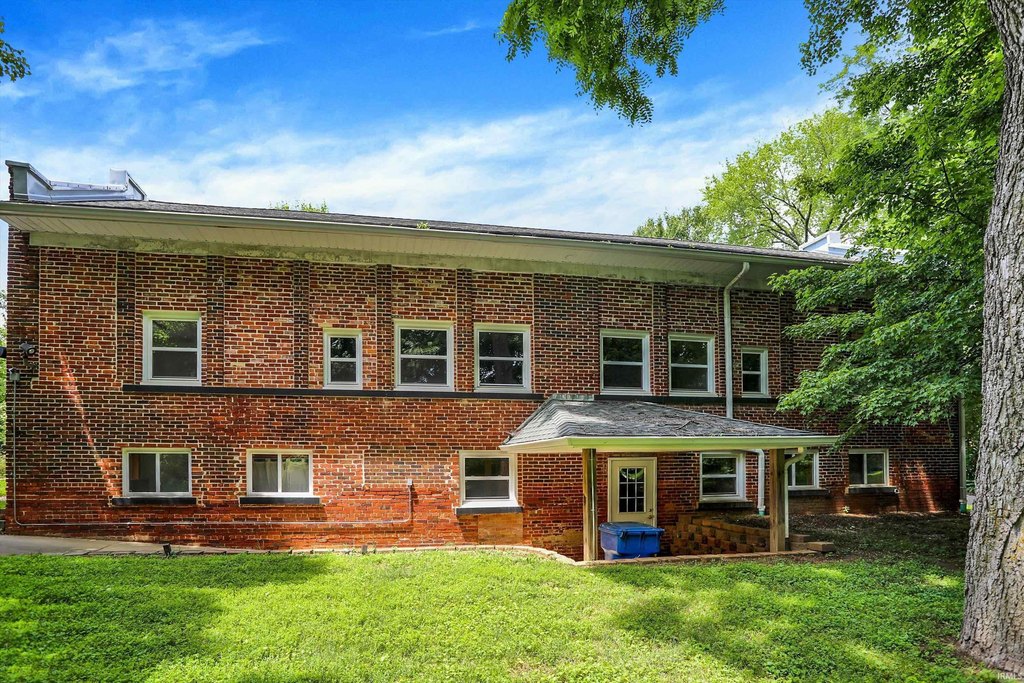
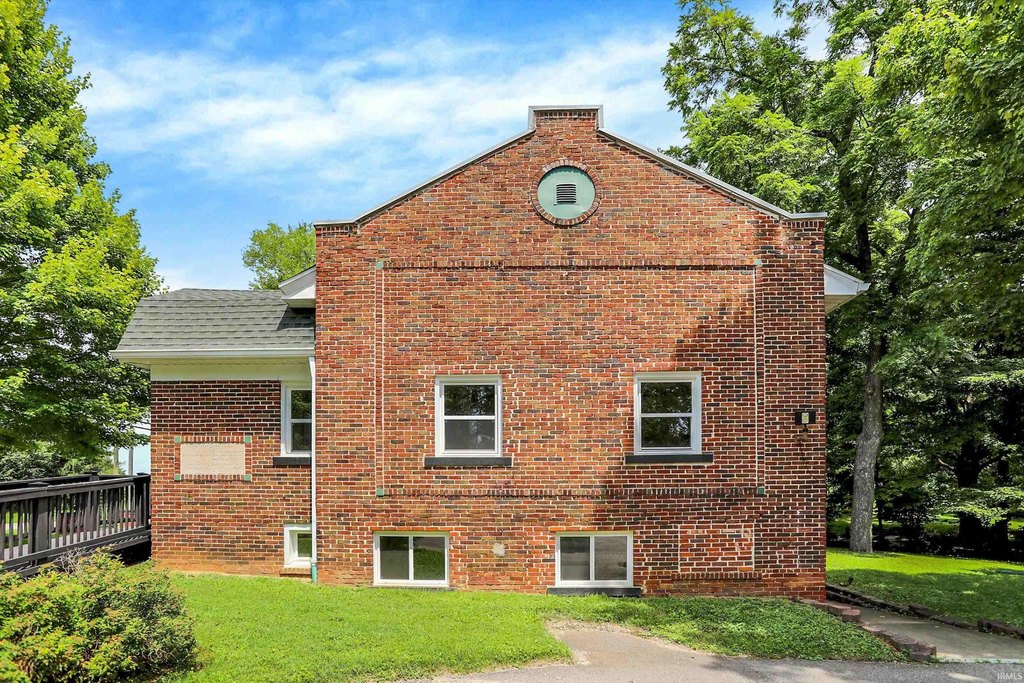
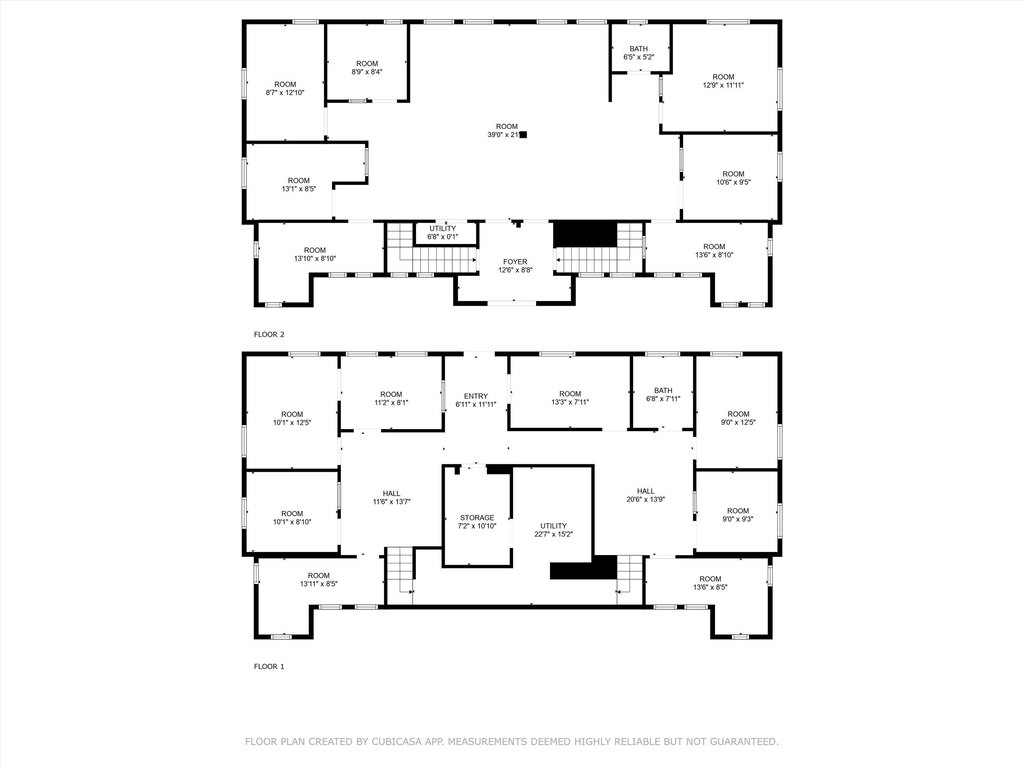
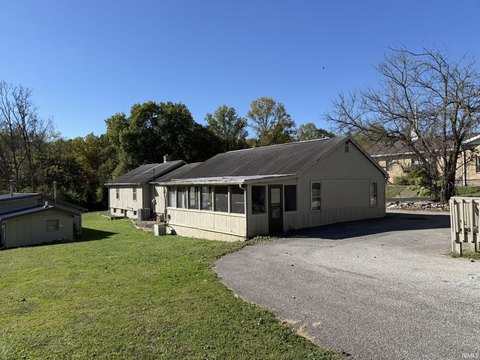
The historic Poplar Grove School provides 4,302 square feet of office-oriented space across two levels. The interior includes 10 office rooms, an open common area, storage, restrooms, kitchenettes, and a larger first-level open area with original hardwood flooring. More than 50 new windows bring natural light into the building, while new carpet, central air, wood flooring, and fiber internet through GigabitNow add to the existing improvements. Built in 1928, the property occupies 1.05 acres and includes more than 25 off-street parking spaces.
Located at 4638 E State Road 45 in Bloomington, the property is east of Indiana University and near IU Health Bloomington Hospital. Limited Business zoning supports the listed potential uses, including offices, daycare, retail, studio or gallery space, counseling, law, insurance, and related professional services.
Located at 4638 E State Road 45 in Bloomington, the property is east of Indiana University and near IU Health Bloomington Hospital. Limited Business zoning supports the listed potential uses, including offices, daycare, retail, studio or gallery space, counseling, law, insurance, and related professional services.
Key Highlights
- 4,302‑square‑foot historic schoolhouse built in 1928
- Two‑level layout with 10 office spaces, restrooms, kitchenettes, storage, and open areas
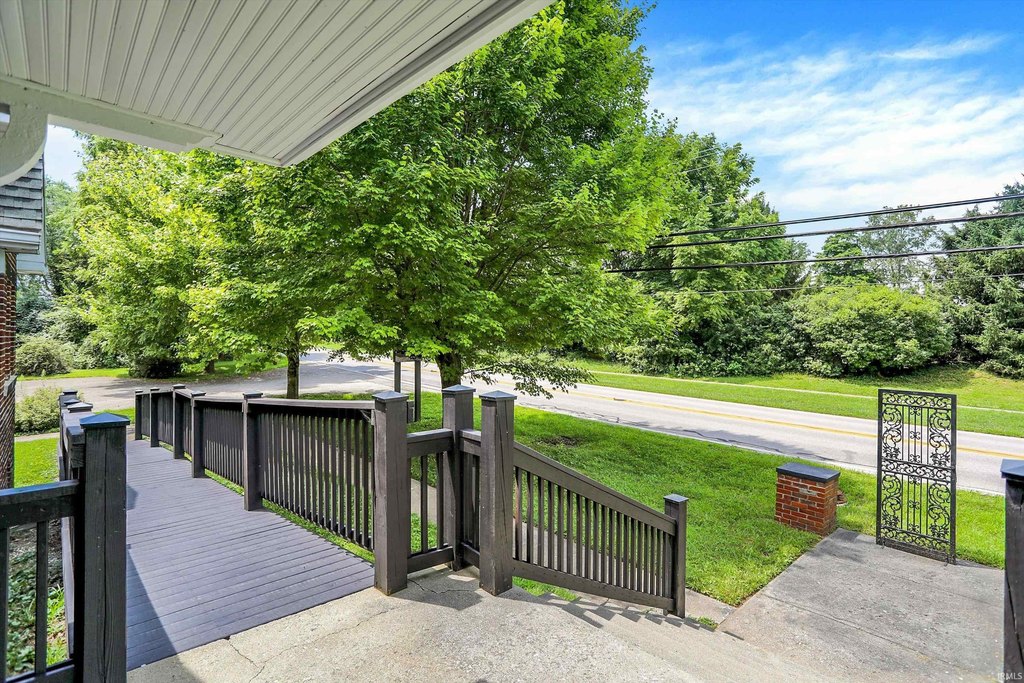
- 1.05‑acre property with more than 25 off‑street parking spaces
Financial Insights
Estimated NOI and Cap Rate
NOI / Yr
$46,198
Cap Rate
6.29%
Suggested Prices Based on Cap Rates
Cap Rate 5%
$923,960
$924.0K
Cap Rate 7%
$659,971
$660.0K
Cap Rate 9%
$513,311
$513.3K
Market Conditions
NOI Build-Up for 4,302 SF
Gross rent
$81.0K $18.84/SF
− Vacancy
−$19.5K −$4.52/SF
EGI
$61.6K $14.32/SF
− OpEx
−$15.4K −$3.58/SF
NOI
$46.2K $10.74/SF
Area
Monroe County, IN
Vacancy
24.00%
Lease Rate
$18.84 /SF/Yr
Expense Ratio
25.00%
Simulate Cap Rate and NOI
Suggested Prices Based on Cap Rates
Cap Rate 5%
$923,960
Cap Rate 7%
$659,971
Cap Rate 9%
$513,311
Alternative Uses
Best Use
Office B
$660.0K
$577.5K – $770.0K
NOI $46,198 @ 7.0% cap · market cap 6.29%
Second Best
—
—
no second resolved use
Theoretical Best
Office A
$840.8K
$735.7K – $980.9K
NOI $58,854 @ 7.0% cap · market cap 8.01%
Zoning and permitted uses should be independently verified with authorities.
Property Analytics
Unlock full access to Insights
Subscribe to Realmo Intelligence
Open Analytics
Current Use
Lease Details
10
Office units
Location Intelligence
Trade Area within ½ mile
43
Businesses Nearby
Explore this area
Business Placement
Demographics for 47408, IN
22,917
Population
10,456
Households
2.2
Avg Household Size
28
Median Age
59%
College-Educated
98%
High-School Grad
64.4 sq mi
ZIP Area
356
Density / Sq Mi
$45,584
Median Household Income
$15,819
Median Earnings
$1,177
Median Rent
$304,600
Median Home Value
Check the figures for this property
Cap Rate, Value Estimation, Potential NOI and more
View Realmo Analytics
Market
Vacancy Rate% for Office in Midwest region

Questions? Ask Rey
Realmo’s AI knows this listing — price, zoning, demand, history. Ask anything.


Frequently Asked Questions
What type of property is this?
Office building - Limited Business zoning and a two-level layout accommodate office, retail, studio, and service-oriented uses.
Where is this office building located?
The property is located at 4638 E State Road 45 Bloomington, IN.
What is the asking price?
The asking price for this property is $735,000.
What are key features of this property?
This property features: 4,302‑square‑foot historic schoolhouse built in 1928; Two‑level layout with 10 office spaces, restrooms, kitchenettes, storage, and open areas; 1.05‑acre property with more than 25 off‑street parking spaces


