Waterfront Restaurant and
For Sale
$1,800,000
4168 W Houghton Lake Drive, Houghton Lake, MI 48629
Commercial Sale, Houghton Lake, MI
Property Size8,420 SF
Price / SF$213.78
Days on Market74
Property Features for 4168 W Houghton Lake Drive
General Information
Property type
Commercial Sale
Property subtype
Other
Zoning
Commercial
Parking features
Parking Lot
Subdivision
T22N R3W
Directions
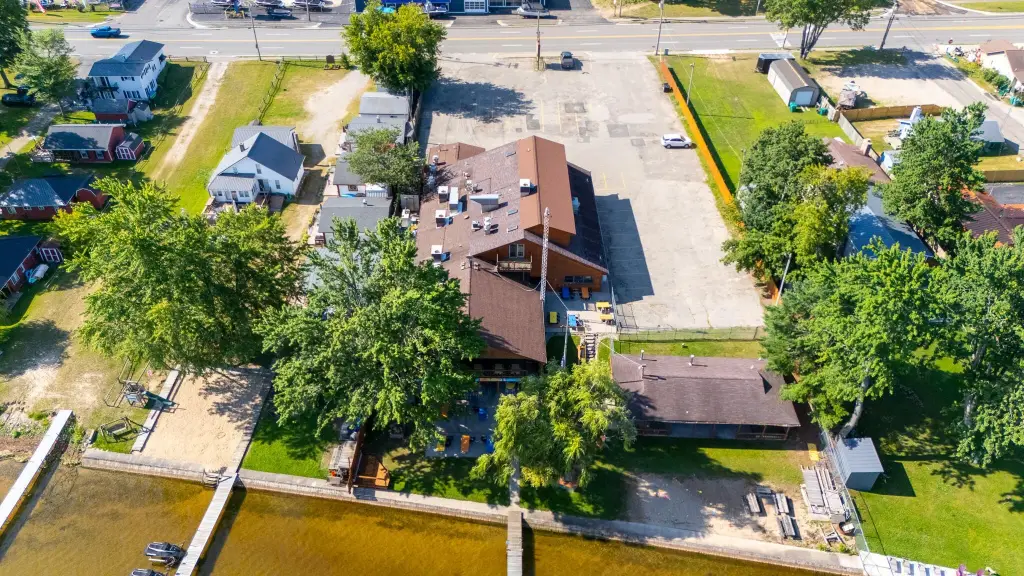
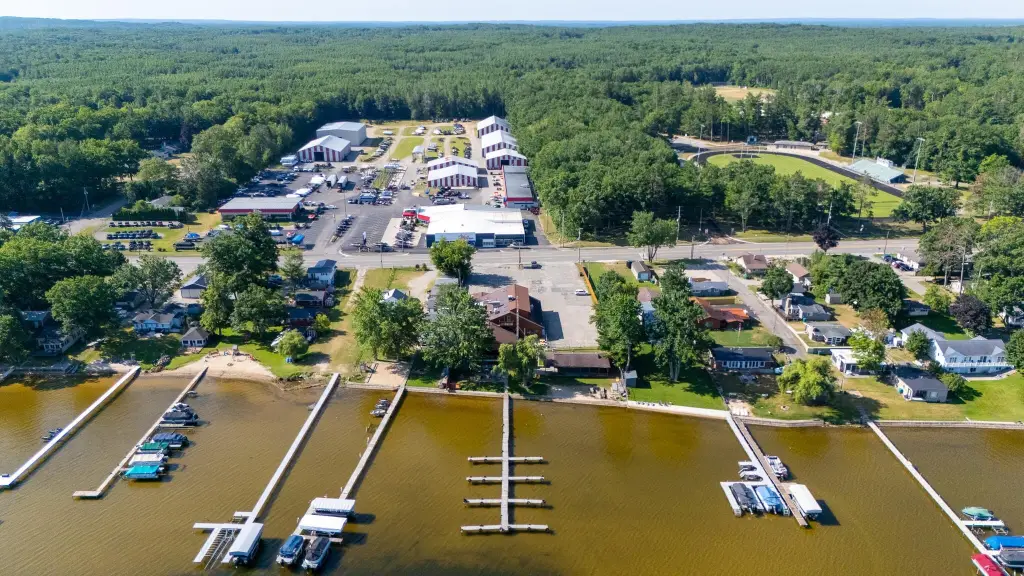
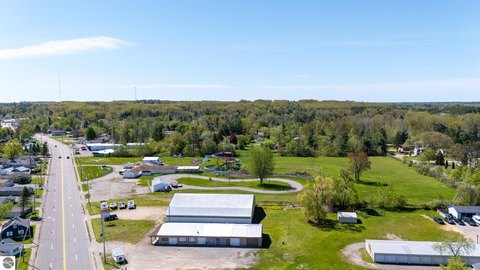
Highway M55 South Shore of Houghton Lake directly across from Spicers Boat City Marina
Standard status
Active
APN
003-440-010-1001
Size
8,420 SF
Taxes and HOA fees
Tax Description
L1164/P2394 L928/P692 L900/P11 L890/P266 L420/P292 223 LOT 10 -.81 A KILLCARE RESORT AND ALL LAND THAT LIES W OF W LINE OF LOT 10 KILLCARE RESORT AND 141 FT E OF AND PARALLEL TO E LINE OF DETROIT ST EXT FROM N LINE OF M-55 TO S SHORE OF LAKE BEING 10.7 FT
Legal Description
L1164/P2394 L928/P692 L900/P11 L890/P266 L420/P292 223 LOT 10 -.81 A KILLCARE RESORT AND ALL LAND THAT LIES W OF W LINE OF LOT 10 KILLCARE RESORT AND 141 FT E OF AND PARALLEL TO E LINE OF DETROIT ST EXT FROM N LINE OF M-55 TO S SHORE OF LAKE BEING 10.7 FT
Utilities
Water source
Well
Water front
1
Amenities
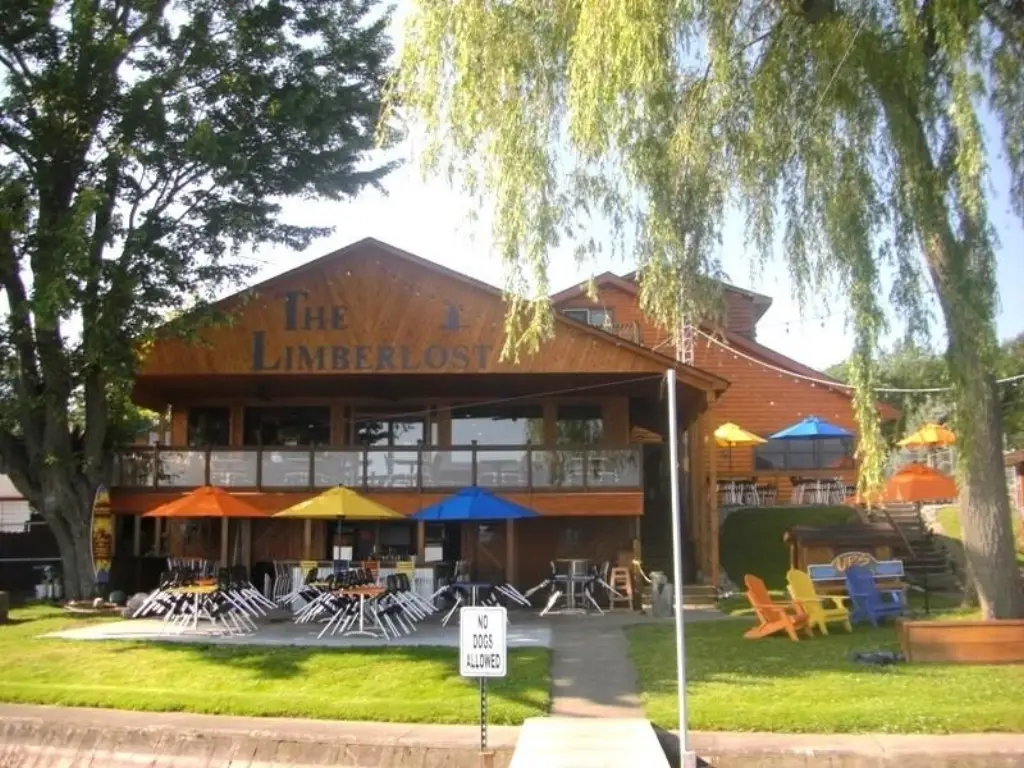
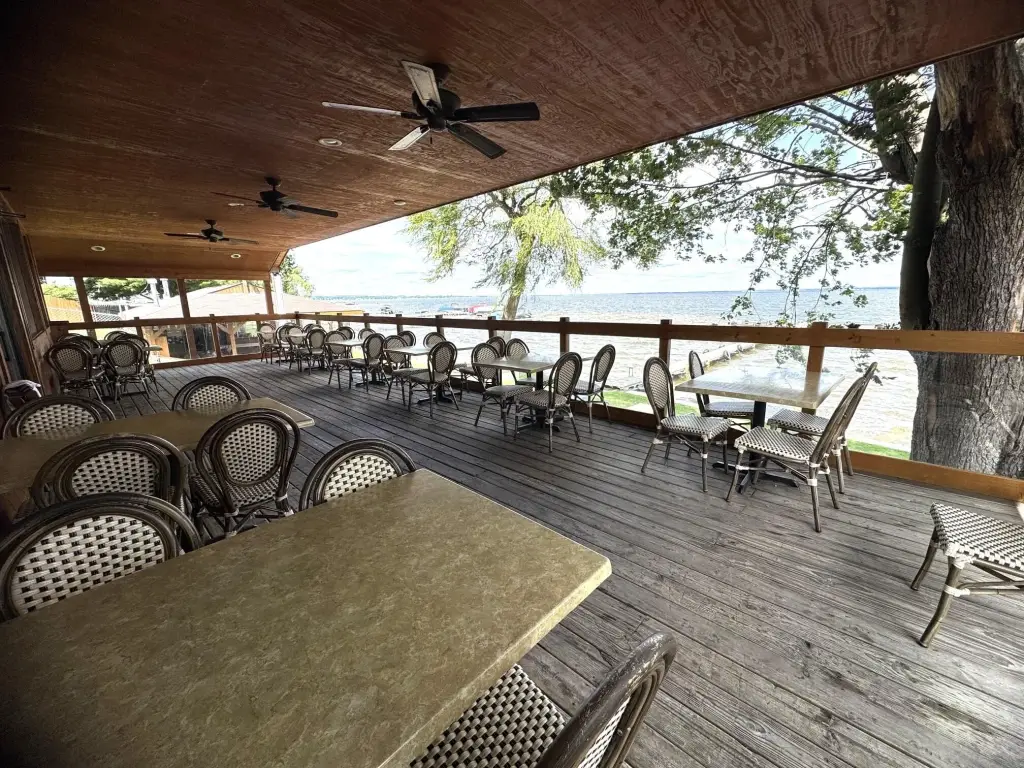
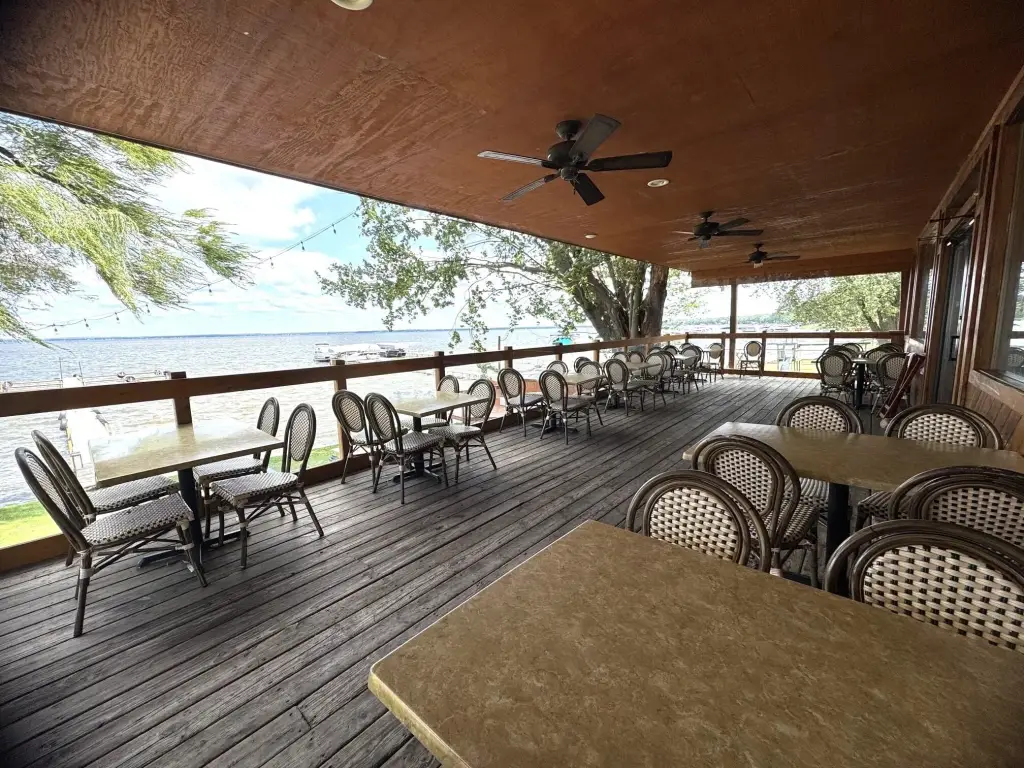
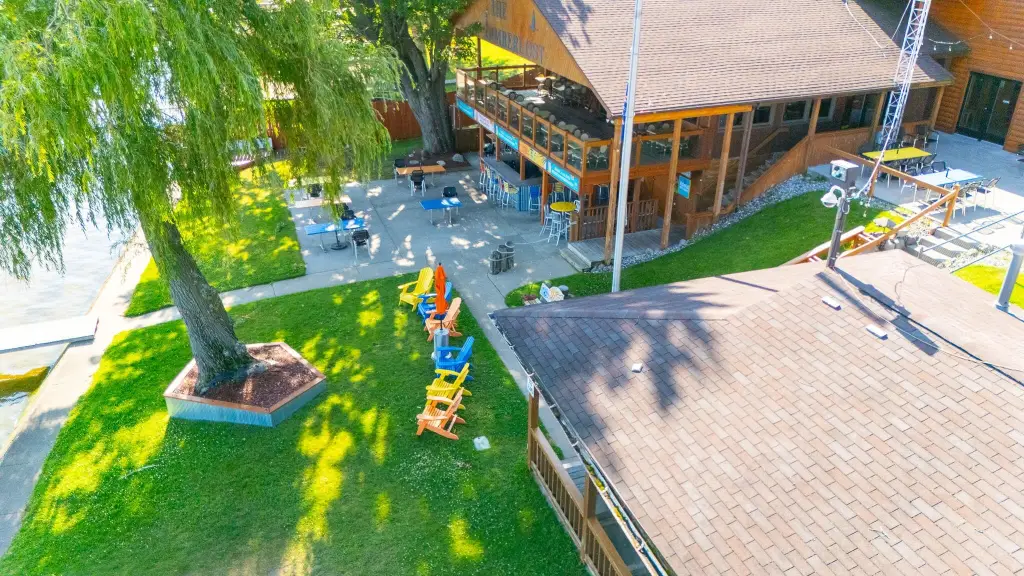
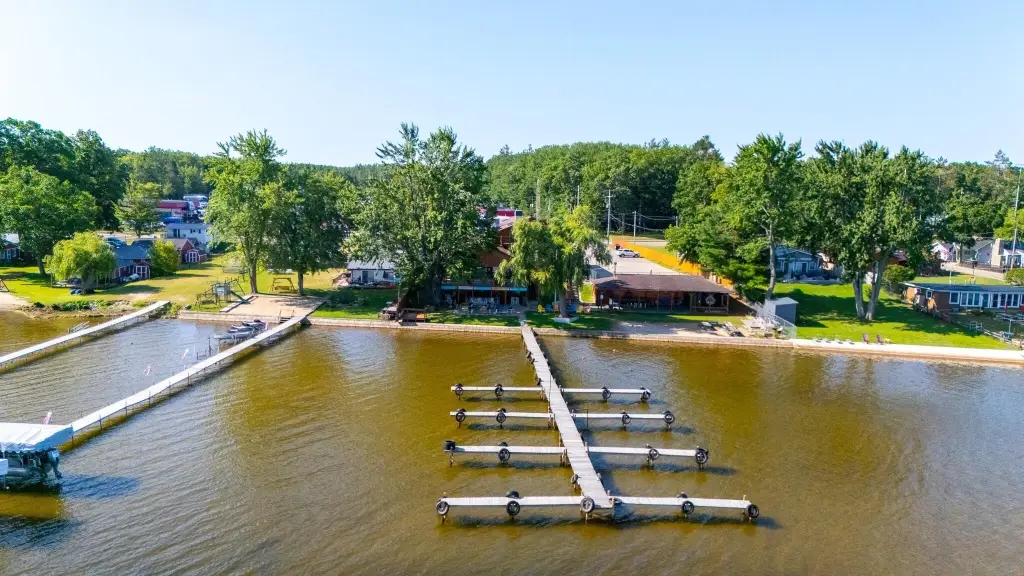
lakeside balcony
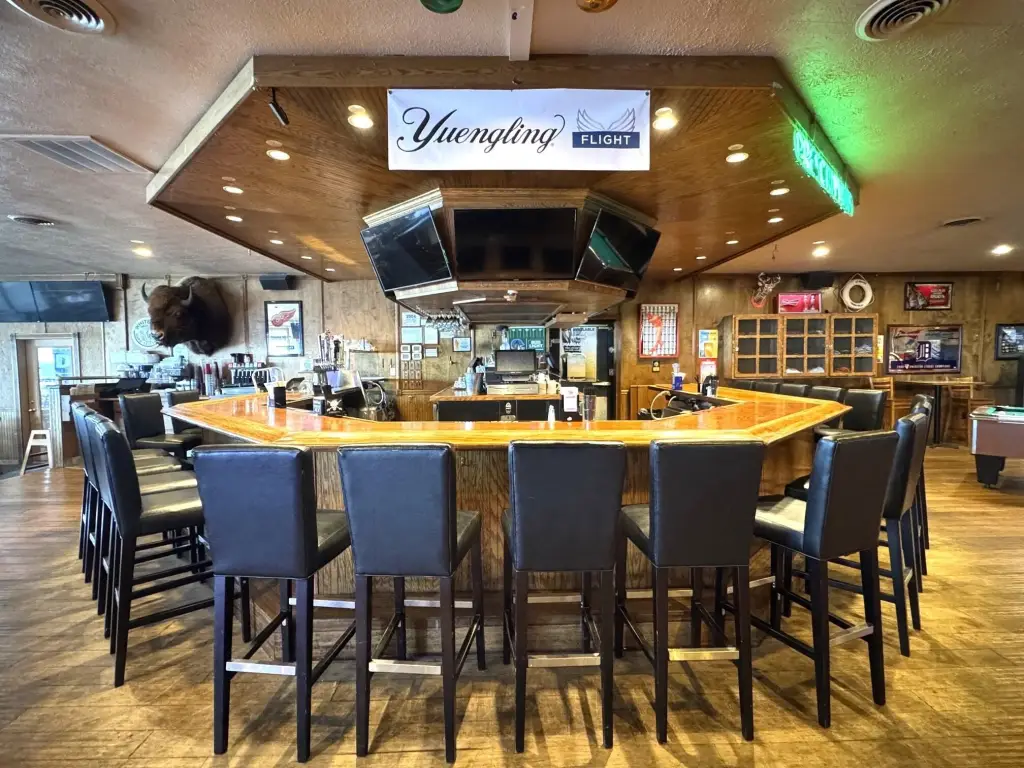
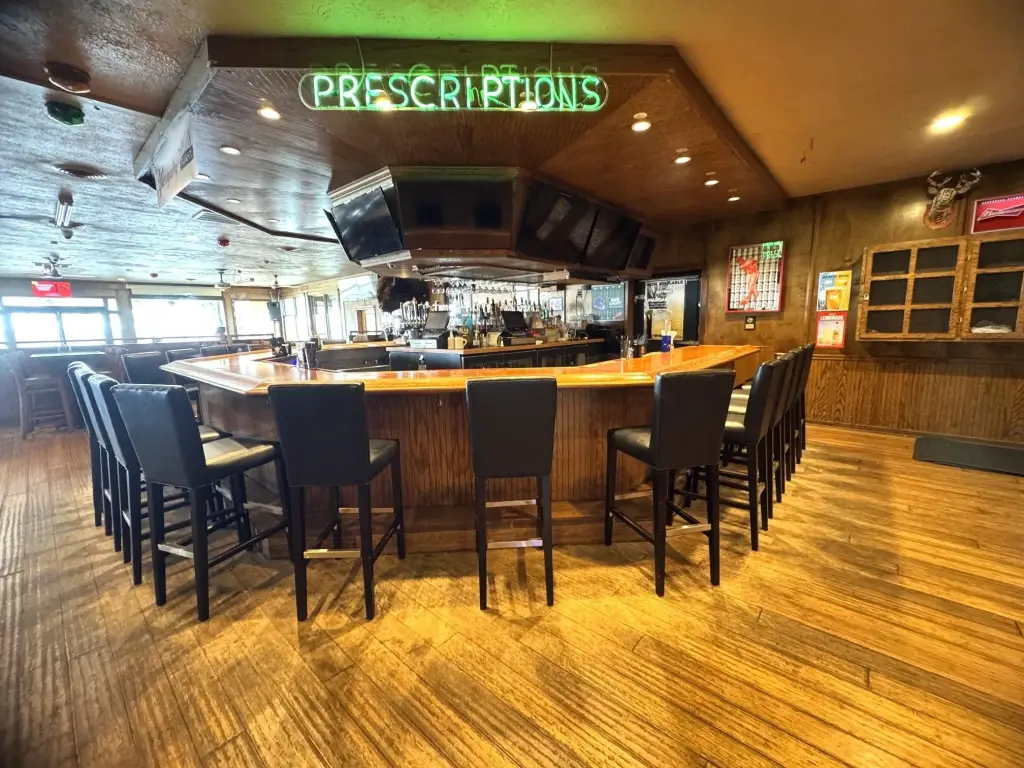
flat-screen televisions
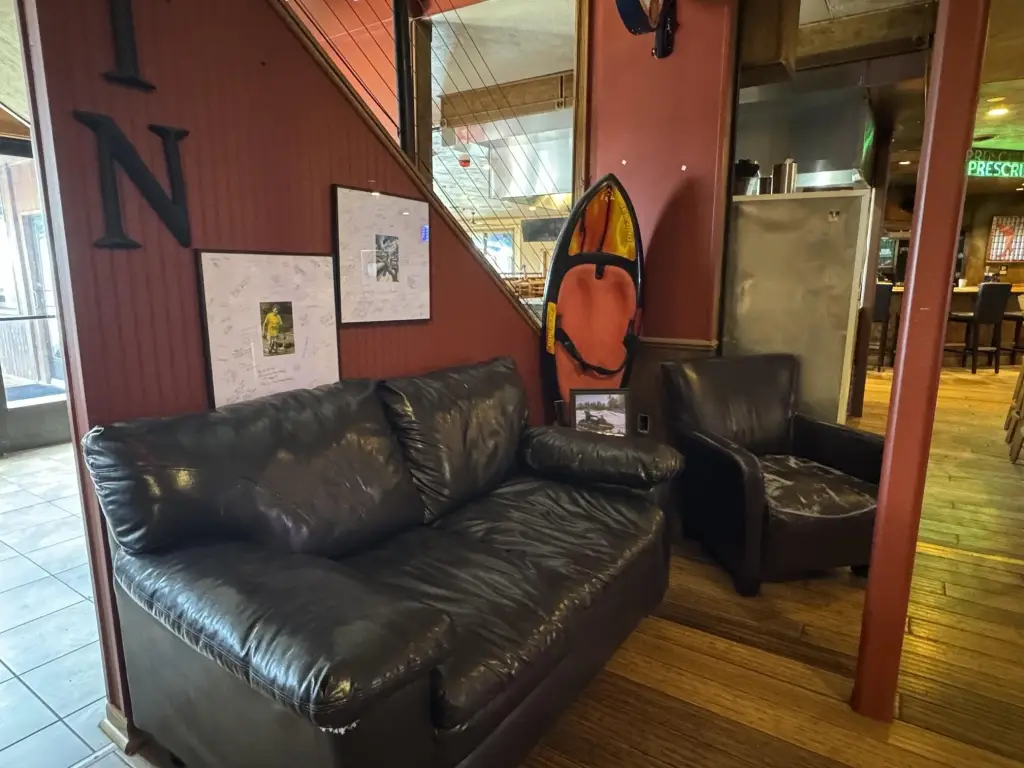
leather-furnished lounge area
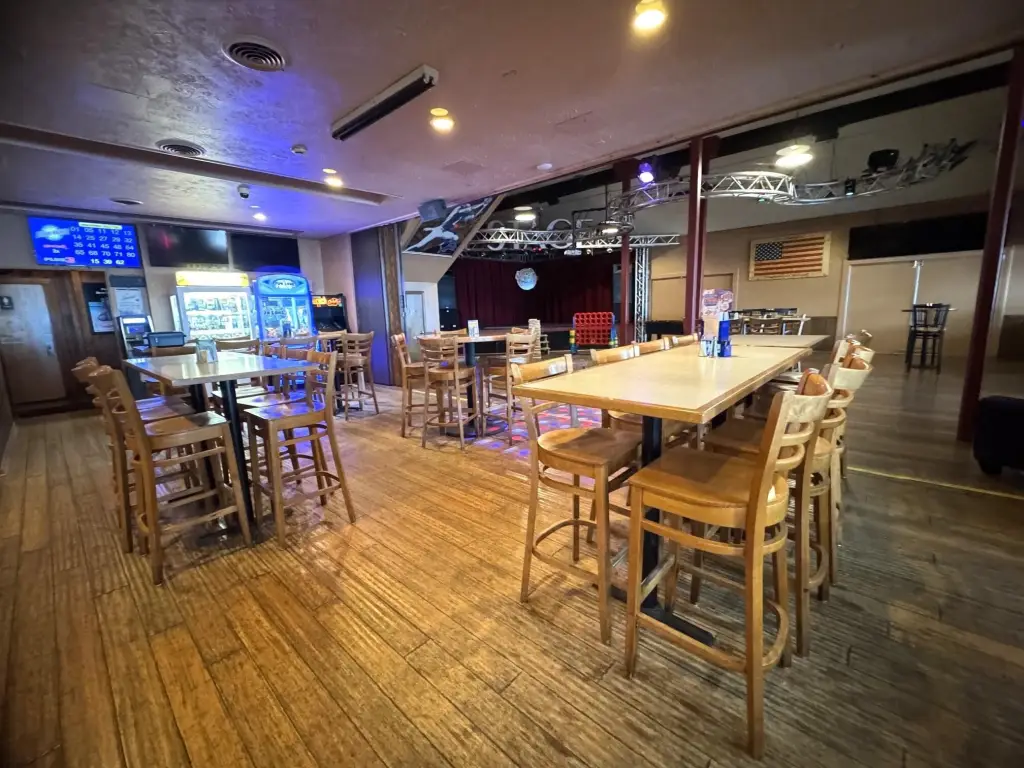
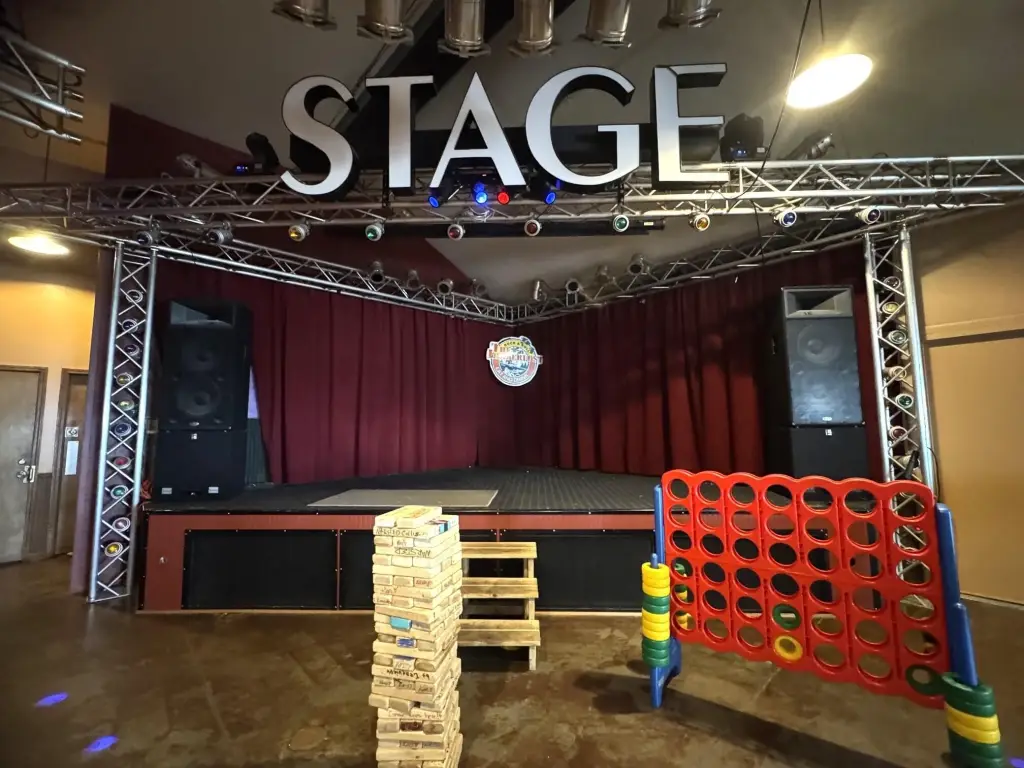
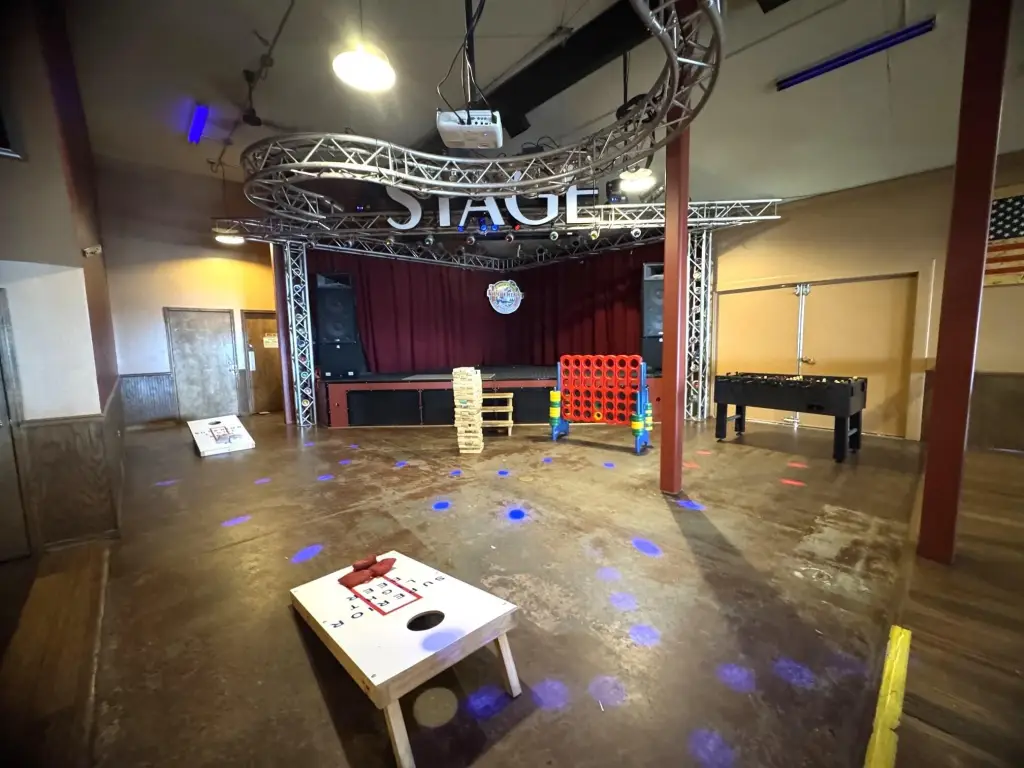
entertainment stage
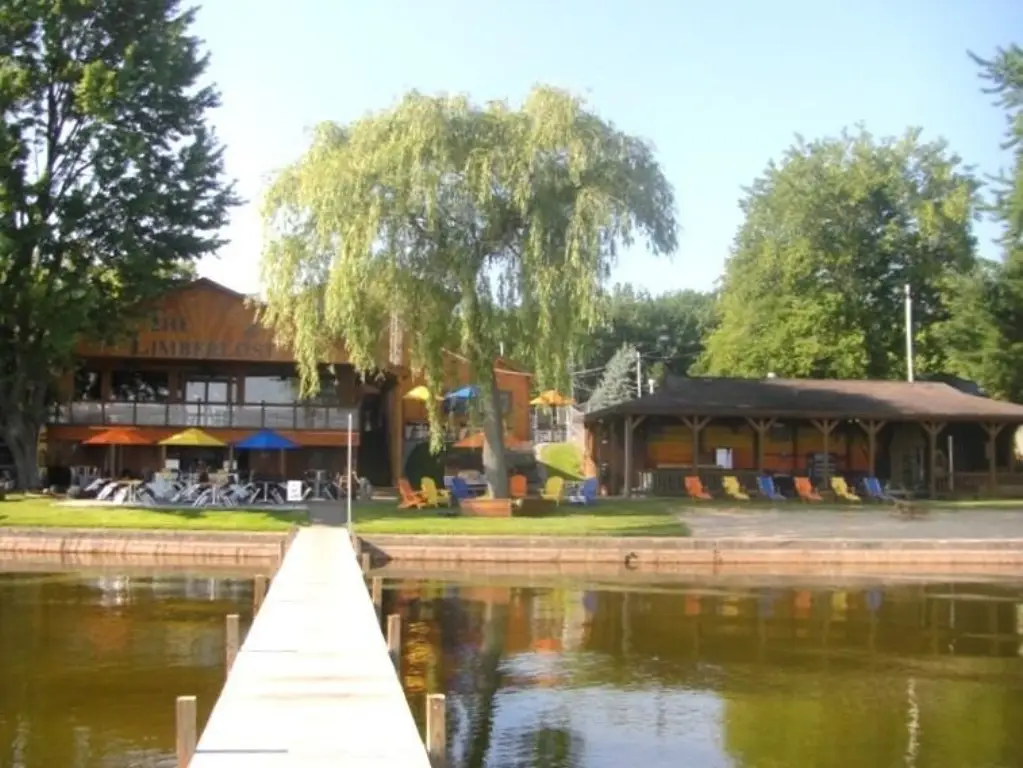
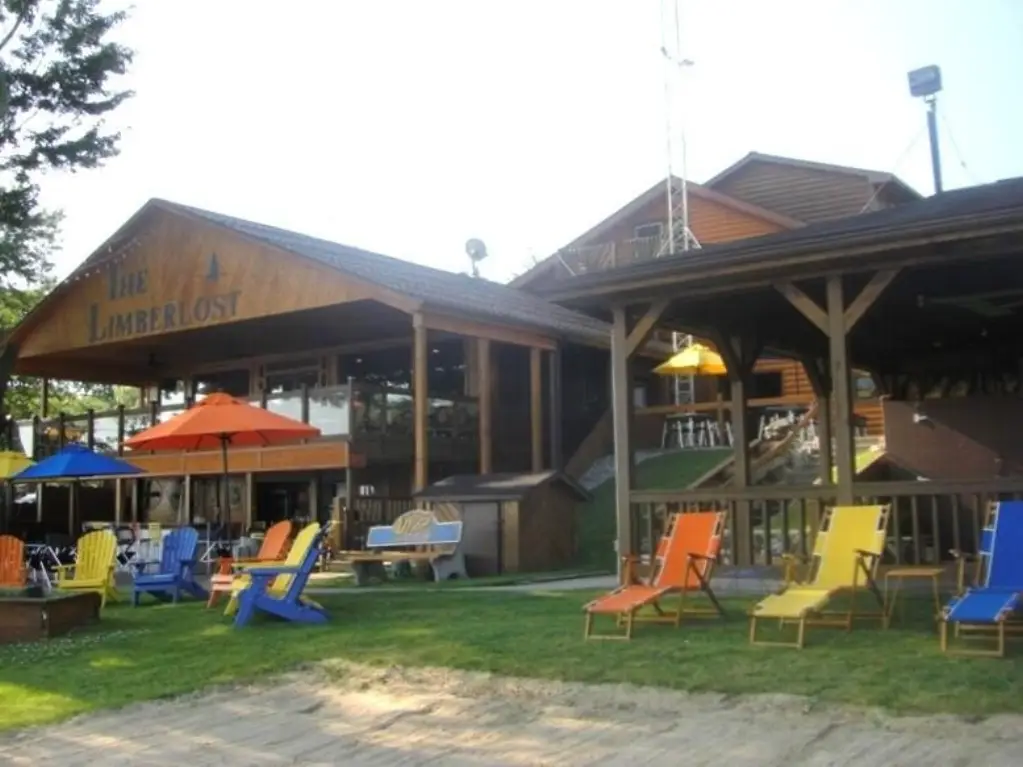
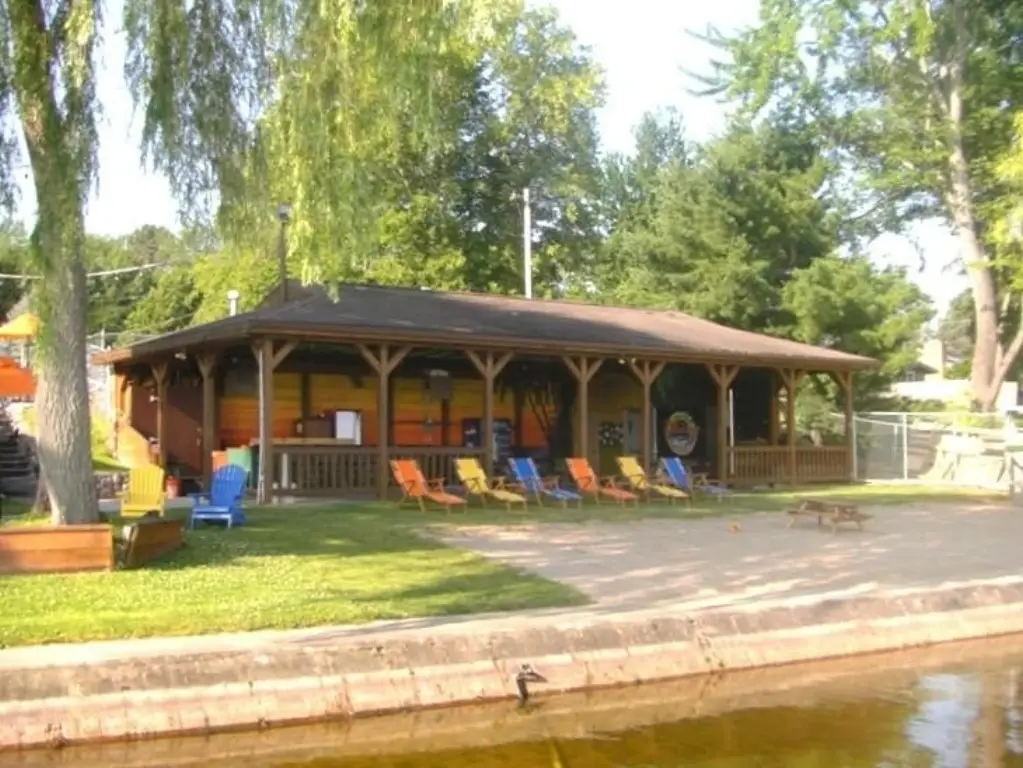
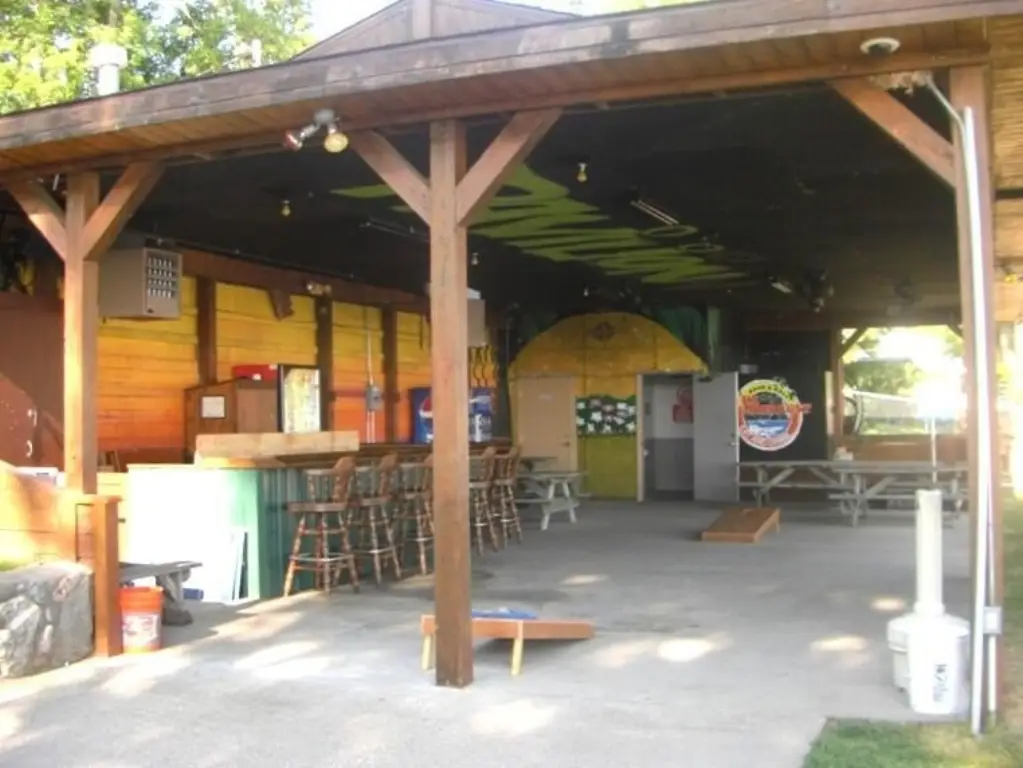
lakeside pavilion
sandy beach
lakeside dock
Listing Agency:
CB Schmidt Houghton Lake
(989) 366-5522
Listed By:
Ruth Anne Clemens · License #6506043271
(989) 429-3100
Added: Jul 27
Changed: Sep 6
Last Checked: Oct 8 at 9:06AM
MLS# 201841794
Copyright © 2026 Water Wonderland Board of Realtors®. All rights reserved. All information provided by the listing agent/broker is deemed reliable but is not guaranteed and should be independently verified.
Investment Insights
Based on property information with market context.
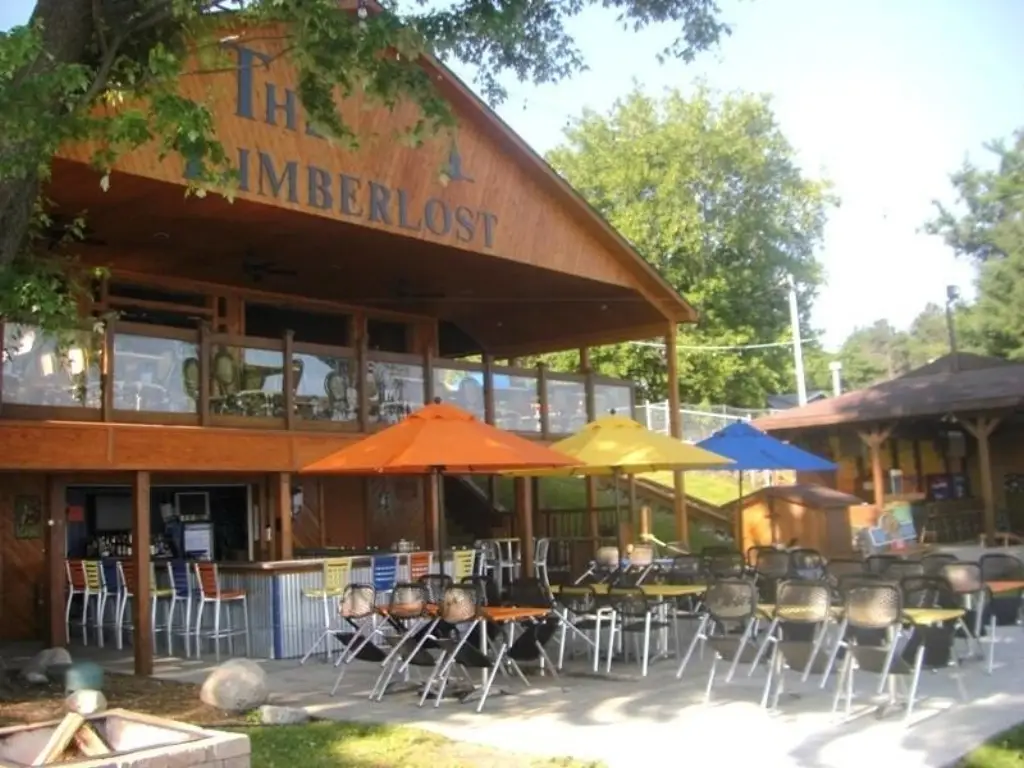
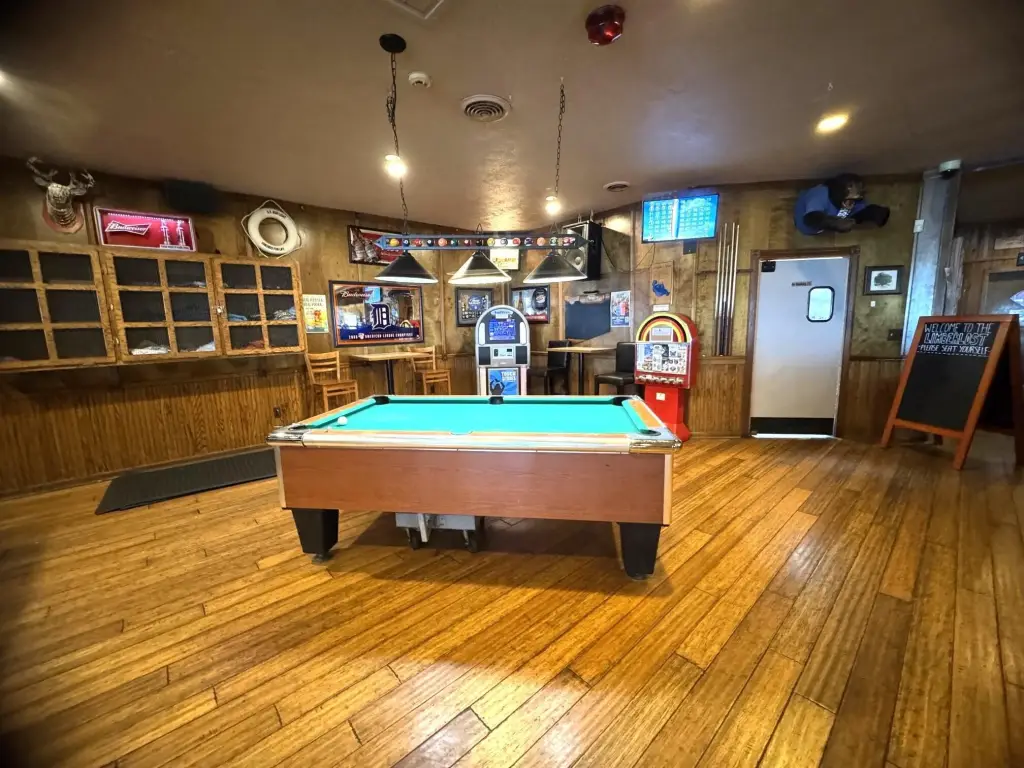
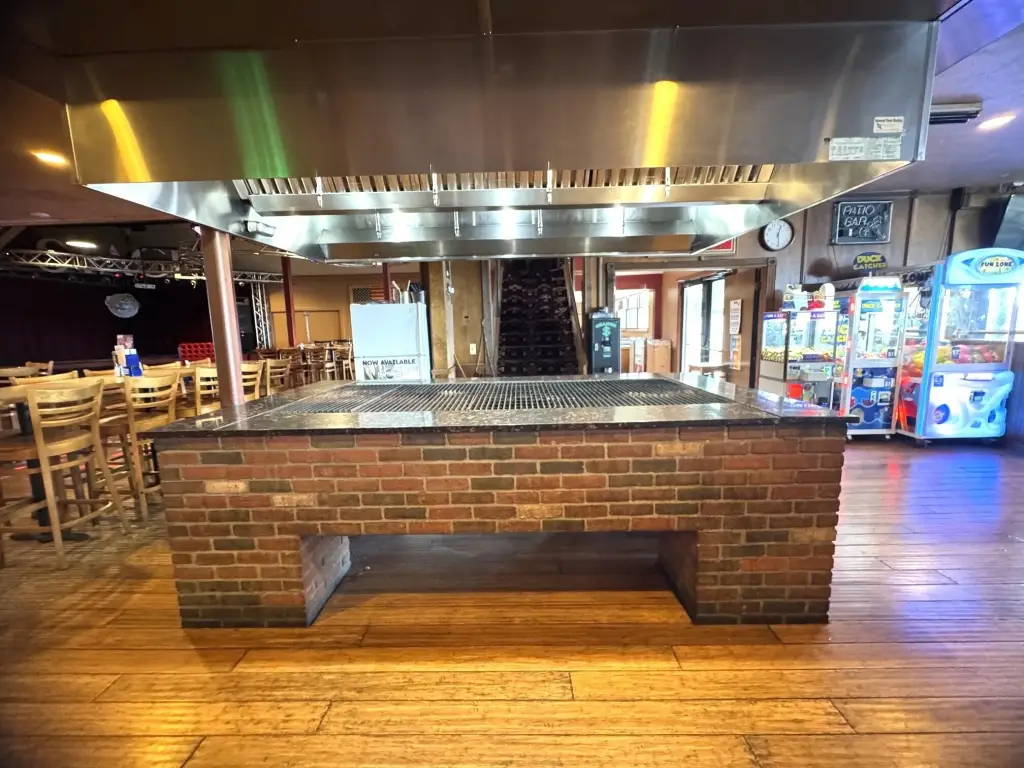
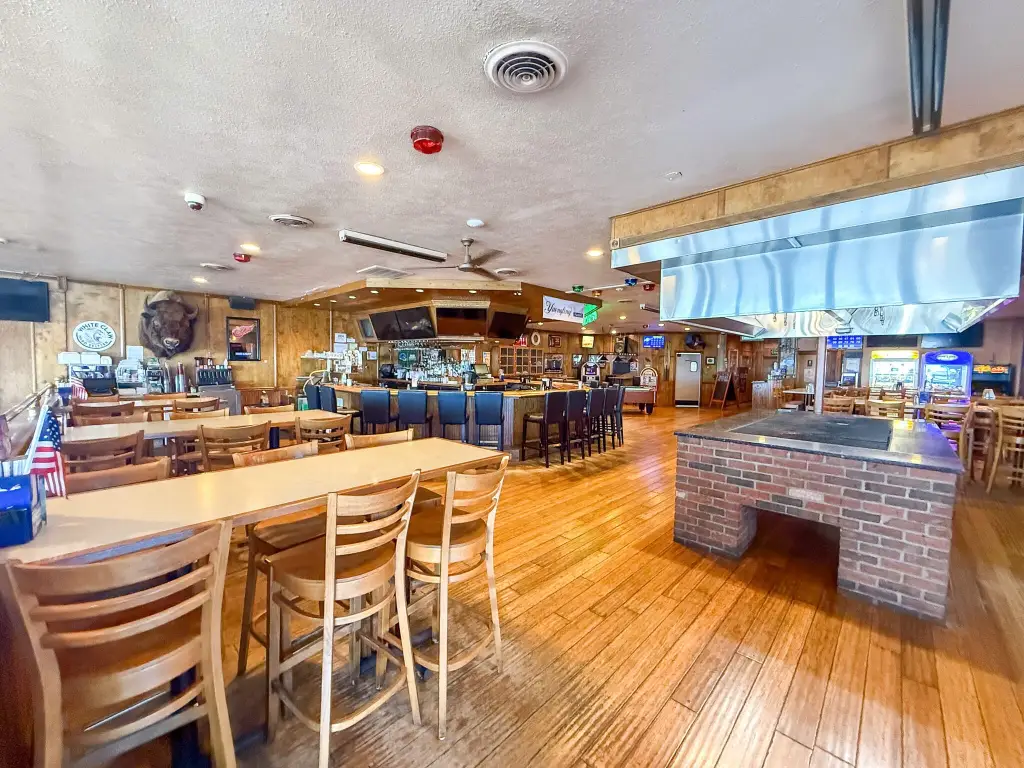
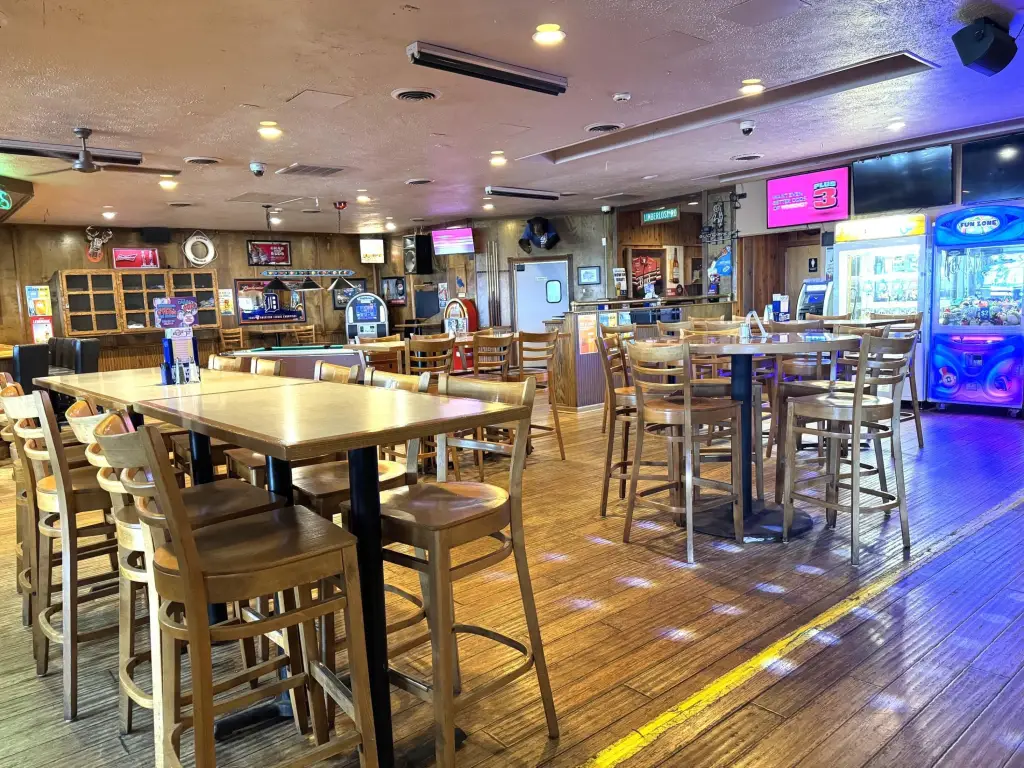
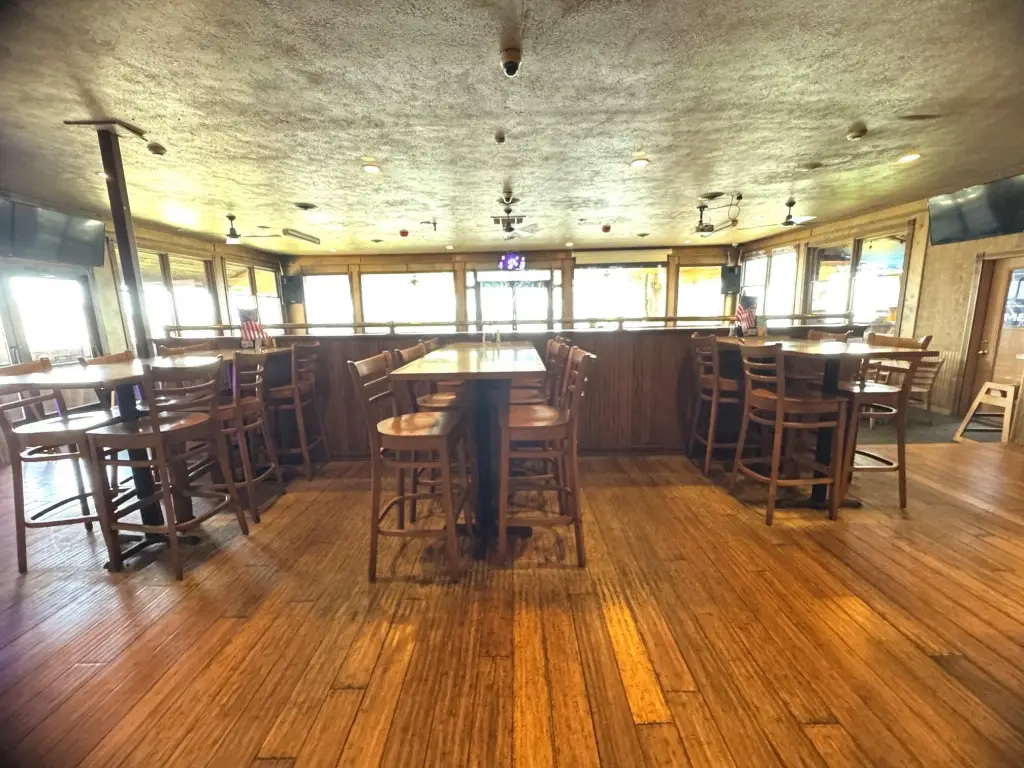
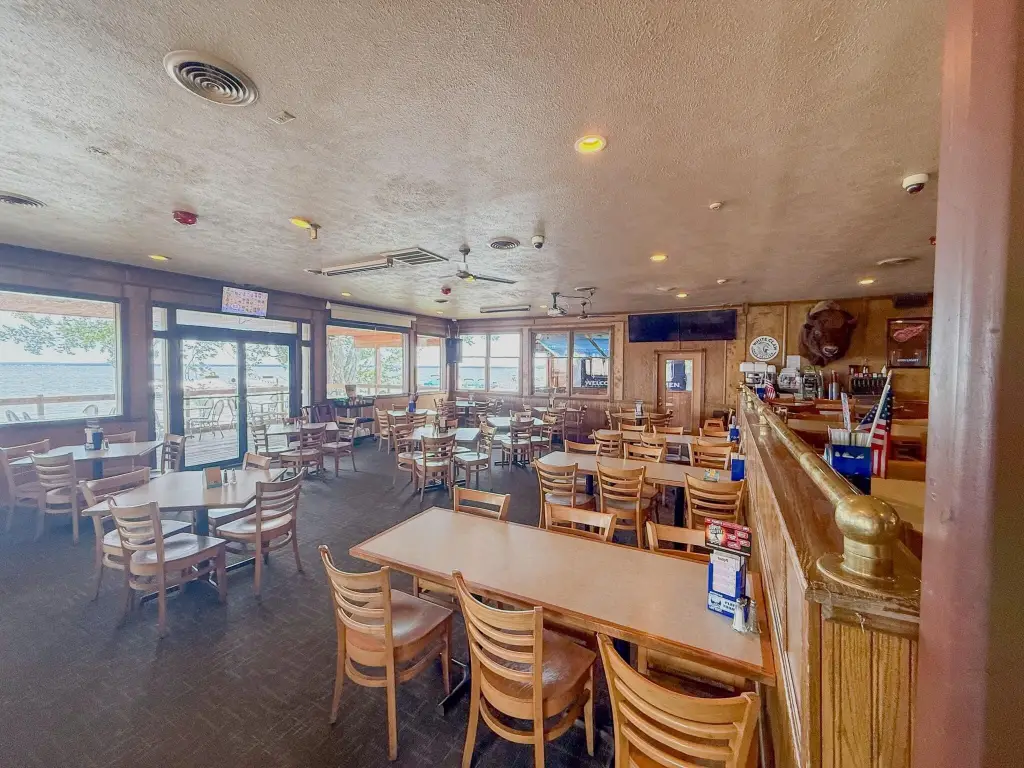
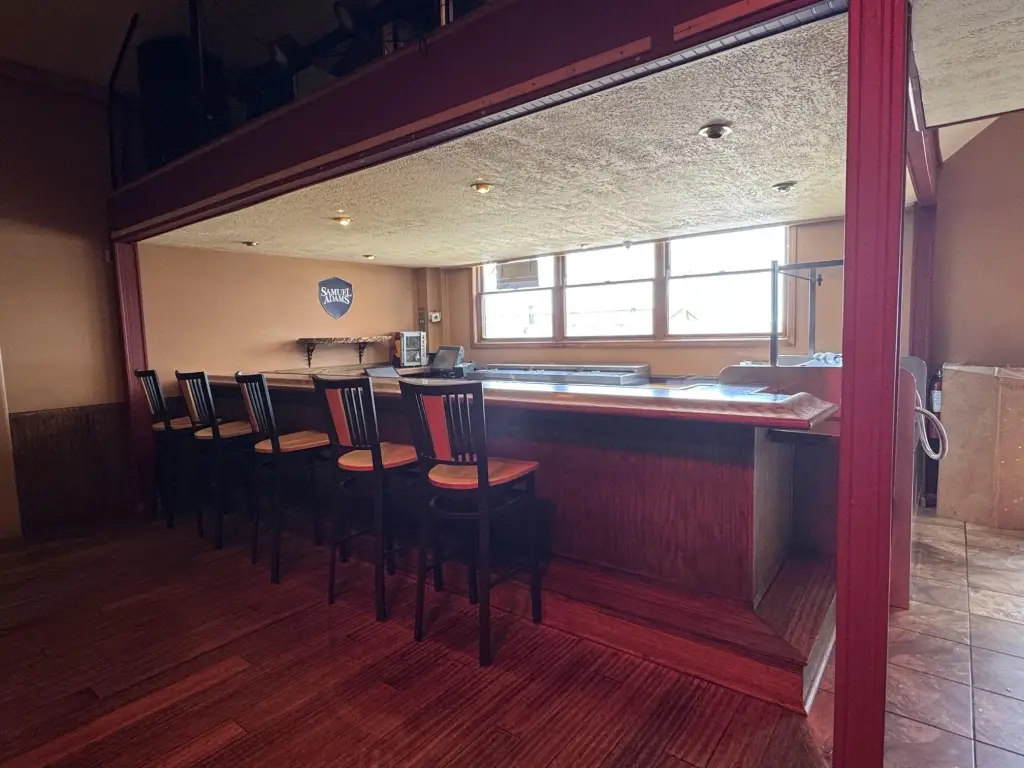
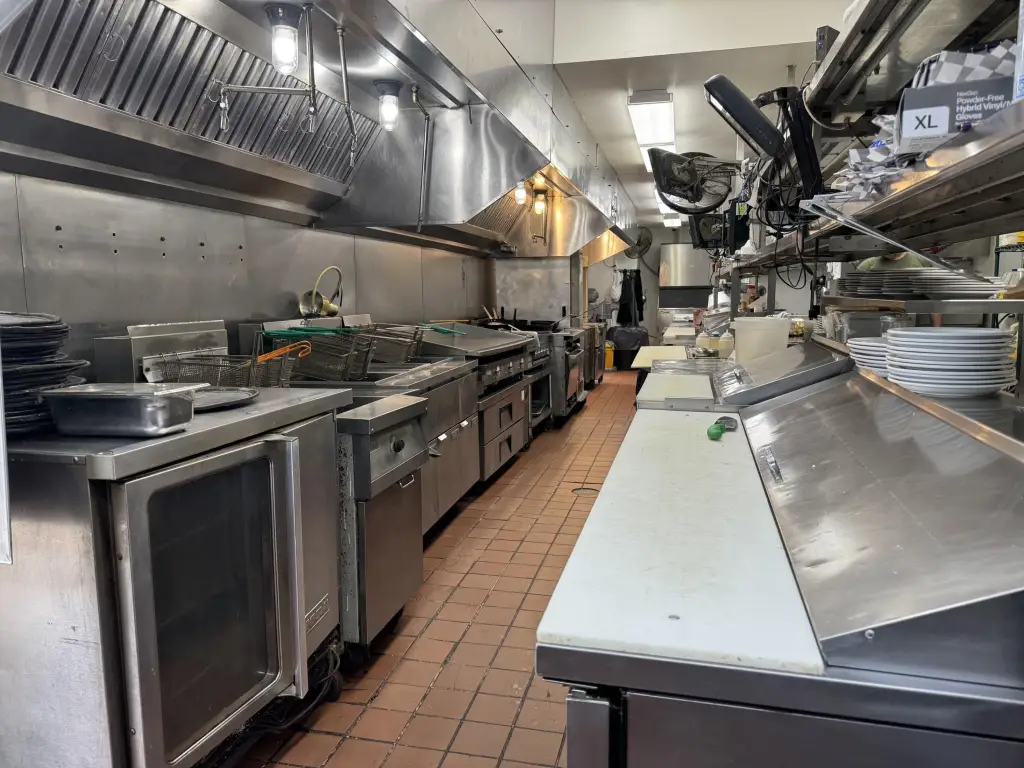
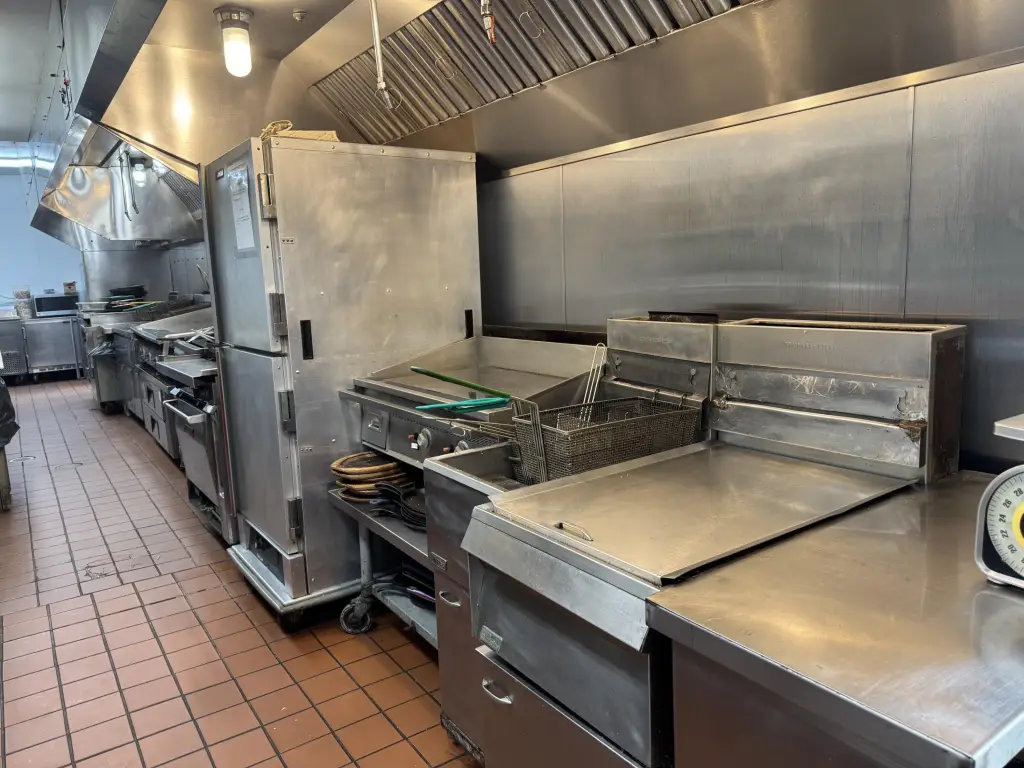
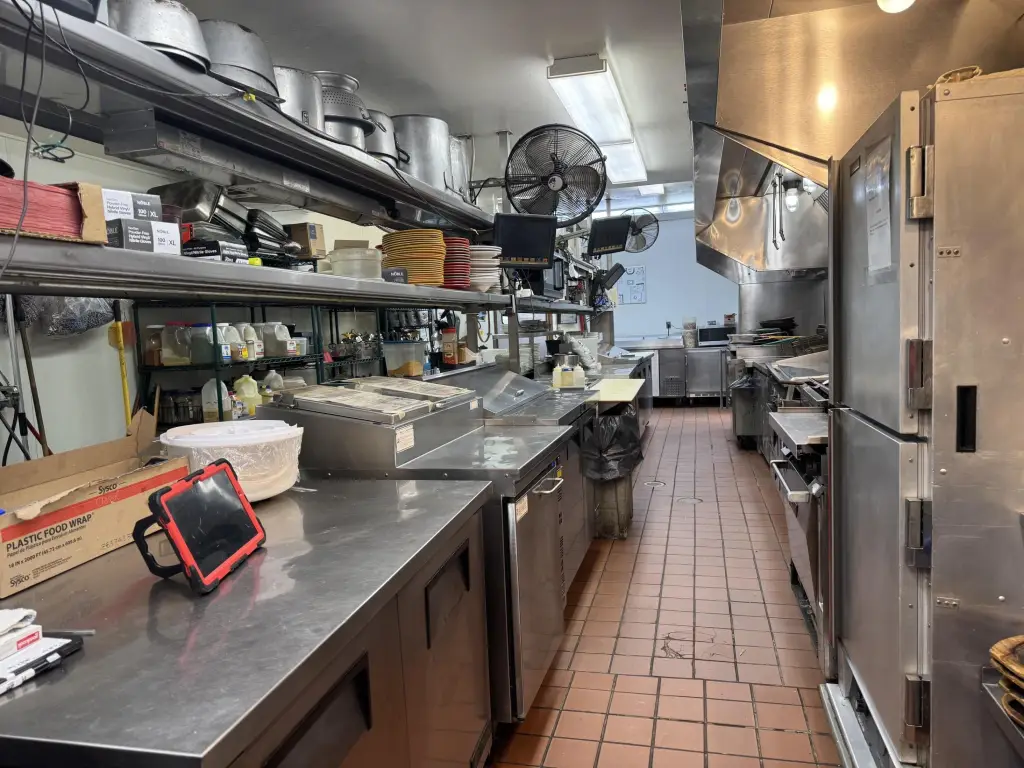
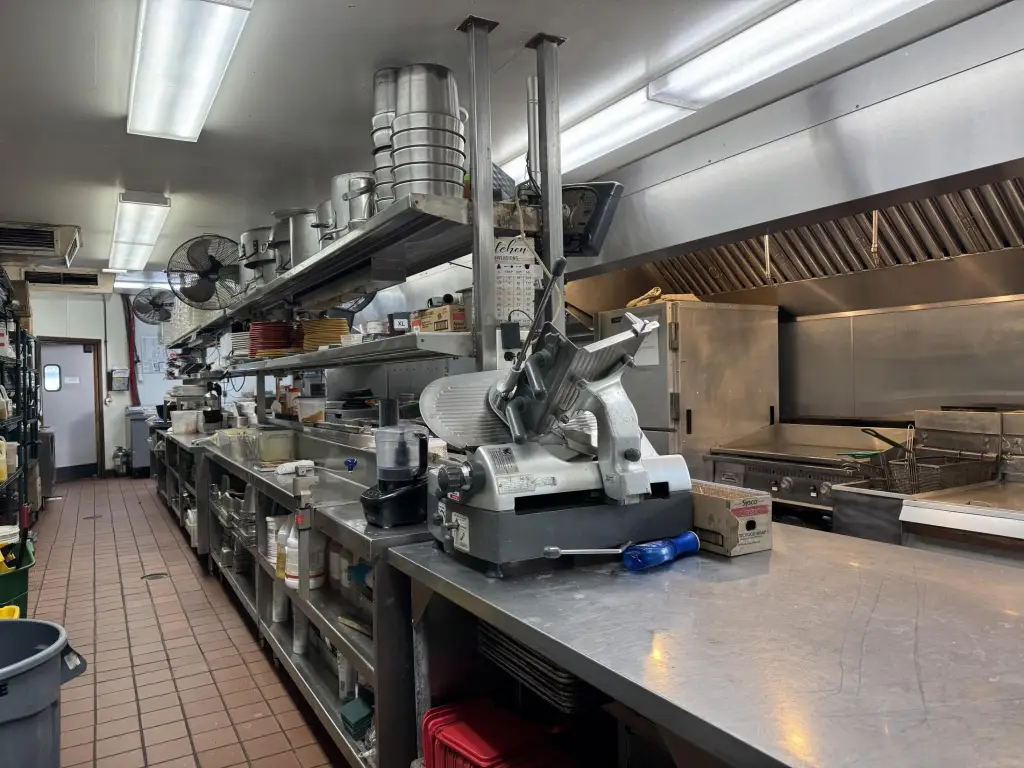
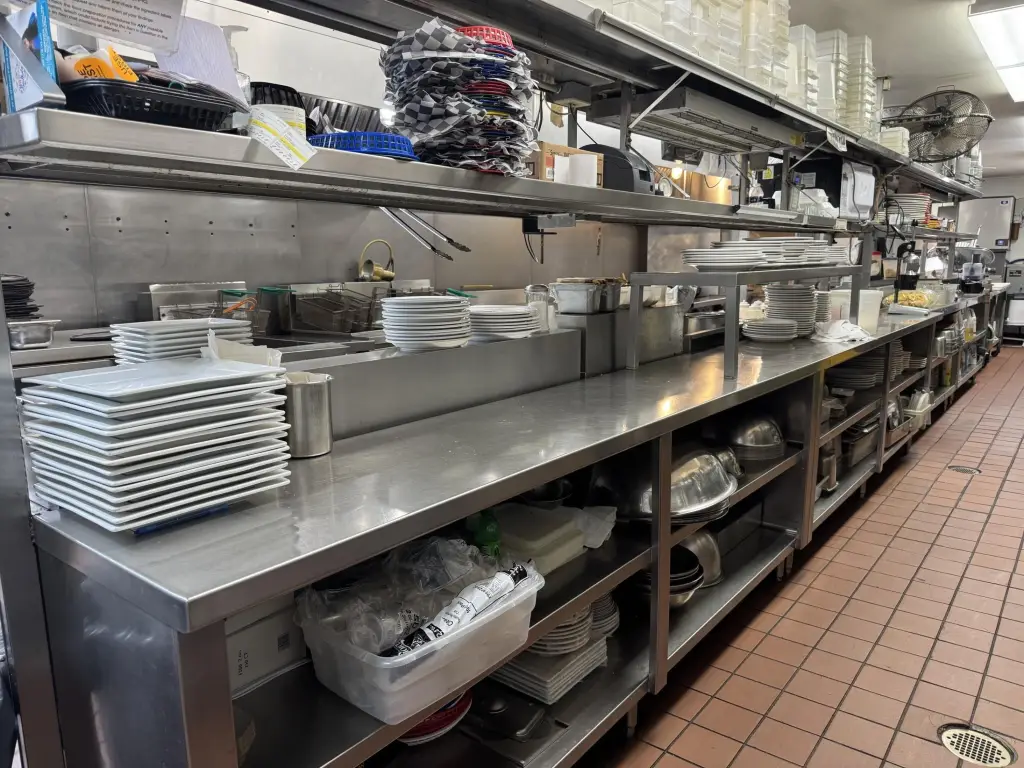
This commercial restaurant and lounge property includes a full kitchen, modern POS system, dining areas, lounge seating, entertainment space, and multiple indoor and outdoor gathering areas. Four separate bar areas serve different operating formats, including an indoor horseshoe bar, a lower open-air bar, a three-sided lakeside pavilion bar, and an additional entertainment bar. The second floor adds flexible space originally designed as a poker room. A char broiler positioned within the dining area supports an interactive guest experience.
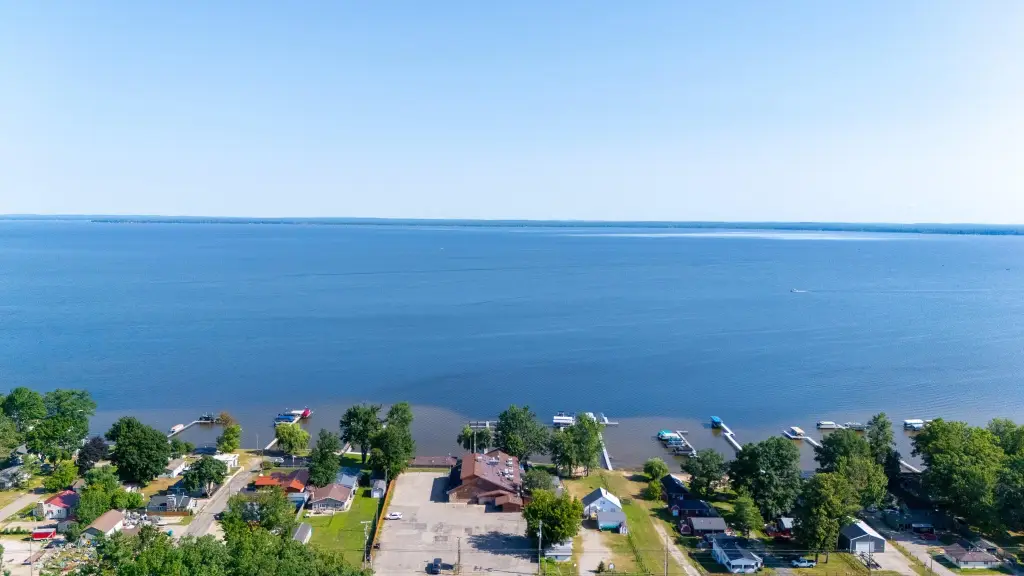
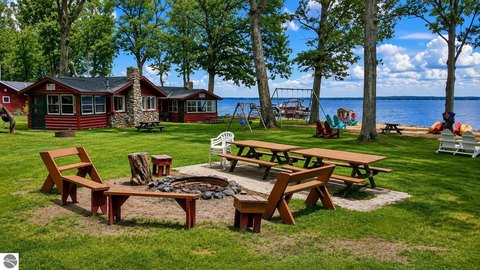
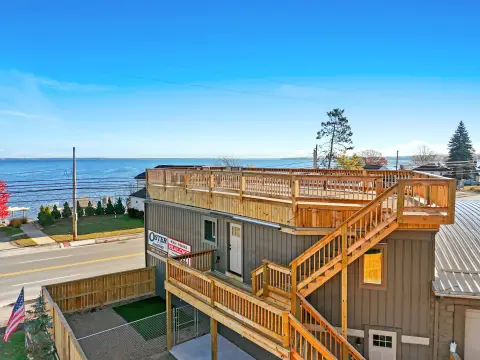
The property has 152 feet of frontage on Houghton Lake, a lake spanning more than 22,000 acres. Outdoor improvements include a 1,404-square-foot lakeside pavilion bar, an approximately 560-square-foot balcony, a sandy beach, a dock, and lake-facing seating. Additional features include an entertainment stage, flat-screen televisions, a leather-furnished lounge, a parking lot, and well water.
The property has 152 feet of frontage on Houghton Lake, a lake spanning more than 22,000 acres. Outdoor improvements include a 1,404-square-foot lakeside pavilion bar, an approximately 560-square-foot balcony, a sandy beach, a dock, and lake-facing seating. Additional features include an entertainment stage, flat-screen televisions, a leather-furnished lounge, a parking lot, and well water.
Key Highlights
- 152 feet of frontage on Houghton Lake, which spans more than 22,000 acres
- Four distinct bar areas, including indoor, lower‑level open‑air, pavilion, and entertainment spaces
- 1,404‑square‑foot three‑sided open‑air lakeside pavilion bar
Financial Insights
Estimated NOI and Cap Rate
NOI / Yr
$64,103
Cap Rate
3.56%
Suggested Prices Based on Cap Rates
Cap Rate 5%
$1,282,060
$1.3M
Cap Rate 7%
$915,757
$915.8K
Cap Rate 9%
$712,256
$712.3K
Market Conditions
NOI Build-Up for 8,420 SF
Gross rent
$118.2K $14.04/SF
− Vacancy
−$32.7K −$3.89/SF
EGI
$85.5K $10.15/SF
− OpEx
−$21.4K −$2.54/SF
NOI
$64.1K $7.61/SF
Area
Roscommon County, MI
Vacancy
27.70%
Lease Rate
$14.04 /SF/Yr
Expense Ratio
25.00%
Simulate Cap Rate and NOI
Suggested Prices Based on Cap Rates
Cap Rate 5%
$1,282,060
Cap Rate 7%
$915,757
Cap Rate 9%
$712,256
Alternative Uses
Best Use
Specialty Retail
$915.8K
$801.3K – $1.07M
NOI $64,103 @ 7.0% cap · market cap 3.56%
Second Best
—
—
no second resolved use
Theoretical Best
Office A
$1.39M
$1.21M – $1.62M
NOI $96,998 @ 7.0% cap · market cap 5.39%
Zoning and permitted uses should be independently verified with authorities.
Property Analytics
Unlock full access to Insights
Subscribe to Realmo Intelligence
Open Analytics
Current Use
Location Intelligence
Trade Area within ½ mile
103
Businesses Nearby
Well-served
Demand for This Use
Explore this area
Business Placement
Demographics for 48629, MI
7,420
Population
7,248
Households
1
Avg Household Size
56
Median Age
18%
College-Educated
90%
High-School Grad
77.5 sq mi
ZIP Area
96
Density / Sq Mi
$54,622
Median Household Income
$33,544
Median Earnings
$784
Median Rent
$142,300
Median Home Value
Check the figures for this property
Cap Rate, Value Estimation, Potential NOI and more
View Realmo Analytics
Market
Vacancy Rate% for Retail in Midwest region

Questions? Ask Rey
Realmo’s AI knows this listing — price, zoning, demand, history. Ask anything.



Similar Off Market Nearby
- China Buffet — 3513 W Houghton Lake Dr, Houghton Lake, MI 48629
Frequently Asked Questions
What type of property is this?
Conventional restaurant - Commercial restaurant property with multiple bar areas, event space, lakefront seating, and direct recreational amenities.
Where is this conventional restaurant located?
The property is located at 4168 W Houghton Lake Drive Houghton Lake, MI.
What is the asking price?
The asking price for this property is $1,800,000.
What are key features of this property?
This property features: 152 feet of frontage on Houghton Lake, which spans more than 22,000 acres; Four distinct bar areas, including indoor, lower‑level open‑air, pavilion, and entertainment spaces; 1,404‑square‑foot three‑sided open‑air lakeside pavilion bar