Flex Space with Drive-In
For Sale
$250,000
1366 Heightsview Dr, Houghton Lake, MI 48630
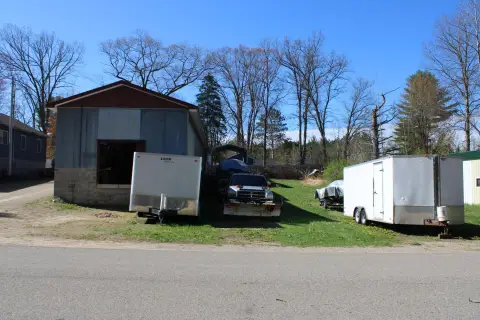
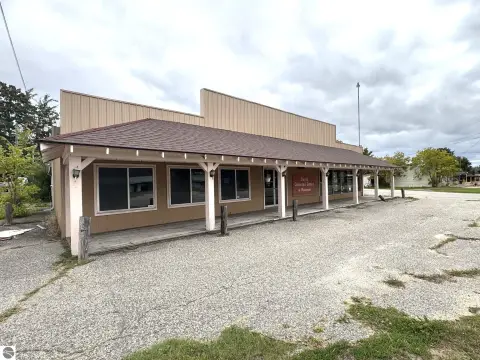
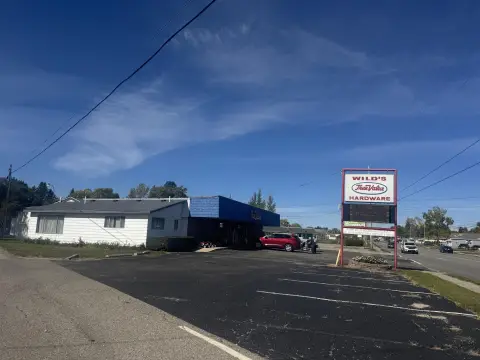
Commercially zoned property combines open office, warehouse, parts storage, and covered exterior storage near M-55.
Property Size4,100 SF
Price / SF$62.50
Days on Market97
Property Features for 1366 Heightsview Dr
General Information
Standard status
Active
Size
4,100 SF
Property subtype
Industrial
Zoning
Commercial
Site & Location
Highway Access
Yes
Outdoor Storage
Yes
Additional Details
Drive-In Doors
1
Amenities
Power
Water
Sewer
Vacant
Building Details
Buildings
1
Building Size
4,100 SF
Listing Agency:
Colliers - Grand Rapids
Listed By:
Matt Abraham · License #6502396785
(616) 560-4543
Source:
Carwm.resimplifi
Added: Jul 10
Changed: Oct 5
Last Checked: Oct 12 at 4:48PM
Displayed information is deemed reliable but is not guaranteed and should be independently verified. All listing content including descriptions, pricing, images are the copyrighted material of Colliers - Grand Rapids
Investment Insights
Based on property information with market context.
This commercially zoned flex property combines office and industrial areas in a single building. The office portion includes an open work area, while the warehouse includes dedicated parts storage, open floor space, covered exterior storage, and one drive-in door. The configuration supports light industrial and service-oriented operations without separating office and warehouse functions.
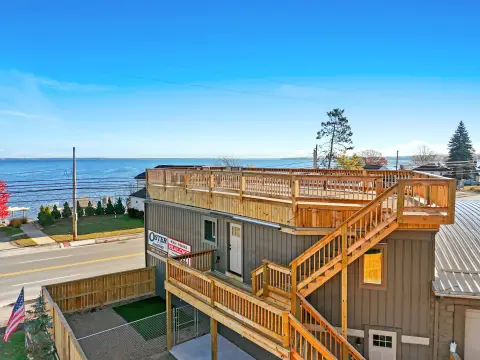
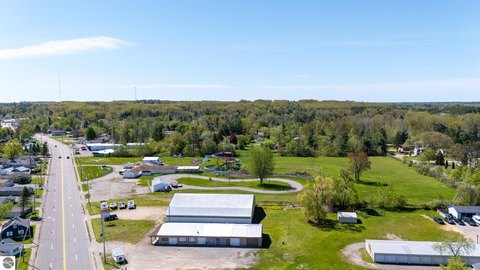
The property is situated near M-55 and two blocks from Houghton Lake. Its location provides direct proximity to the highway corridor and the lake, while the existing mix of enclosed and covered storage accommodates varied operational needs.
The property is situated near M-55 and two blocks from Houghton Lake. Its location provides direct proximity to the highway corridor and the lake, while the existing mix of enclosed and covered storage accommodates varied operational needs.
Key Highlights
- Commercial zoning supports a range of business uses
- Office area includes an open work space
- Warehouse offers parts storage and open floor area
Financial Insights
Estimated NOI and Cap Rate
NOI / Yr
$22,655
Cap Rate
9.06%
Suggested Prices Based on Cap Rates
Cap Rate 5%
$453,100
$453.1K
Cap Rate 7%
$323,643
$323.6K
Cap Rate 9%
$251,722
$251.7K
Market Conditions
NOI Build-Up for 4,000 SF
Gross rent
$36.0K $9.00/SF
− Vacancy
−$3.6K −$0.91/SF
EGI
$32.4K $8.09/SF
− OpEx
−$9.7K −$2.43/SF
NOI
$22.7K $5.66/SF
Area
Roscommon County, MI
Vacancy
10.10%
Lease Rate
$9.00 /SF/Yr
Expense Ratio
30.00%
Simulate Cap Rate and NOI
Suggested Prices Based on Cap Rates
Cap Rate 5%
$453,100
Cap Rate 7%
$323,643
Cap Rate 9%
$251,722
Alternative Uses
Best Use
Office B
$514.3K
$450.0K – $600.0K
NOI $36,000 @ 7.0% cap · market cap 14.40%
Second Best
Warehouse
$393.0K
$343.9K – $458.5K
NOI $27,509 @ 7.0% cap · market cap 11.00%
Theoretical Best
Office A
$658.3K
$576.0K – $768.0K
NOI $46,080 @ 7.0% cap · market cap 18.43%
Zoning and permitted uses should be independently verified with authorities.
How Realmo checks its estimates
Property Analytics
Current Use
Lease Details
1
Drive-in doors
Yes
Highway access
Location Intelligence
Trade Area within ½ mile
82
Businesses Nearby
Well-served
Demand for This Use
Explore this area
Business Placement
Demographics for 48630, MI
227
Population
164
Households
1.4
Avg Household Size
57
Median Age
66%
High-School Grad
0.2 sq mi
ZIP Area
1,135
Density / Sq Mi
$71,518
Median Household Income
Market
Vacancy Rate% for Office in Midwest region

Questions? Ask Rey
Realmo’s AI knows this listing — price, zoning, demand, history. Ask anything.






Frequently Asked Questions
What type of property is this?
Flex space - Commercially zoned property combines open office, warehouse, parts storage, and covered exterior storage near M-55.
Where is this flex space located?
The property is located at 1366 Heightsview Dr Houghton Lake, MI.
What is the asking price?
The asking price for this property is $250,000.
What are key features of this property?
This property features: Commercial zoning supports a range of business uses; Office area includes an open work space; Warehouse offers parts storage and open floor area


