Four-Unit Multifamily
396 2nd Avenue Long Branch, NJ 07740
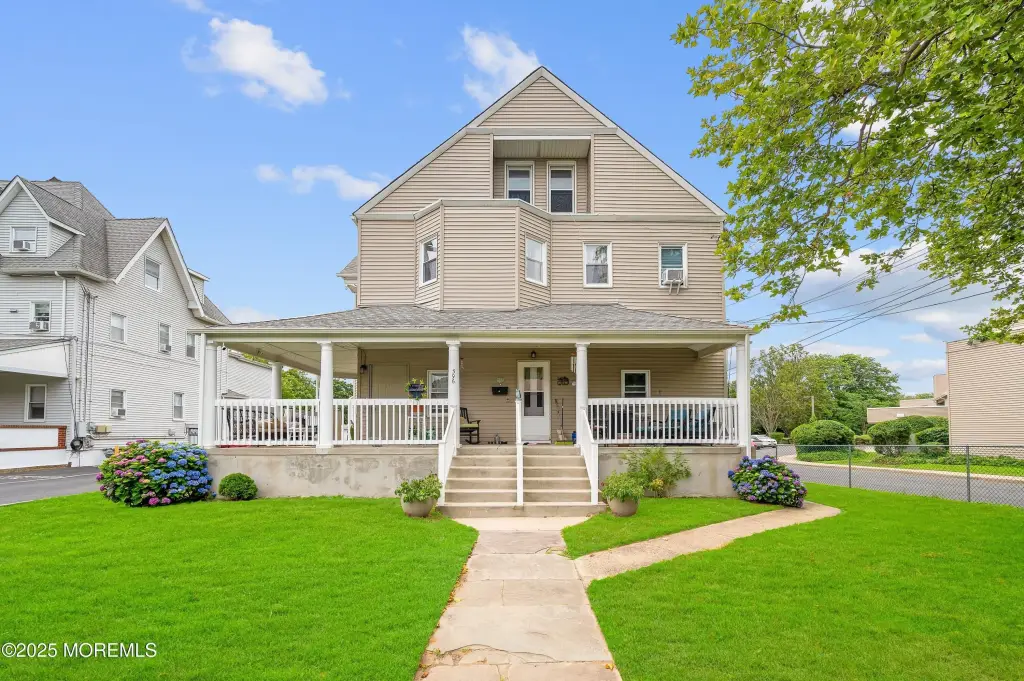
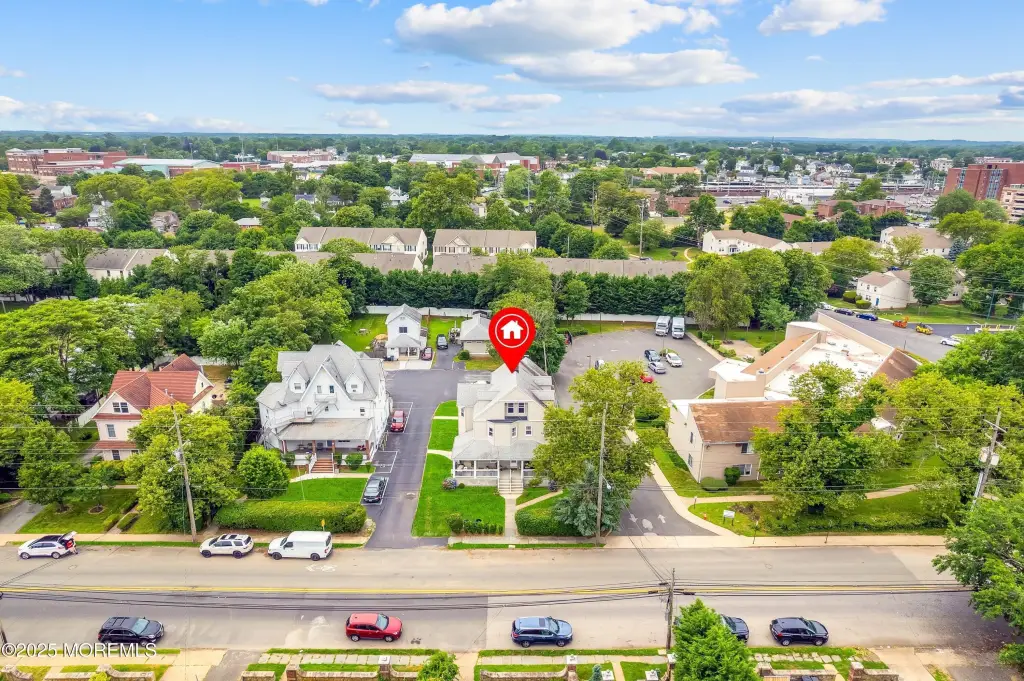
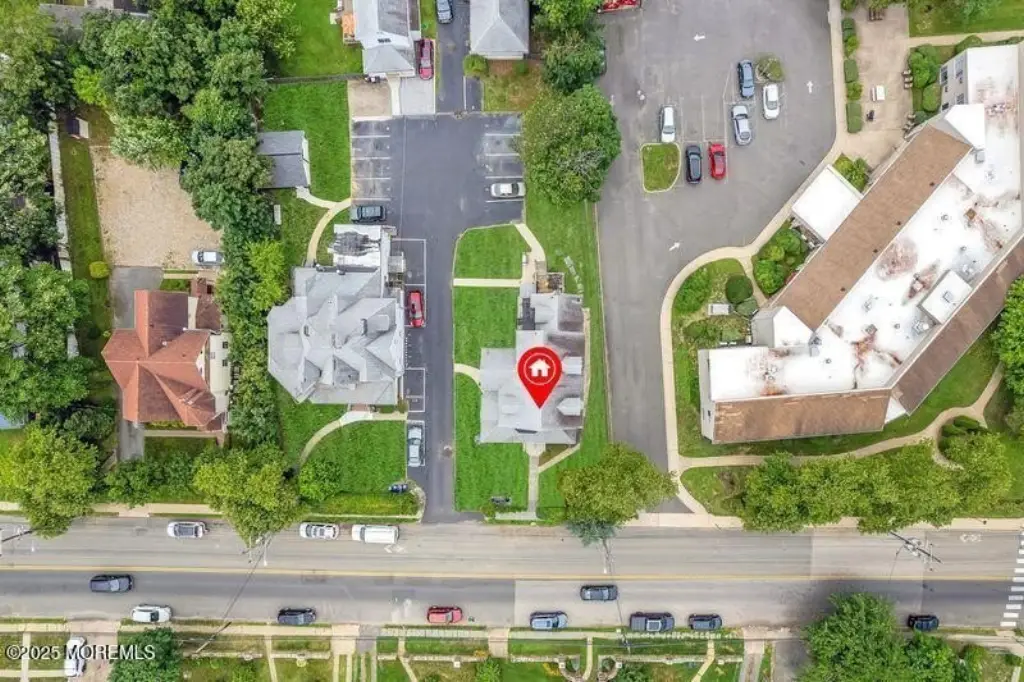
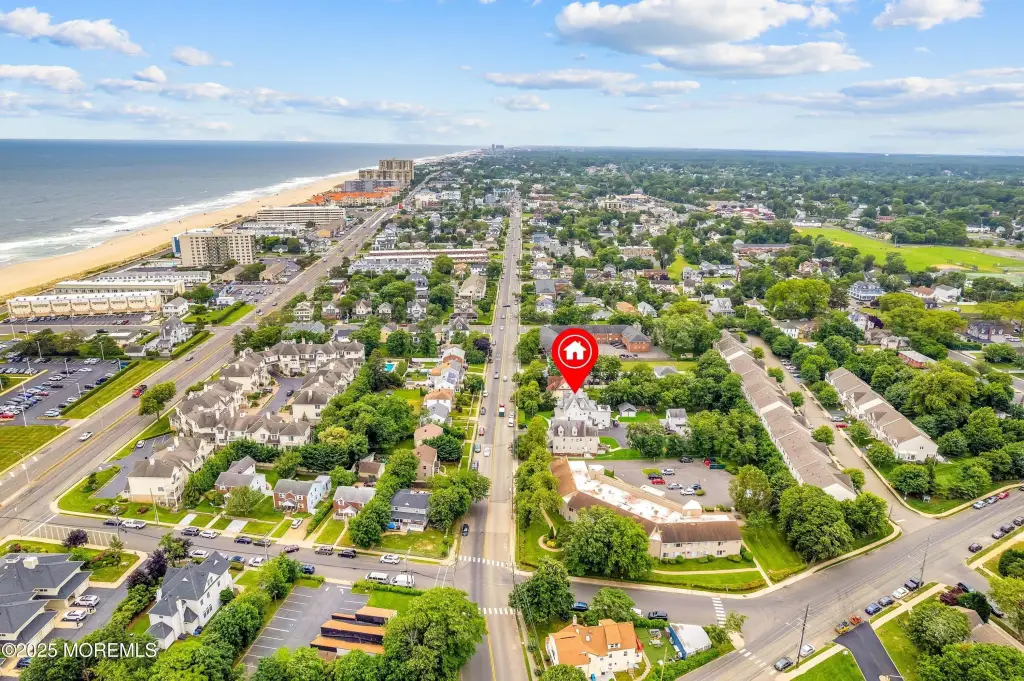
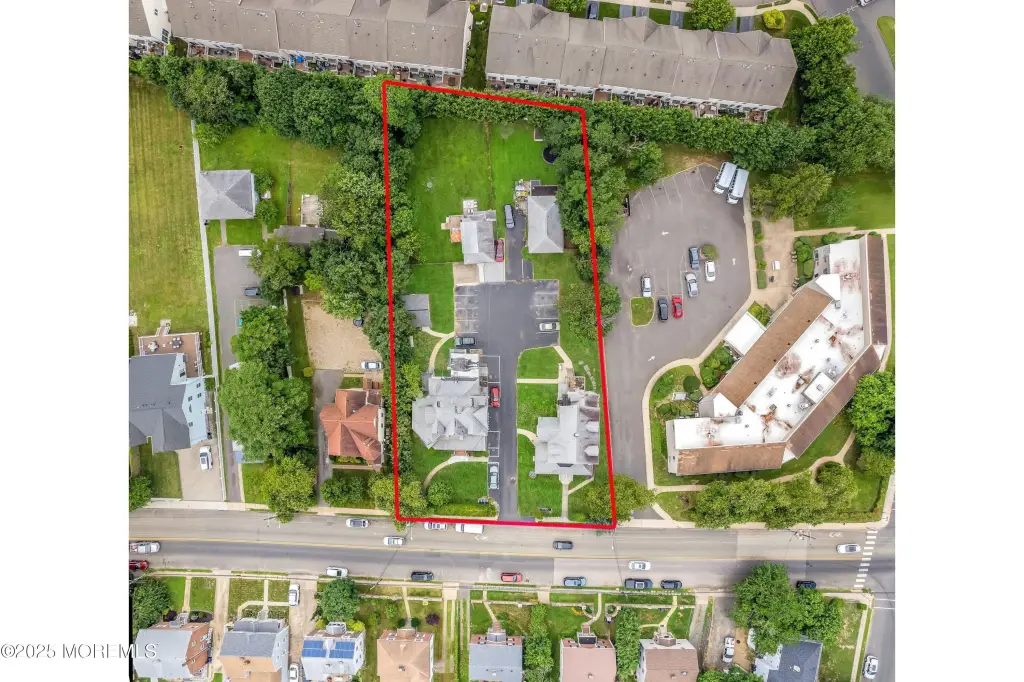
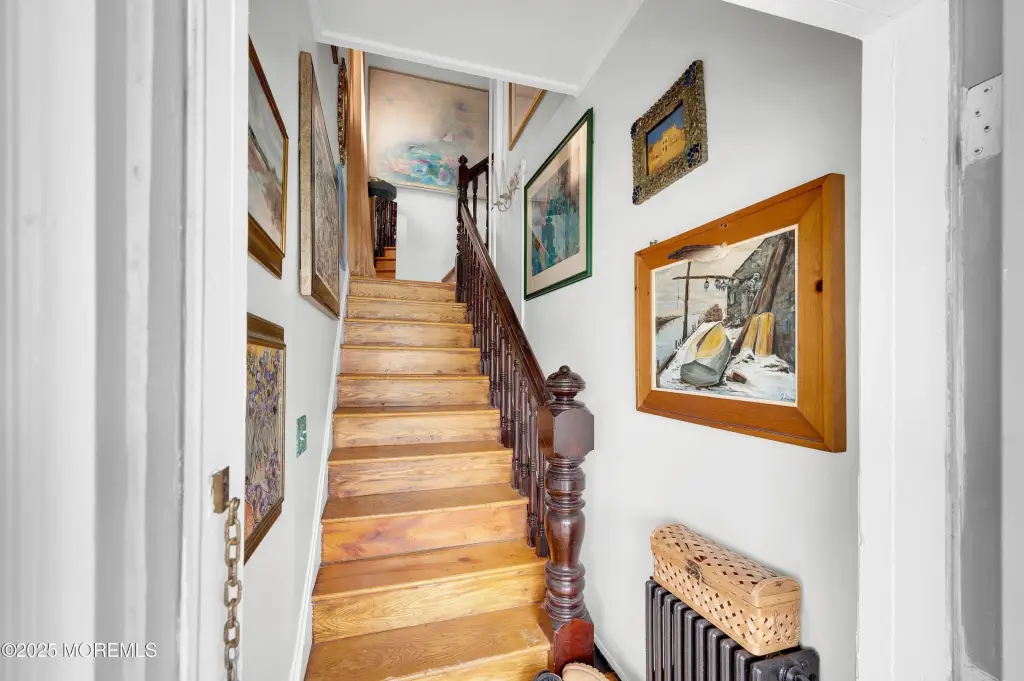
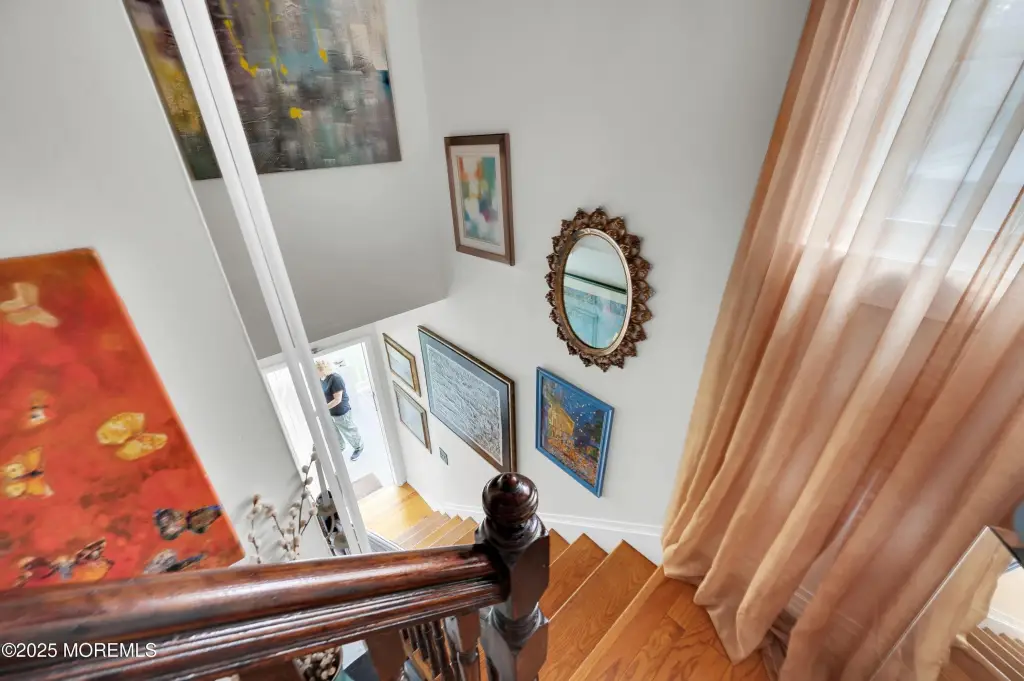
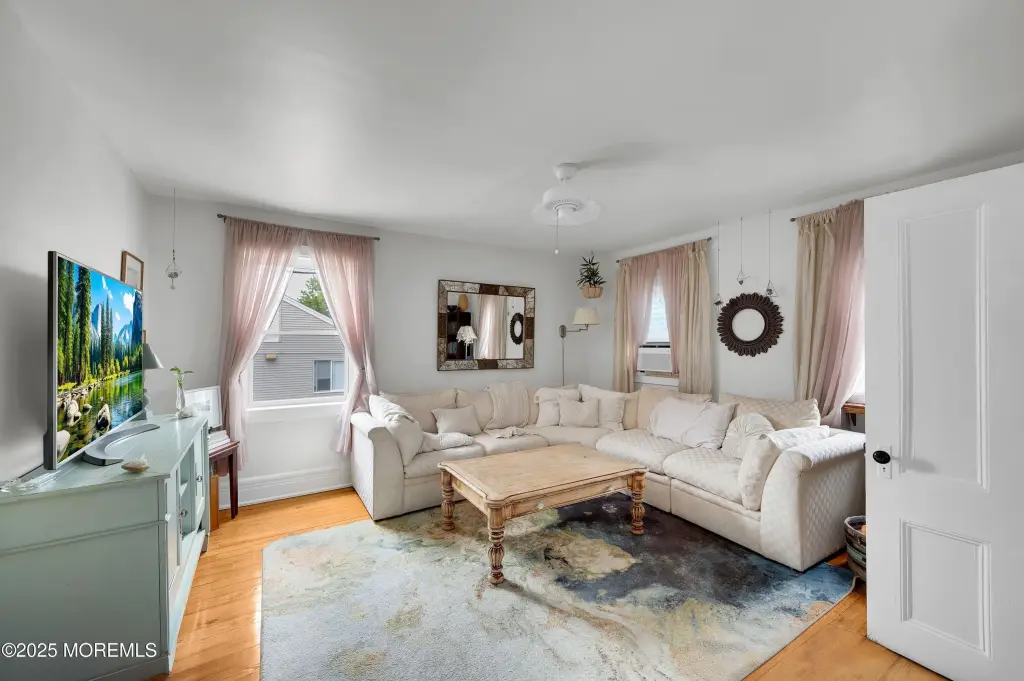
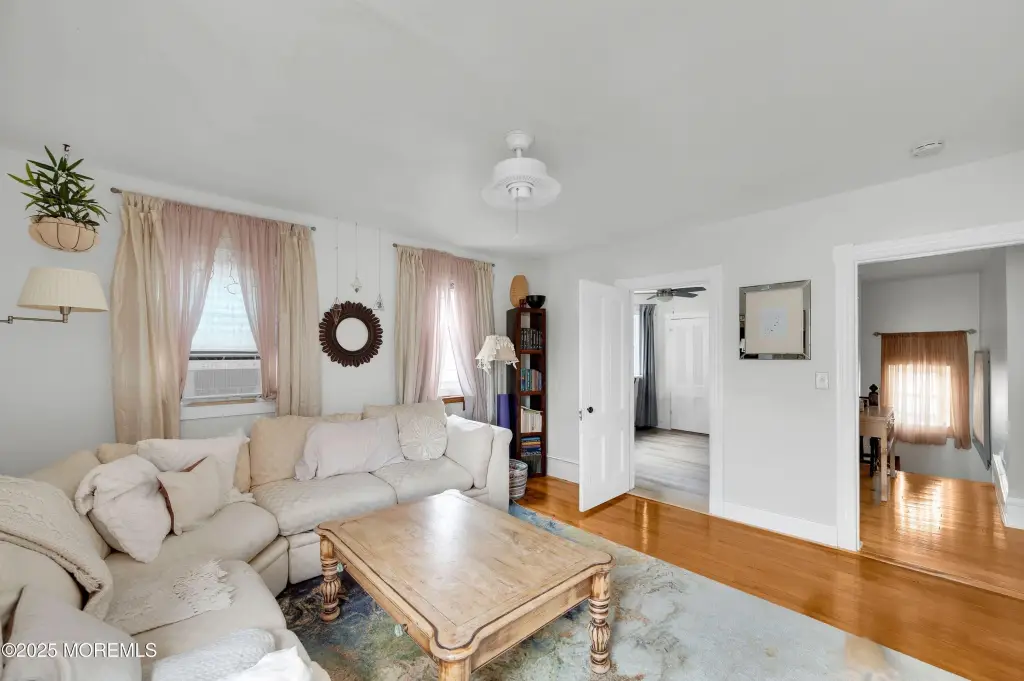
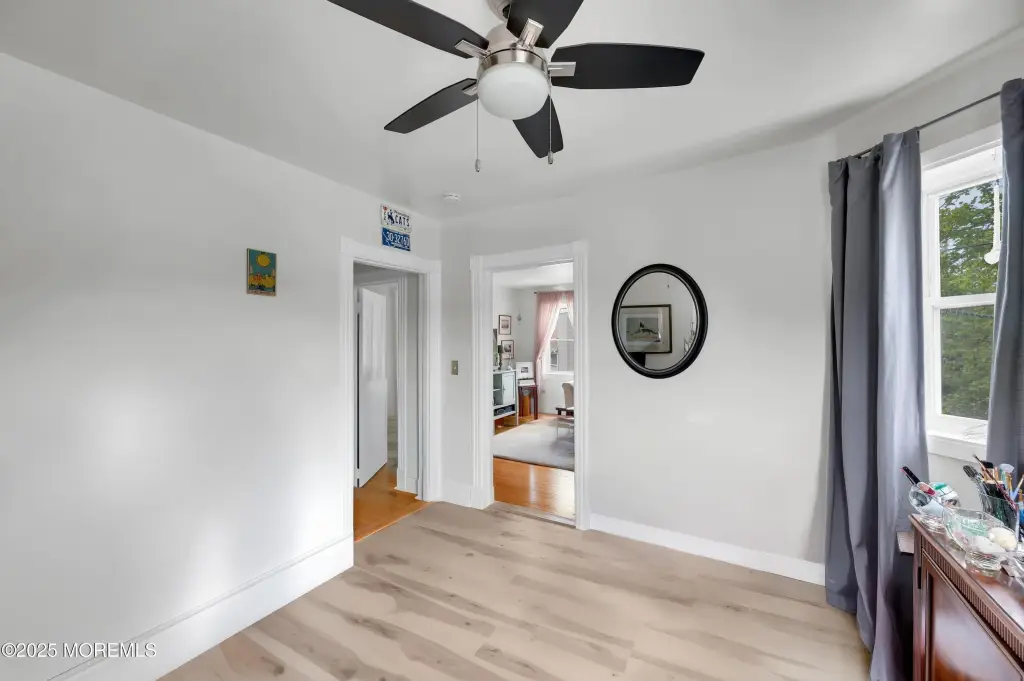
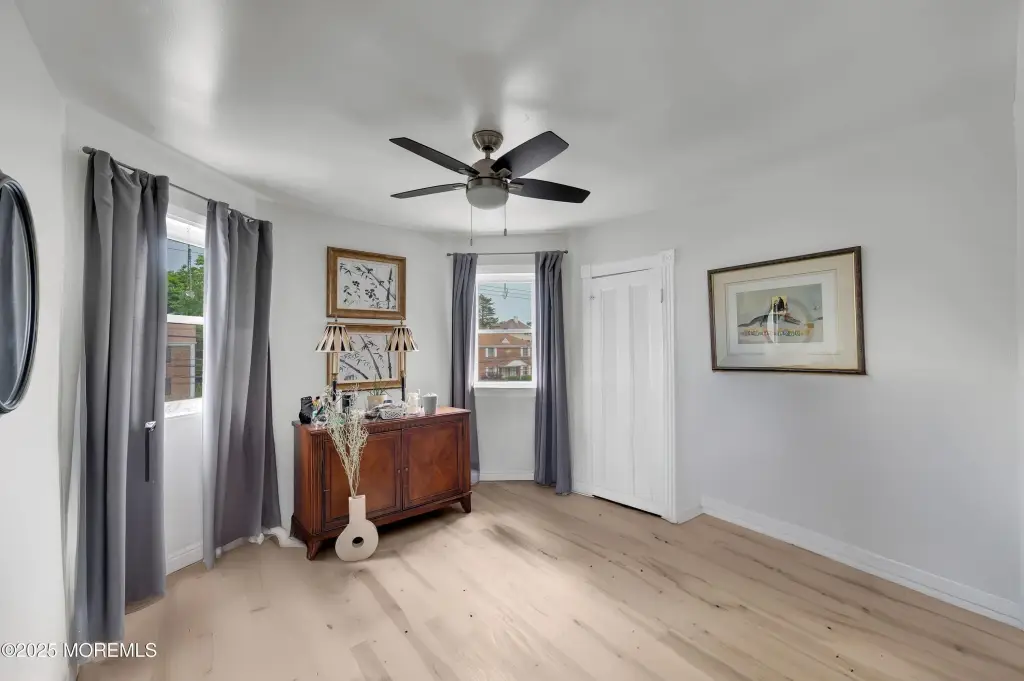
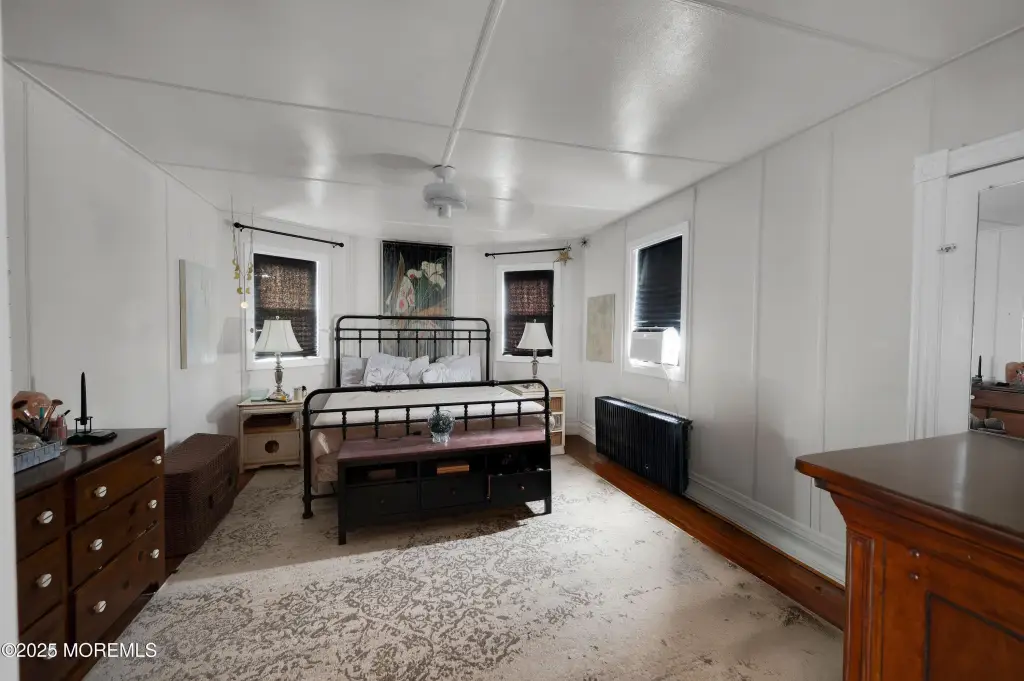
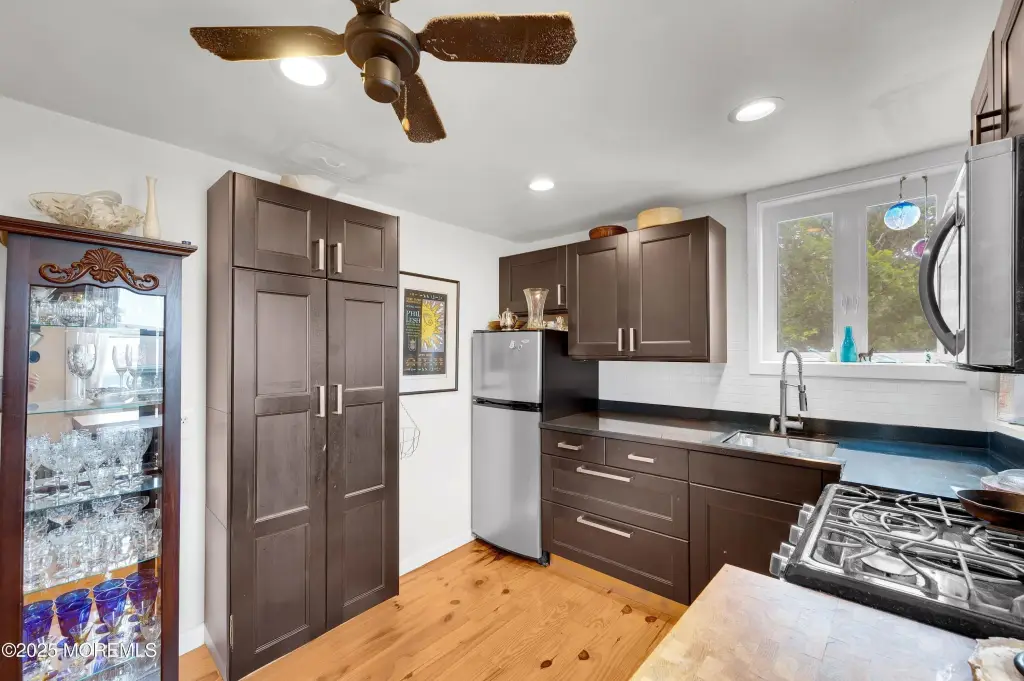
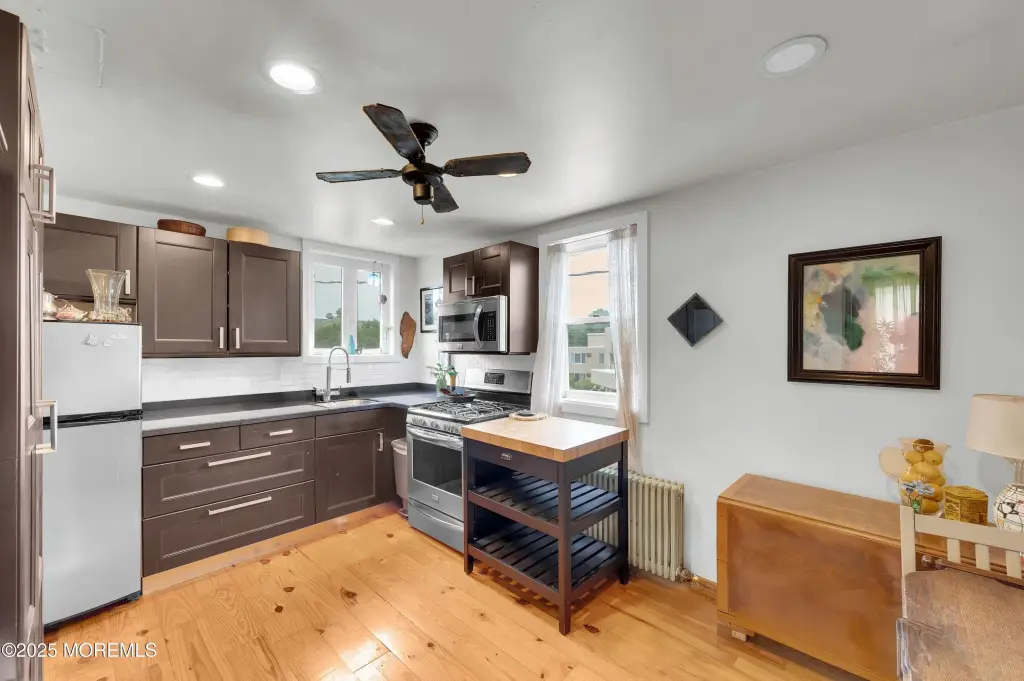
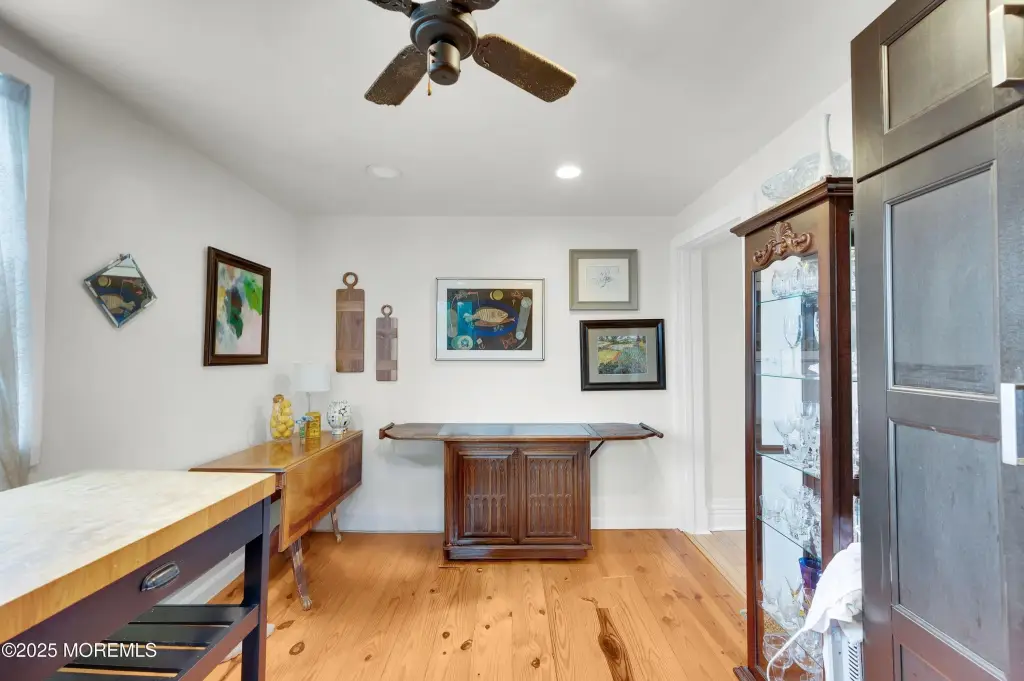
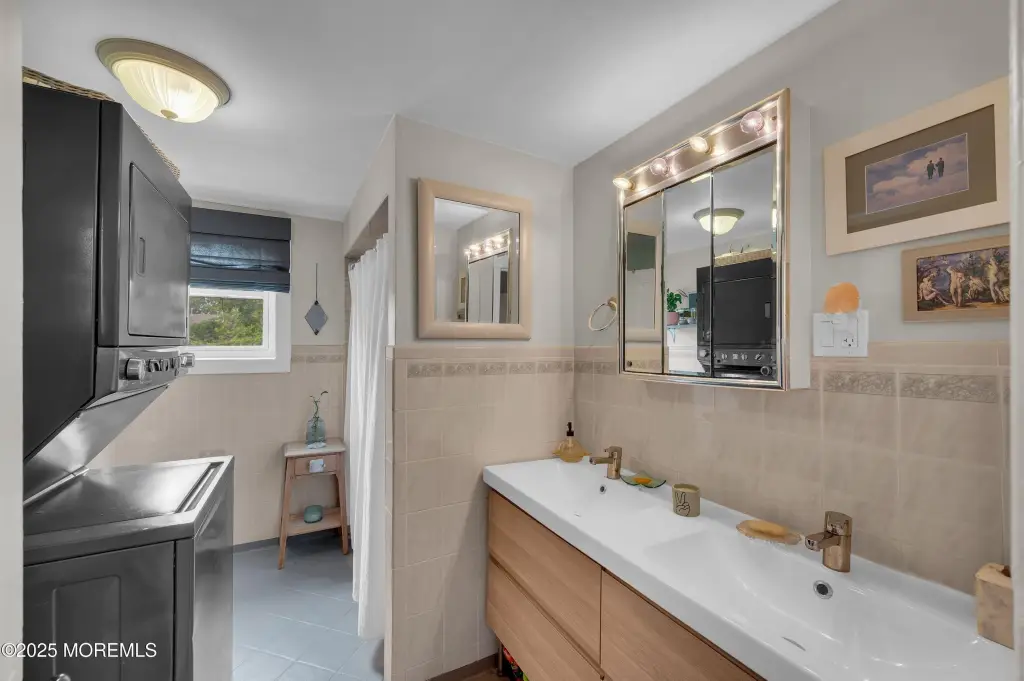
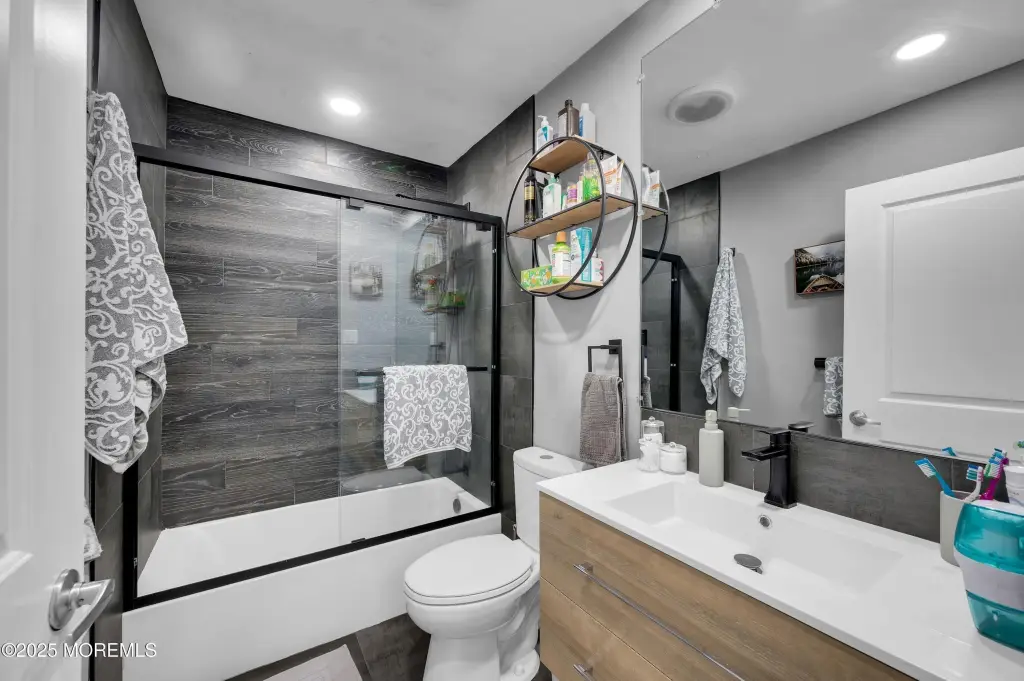
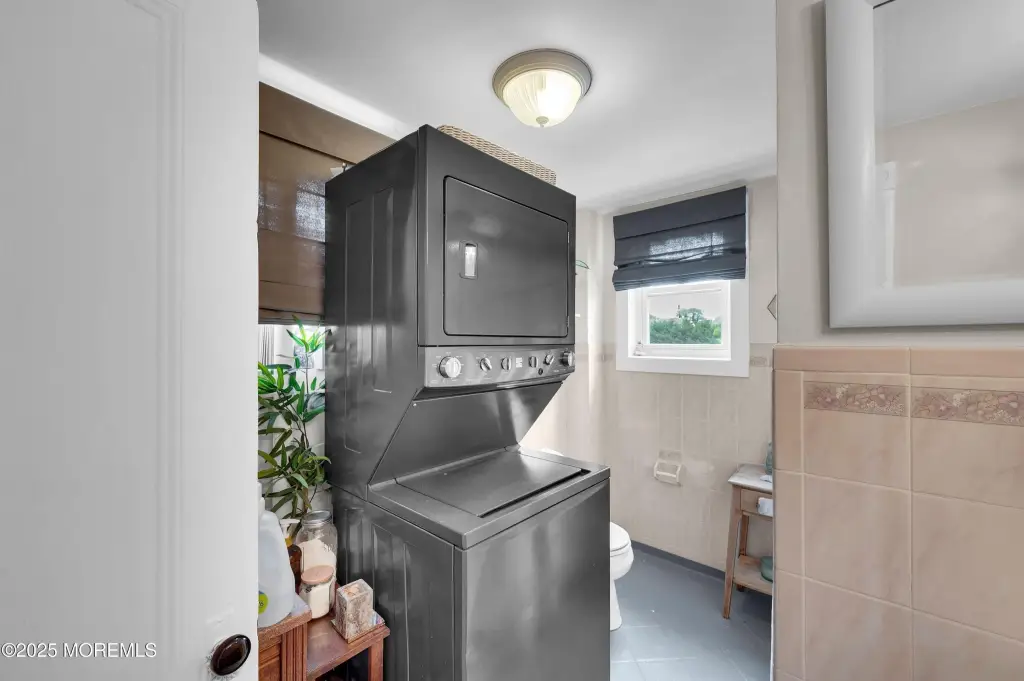
396 2nd Avenue, Long Branch, NJ, 07740
$1,725,000
For Sale
$1,725,000
MULTI_FAMILY - Long Branch, NJ
Property Size3,546 SF
Lot Size0.34 Acres
Price / SF$486.46
Days on Market40
Property Features for 396 2nd Avenue
General Information
- Property type
- Residential Multi Family
- Property subtype
- Other
- Bedrooms
- 10
- Bathrooms
- 4
- Rooms
- Bedroom 2, Bedroom 9, Bedroom 6, Bedroom 4, Bathroom 2, Bedroom 7, Bedroom 8, Bedroom 3, Bedroom 5, Bathroom 3, Bathroom 4, Bedroom 10, Bedroom 1, Bathroom 1, Basement
- Parking features
- Open
- Exterior features
- Lighting
- Basement
- Full
- Standard status
- Active
- APN
- 27-00153-0000-00017
- Size
- 3,546 SF
- Lot size
- 0.34 Acres
Taxes and HOA fees
- Tax Year
- 2025
- Tax Annual Amount
- 15086
Utilities
- Sewer type
- Public Sewer
- Heating system
- Zoned
- Cooling system
- Multi Units
- Water source
- Public
Building Details
- Year built
- 1907
- Floors in Building
- 2
- Number of units
- 4
- Roof type
- Shingle
Listing agency
Rosario Realty Inc
(732) 229-4900
Listed by
Carolina M Zocco · License #8936342
(732) 229-4900
Added: Jun 12 Updated: Jul 10 at 10:33PM Checked: Jul 21 at 10:06PM
MLS# 22617865
Copyright © 2026 More MLS. All rights reserved. All information provided by the listing agent/broker is deemed reliable but is not guaranteed and should be independently verified.
Investment Insights
Based on property information with market context.
This for-sale four-unit multifamily complex at 396 2nd Avenue, Long Branch, NJ consists of two distinct buildings located across two separate lots. The property totals four rental units, with tenants currently on month-to-month leases. The landlord also covers water and sewer expenses, which can help simplify operating expenses and property management. The two lots are described as 396 2nd Avenue (54 x 274) and a second lot at 402 2nd Avenue (75 x 274), and the remarks note that the neighboring property at 402 2nd Avenue must be sold together as one package.
The offering is positioned in the heart of Long Branch and is described as being just steps from Pier Village and the beaches, along with the boardwalk and surrounding local amenities. Public transportation access is also referenced, which may be helpful for tenant convenience. The property is in an R-4 zone, and the remarks indicate it is located among higher-valued properties in the area.
For an owner-operator or investor seeking a small, manageable rental configuration, this quadplex structure provides four separate units within a two-building setup. The month-to-month leasing terms offer flexibility for ongoing management, while landlord-paid water and sewer can reduce tenant friction and ongoing administrative burden. Additionally, the stated requirement to sell with the adjacent 8-family property may appeal to buyers looking to control a larger parcel within the same package.
The offering is positioned in the heart of Long Branch and is described as being just steps from Pier Village and the beaches, along with the boardwalk and surrounding local amenities. Public transportation access is also referenced, which may be helpful for tenant convenience. The property is in an R-4 zone, and the remarks indicate it is located among higher-valued properties in the area.
For an owner-operator or investor seeking a small, manageable rental configuration, this quadplex structure provides four separate units within a two-building setup. The month-to-month leasing terms offer flexibility for ongoing management, while landlord-paid water and sewer can reduce tenant friction and ongoing administrative burden. Additionally, the stated requirement to sell with the adjacent 8-family property may appeal to buyers looking to control a larger parcel within the same package.
Key Highlights
- Multi‑family complex with 2 buildings and 4 rental units across two lots
- Month‑to‑month leases for all tenants
- Landlord pays water & sewer expenses; water source is public and sewer is public sewer
Local Financial Insights For Multifamily LT 5
Simulate Cap Rate and NOI
NOI Build-Up
- Vacancy
- income lost from leasable area expected to sit empty during the year — subtracted from gross rent.
- EGI (Effective Gross Income)
- gross rent minus vacancy losses — the realistic income before paying operating costs.
- OpEx (Operating Expenses)
- recurring costs to operate the property (property tax, insurance, utilities, maintenance, management) — excludes financing and capital improvements.
- NOI (Net Operating Income)
- income a property generates after operating costs but before financing and taxes.
| Component | $ | $/SF |
|---|---|---|
| Gross rent | $90.6k | $25.56 |
| − Vacancy | −$5.9k | −$1.65 |
| EGI | $84.8k | $23.91 |
| − OpEx | −$25.4k | −$7.17 |
| NOI | $59.3k | $16.74 |
3,546 SF · lease $25.56/SF/yr · vacancy 6.46% · expense 30.00%
Alternative Uses
Best Use
Multifamily LT 5
$847.8K
$741.8K – $989.1K
NOI $59,346 @ 7.0% cap · market cap 3.44%
Second Best
Apartment 5plus
$779.0K
$681.6K – $908.8K
NOI $54,530 @ 7.0% cap · market cap 3.16%
Theoretical Best
Office A
$925.9K
$810.2K – $1.08M
NOI $64,815 @ 7.0% cap · market cap 3.76%
Zoning and permitted uses should be independently verified with local authorities.
Property Analytics
Property Profile
Location Intelligence
Current Use by Public Records
Quadplexes
Similar For Sale Nearby



FAQs
What type of property is this?
Quadplex - Two-building quadplex on separate lots, with landlord-paid water and sewer and month-to-month tenants.
Where is this quadplex located?
The property is located at 396 2nd Avenue Long Branch, NJ.
What is the asking price?
The asking price for this property is $1,725,000.
What are key features of this property?
This property features: Multi‑family complex with 2 buildings and 4 rental units across two lots; Month‑to‑month leases for all tenants; Landlord pays water & sewer expenses; water source is public and sewer is public sewer


