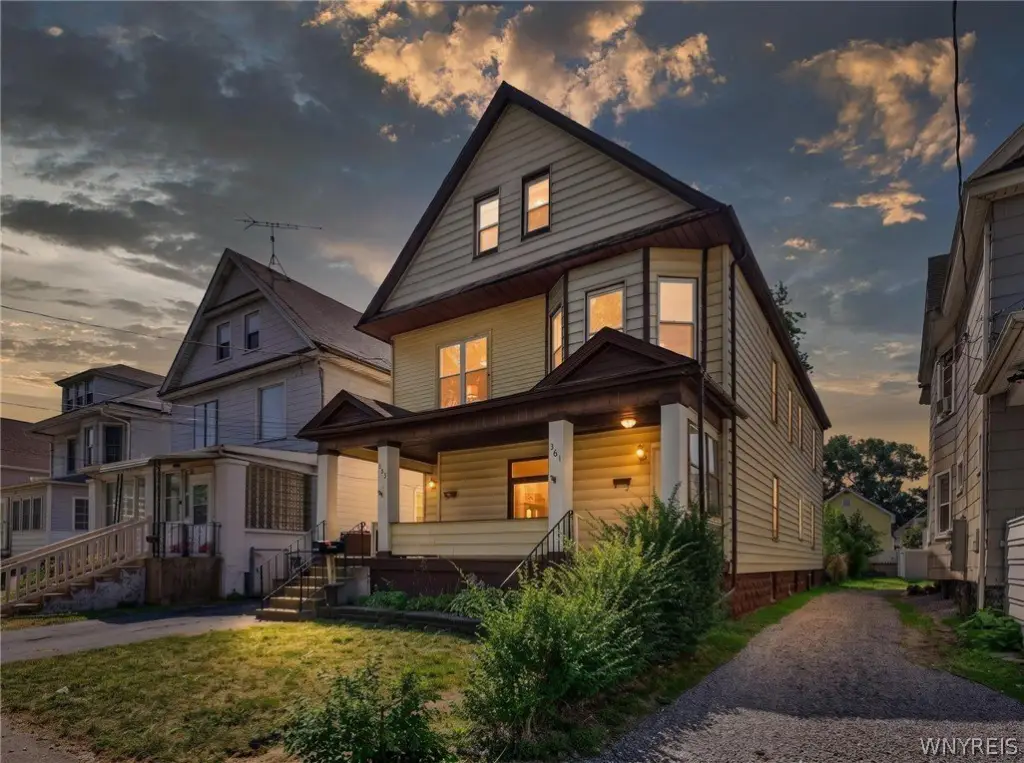
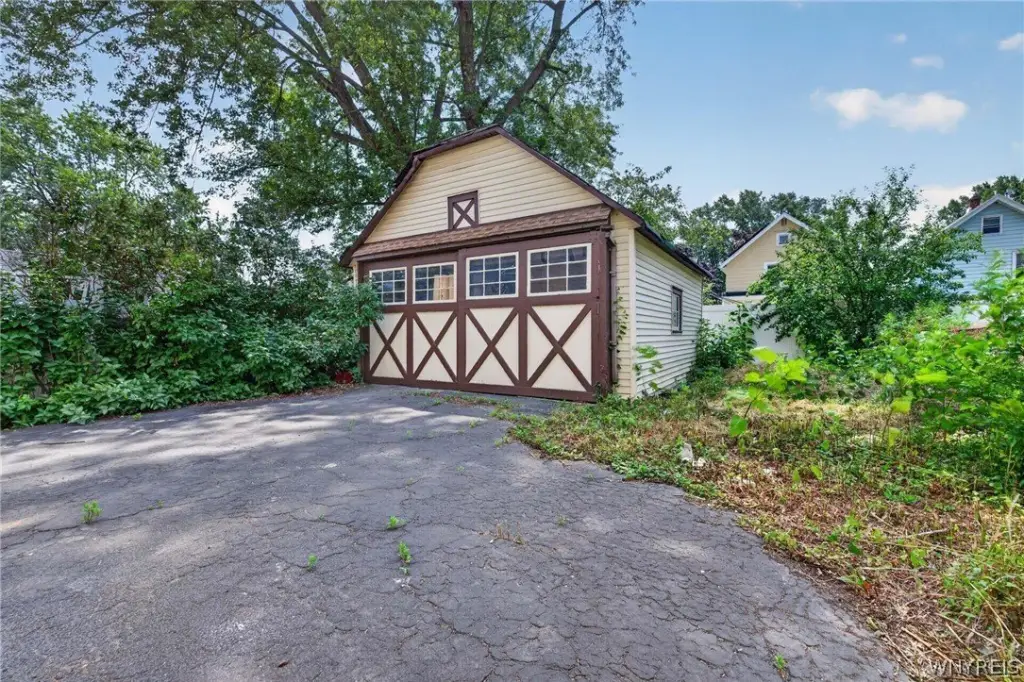
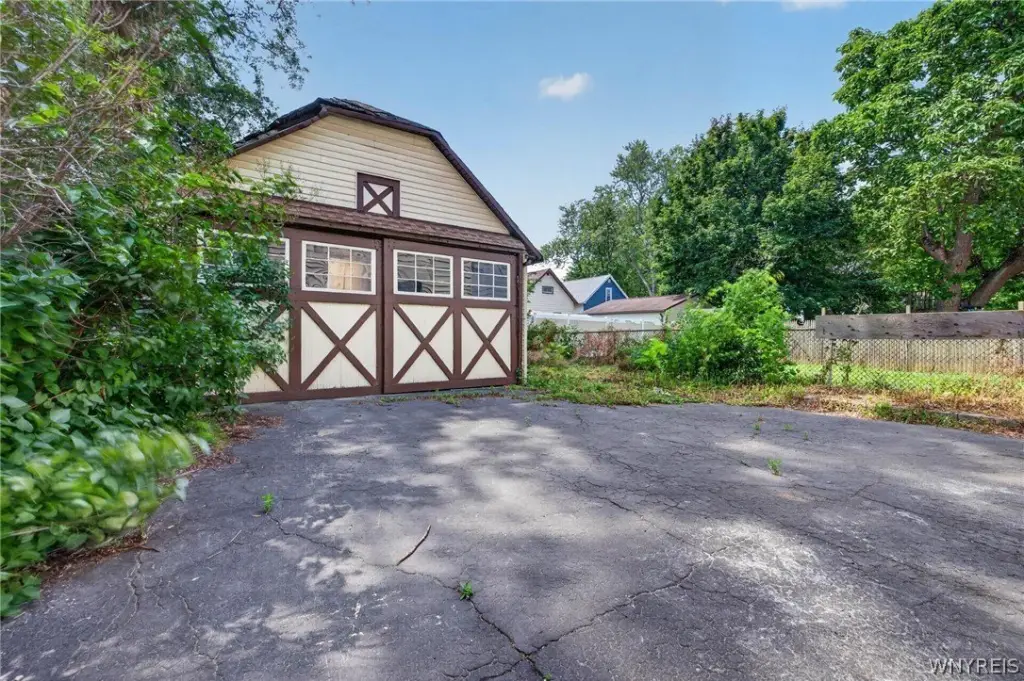
Renovated Duplex with Two-Car
For Sale
$264,900
361 Marilla Street, Buffalo, NY 14220
Residential, Buffalo, NY
Property Size2,484 SF
Lot Size0.09 Acres
Price / SF$106.64
Days on Market80
Property Features for 361 Marilla Street
General Information
Property type
Residential Multi Family
Property subtype
Duplex
Bedrooms
5
Bathrooms
2
Full bathrooms
2
Rooms
Bedroom 4, Bedroom 1, Bedroom 5, Bathroom 2, Basement, Bedroom 2, Bedroom 3, Bathroom 1
Parking features
Garage
Patio and Porch features
Porch
Interior features
CeilingFans, BedroomOnMainLevel
Exterior features
FullyFenced, PrivateYard
Fencing
Fenced
Appliances
GasWaterHeater
Subdivision
Buffalo Crk Reservation
Lot features
Rectangular, Rectangular Lot, Residential Lot
Elementary school district
Buffalo
Middle school district
Buffalo
High school district
Buffalo
Directions
South Park to Marilla
Standard status
Active
APN
140200-133-700-0002-004-000
Size
2,484 SF
Lot size
0.09 Acres
Taxes and HOA fees
Tax Annual Amount
3369
Utilities
Heating system
Natural Gas, Forced Air
Water source
Public
Amenities
in-unit laundry
front deck
yard
Building Details
Year built
1930
Floors in Building
2
Number of units
2
Flooring type
Vinyl, Hardwood, Varies
Building materials
VinylSiding, PexPlumbing
Roof type
Asphalt
Architectural style
Other
Listing Agency:
Keller Williams Realty WNY
(716) 832-3300
Listed By:
Timothy Healy · License #10401379877
(716) 770-9205
Added: Jul 21
Changed: Oct 1
Last Checked: Oct 8 at 9:06PM
MLS# B1697144
Copyright © 2026 New York State Alliance of MLSs, LLC. All rights reserved. All information provided by the listing agent/broker is deemed reliable but is not guaranteed and should be independently verified.
Investment Insights
Based on property information with market context.
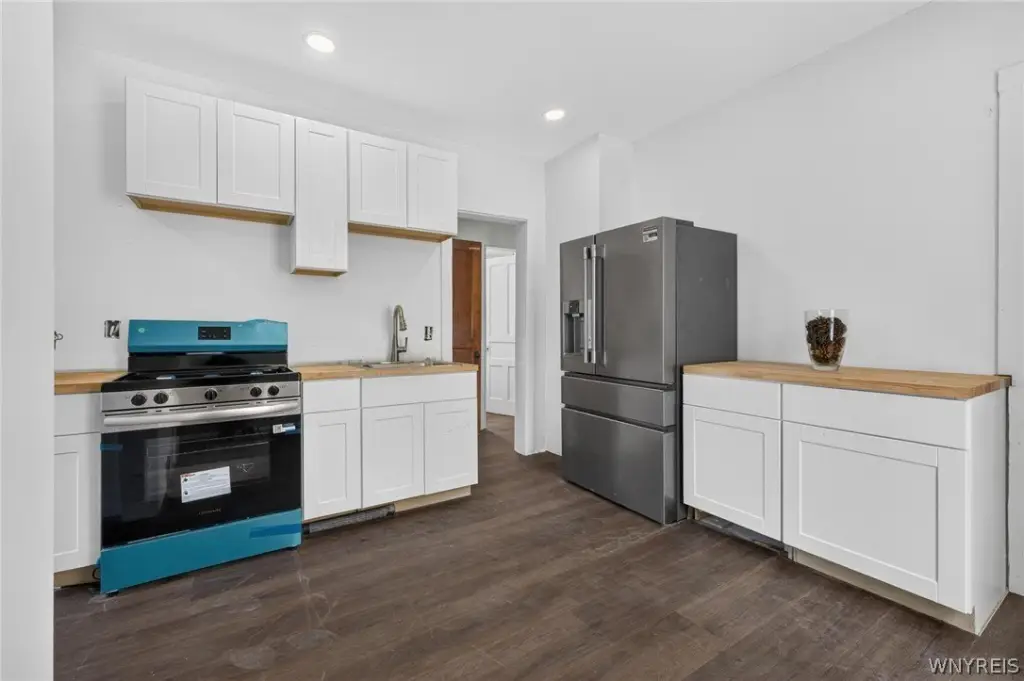
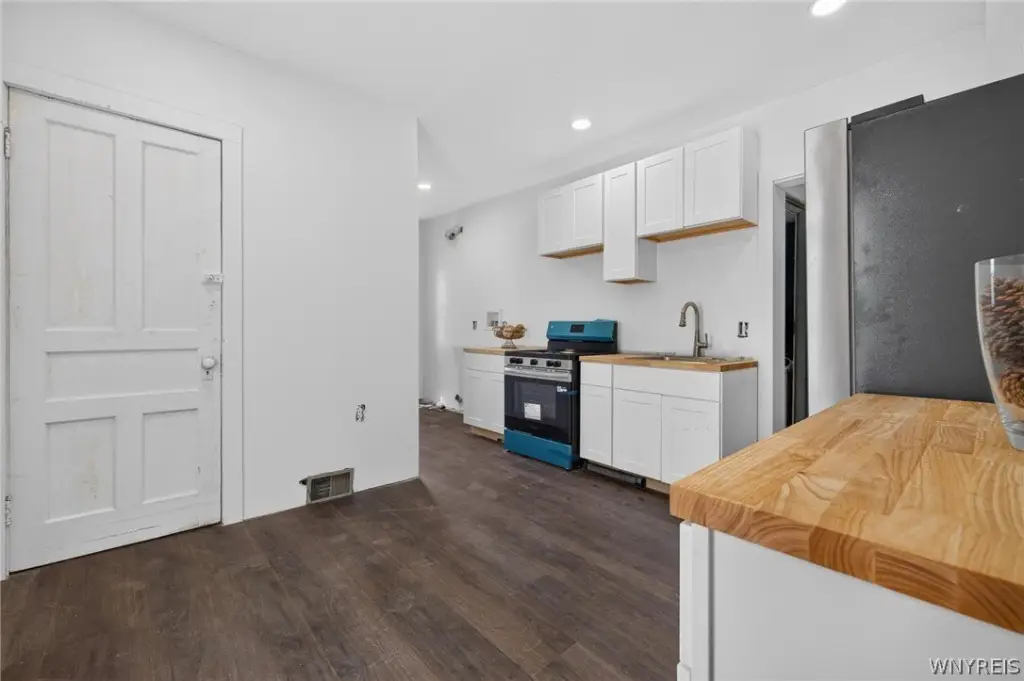
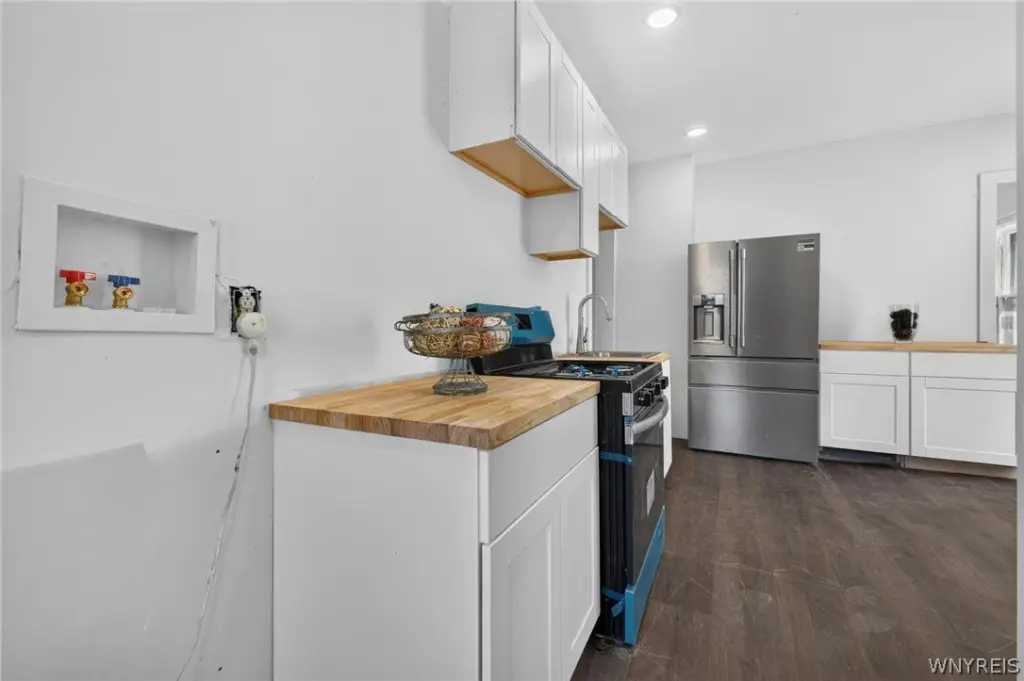
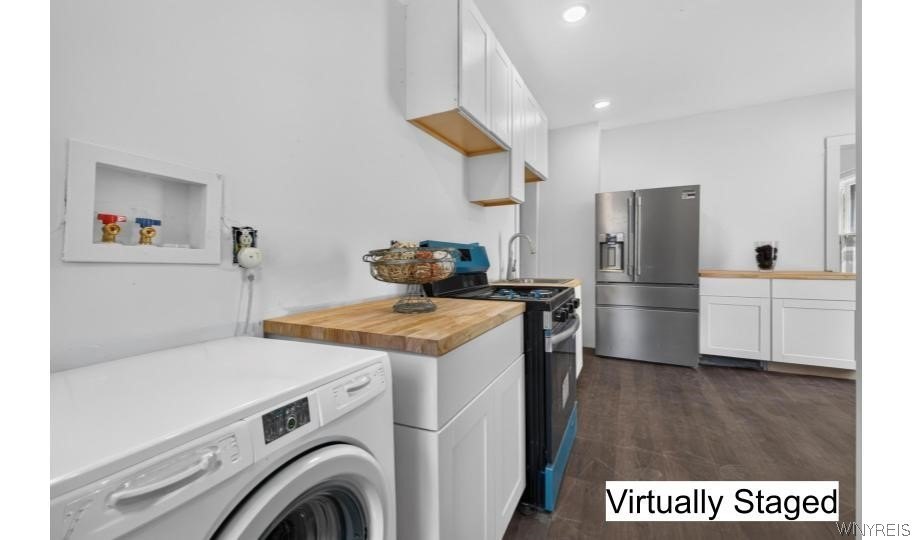
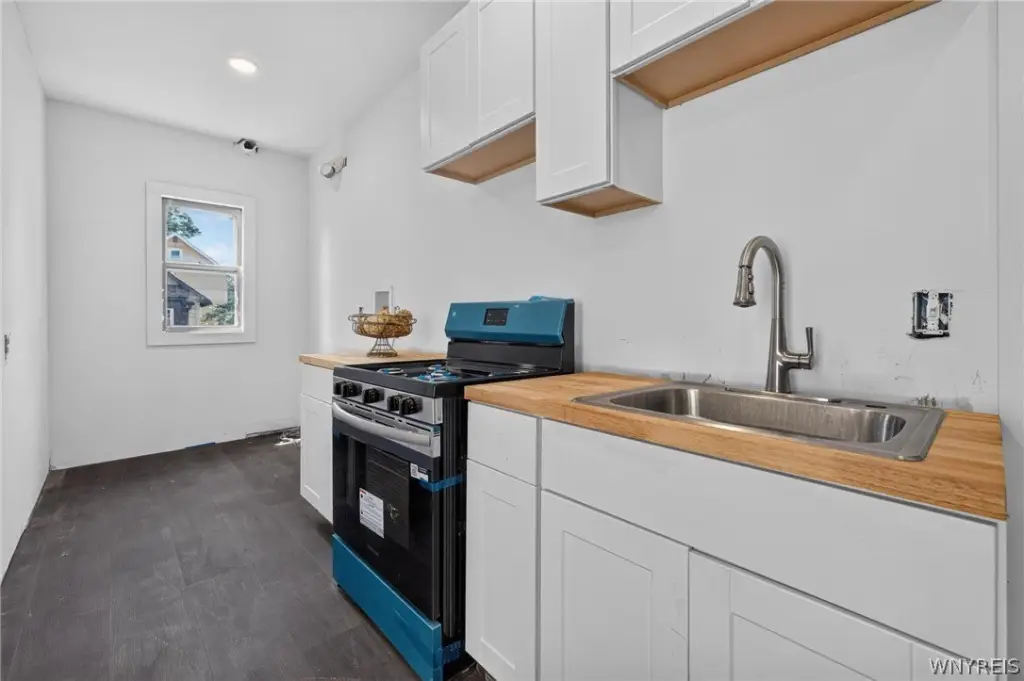
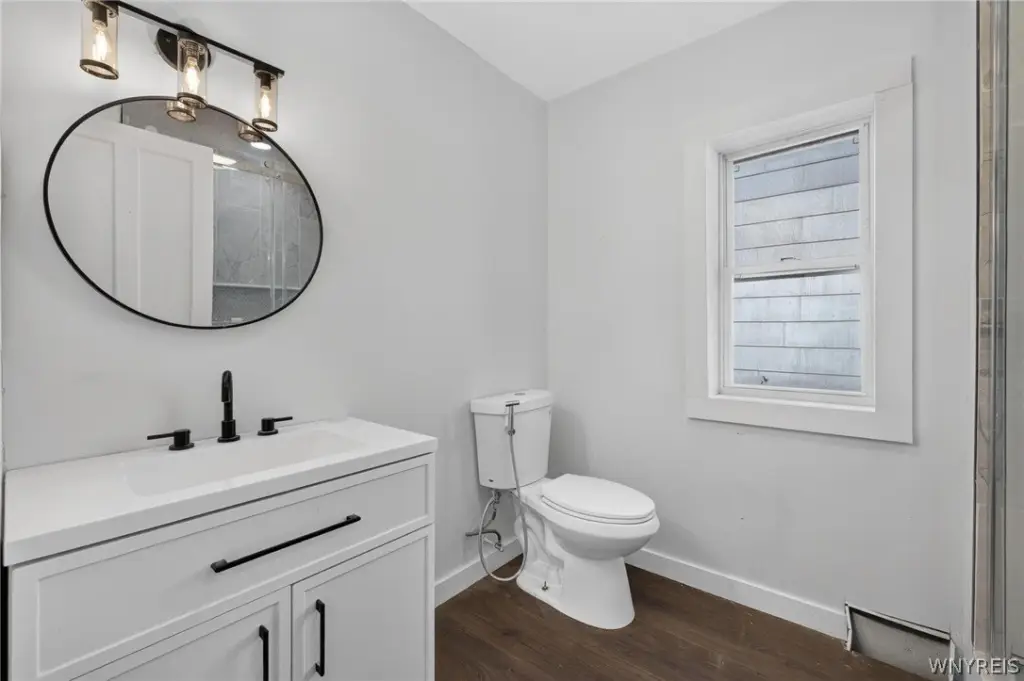
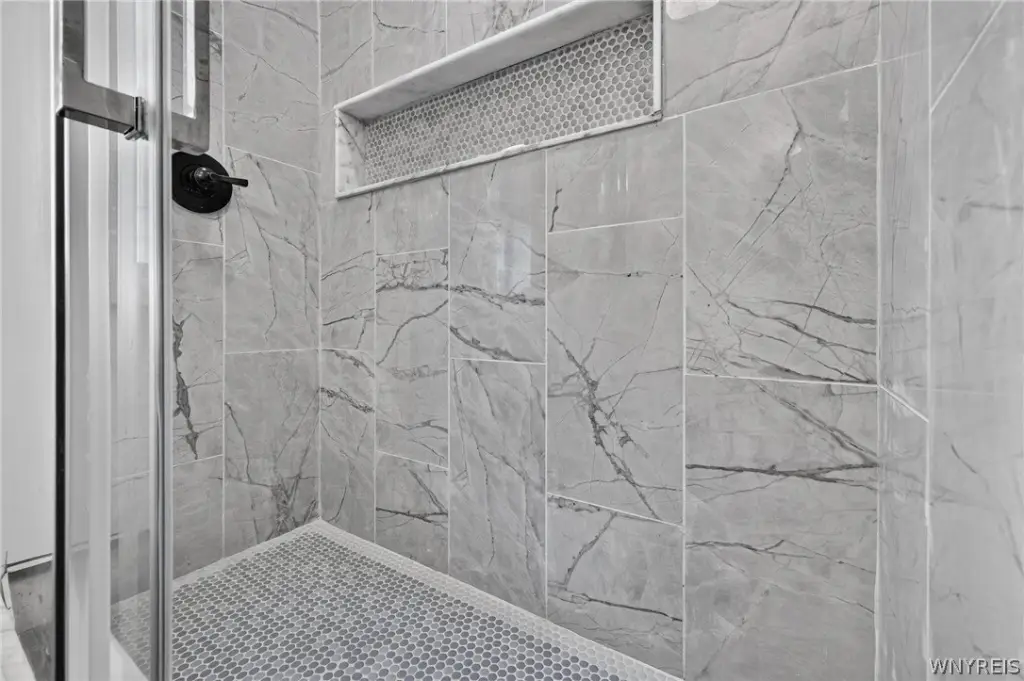
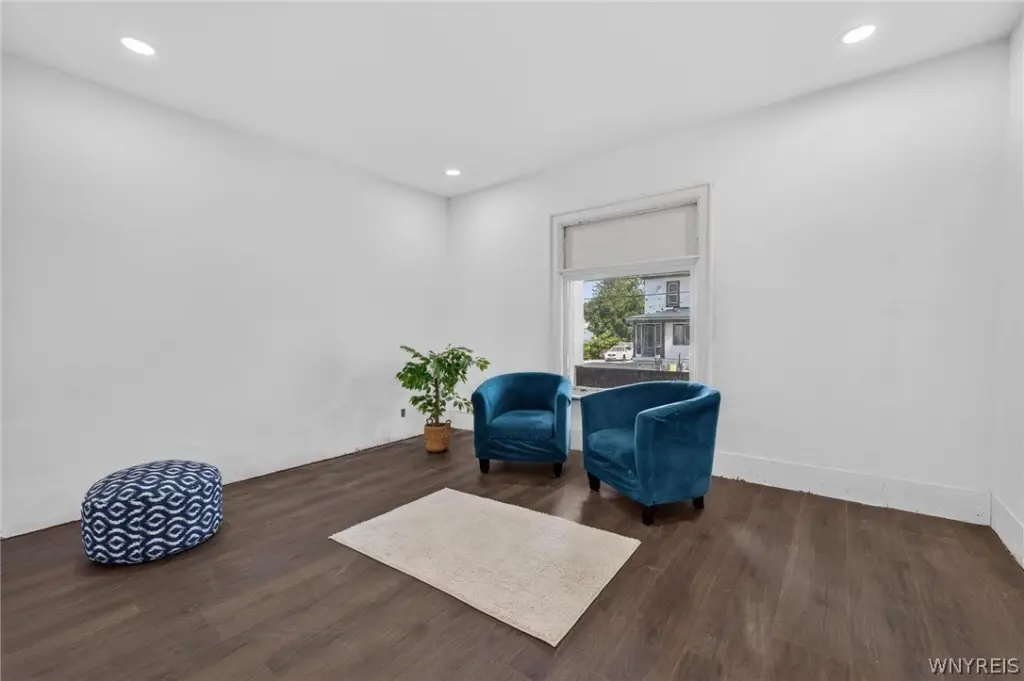
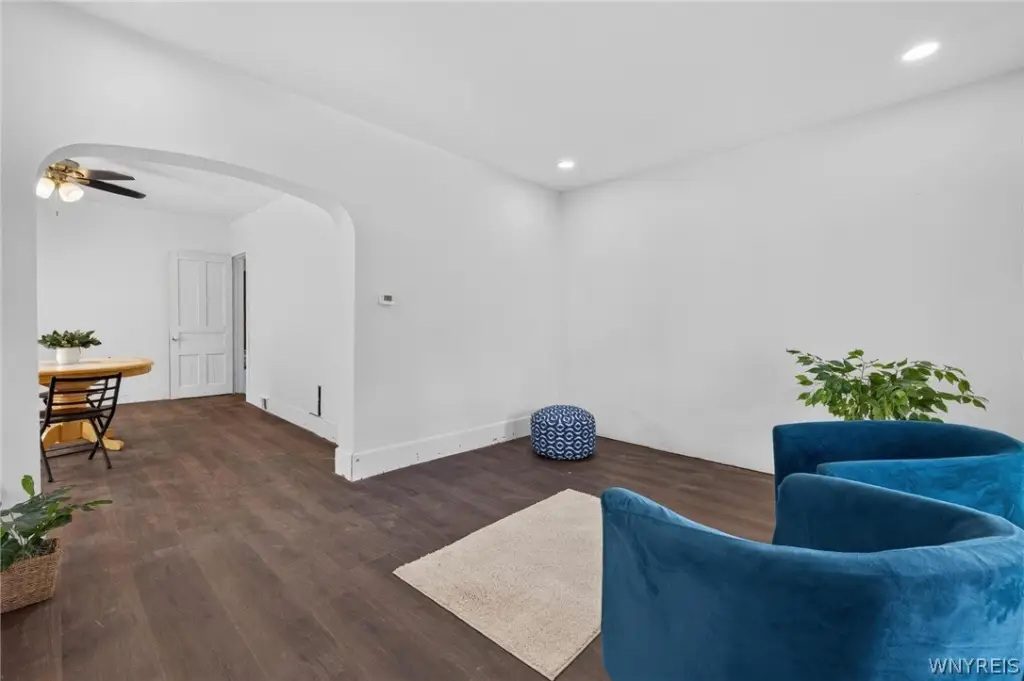
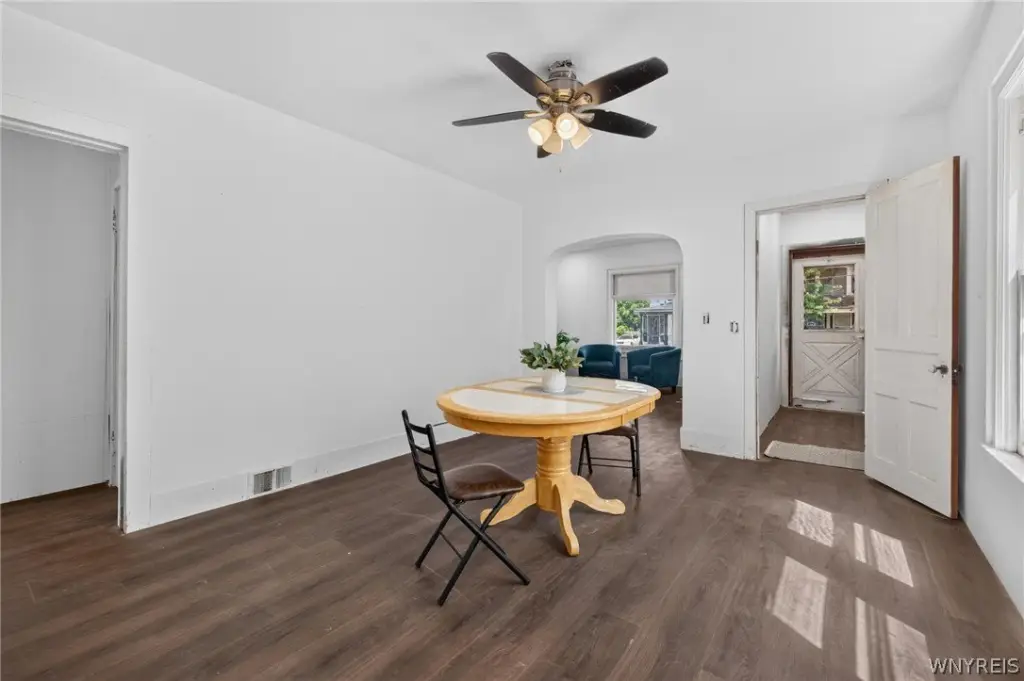
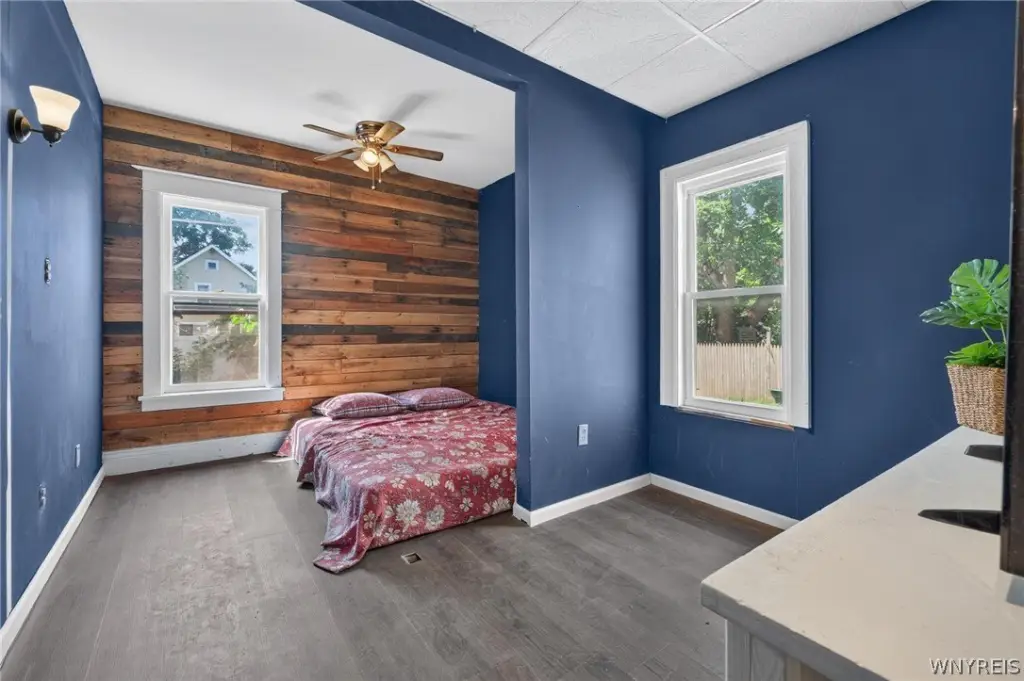
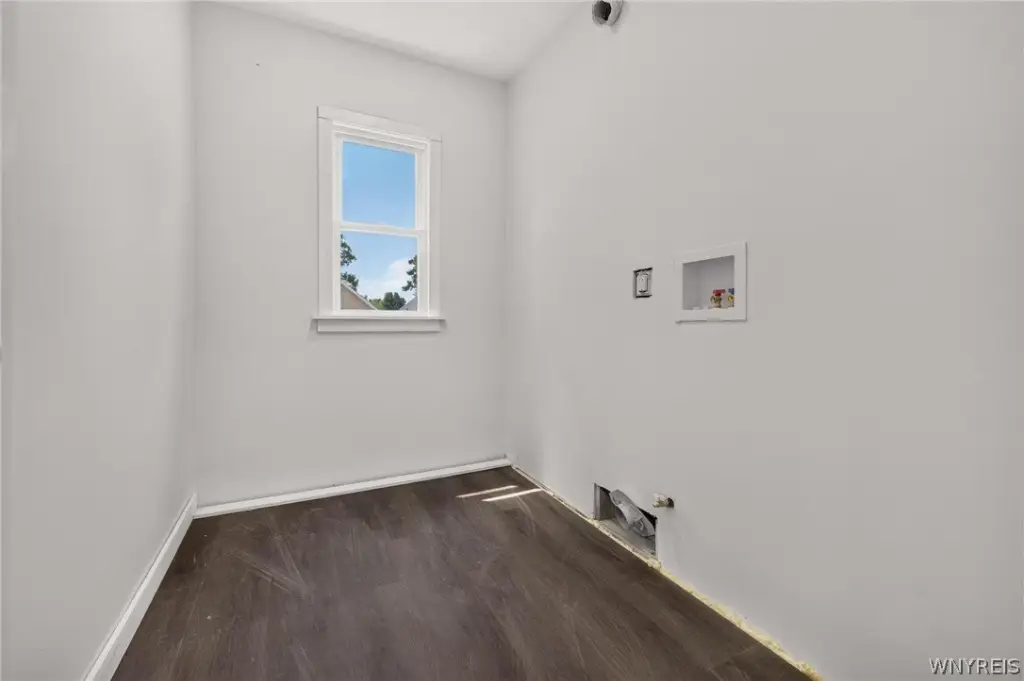
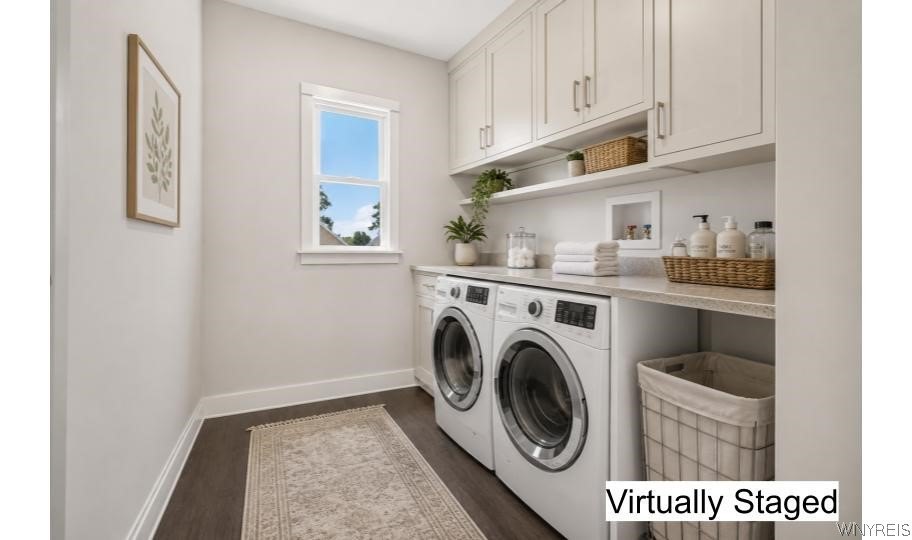
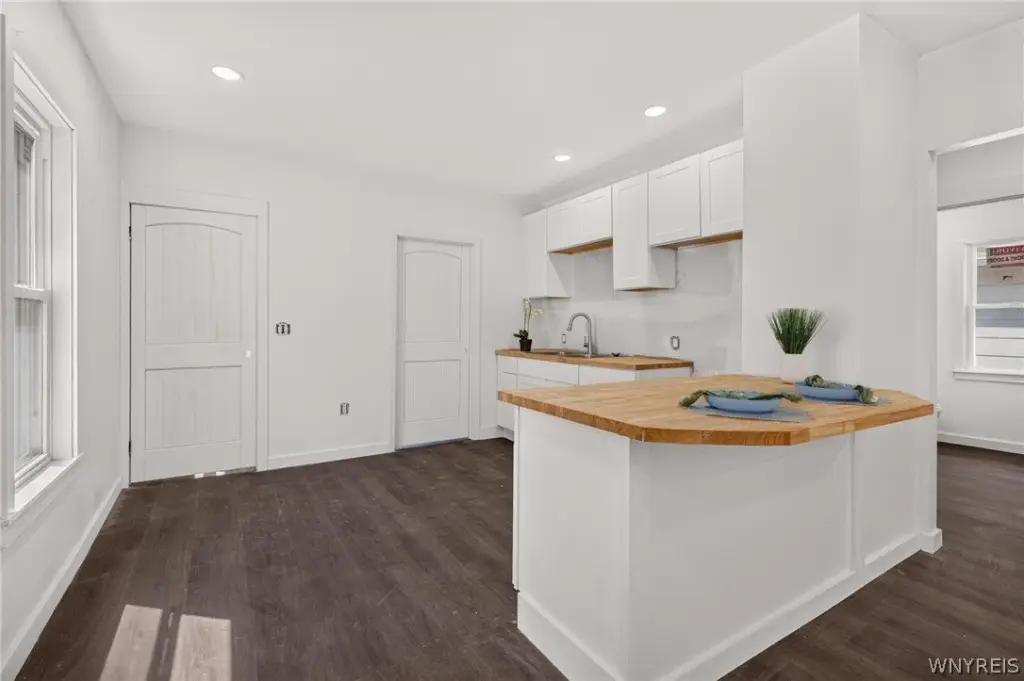
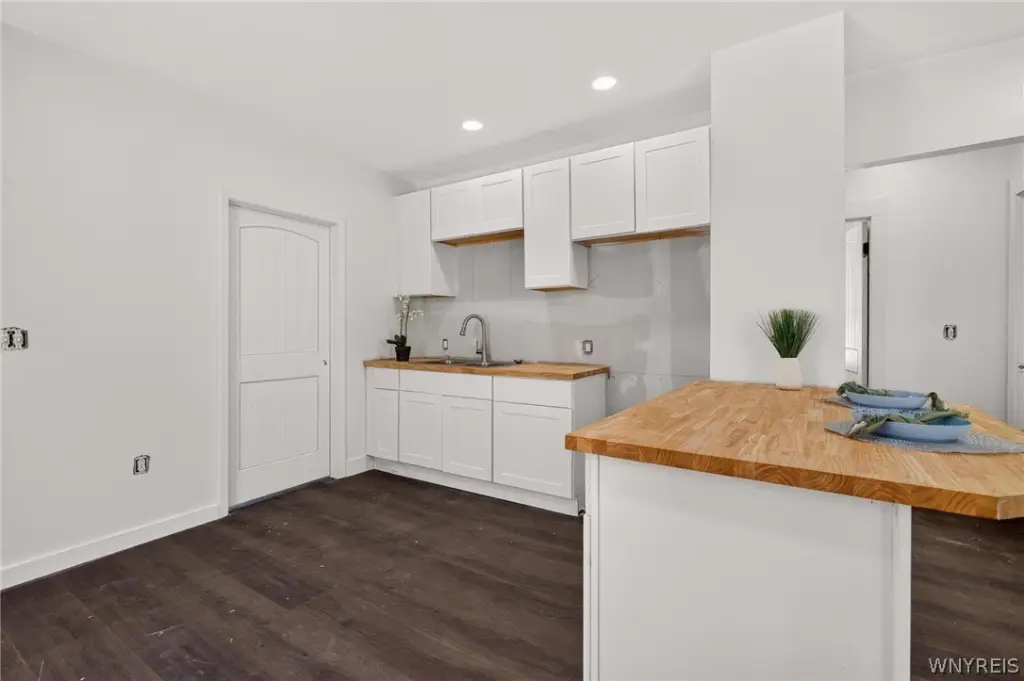
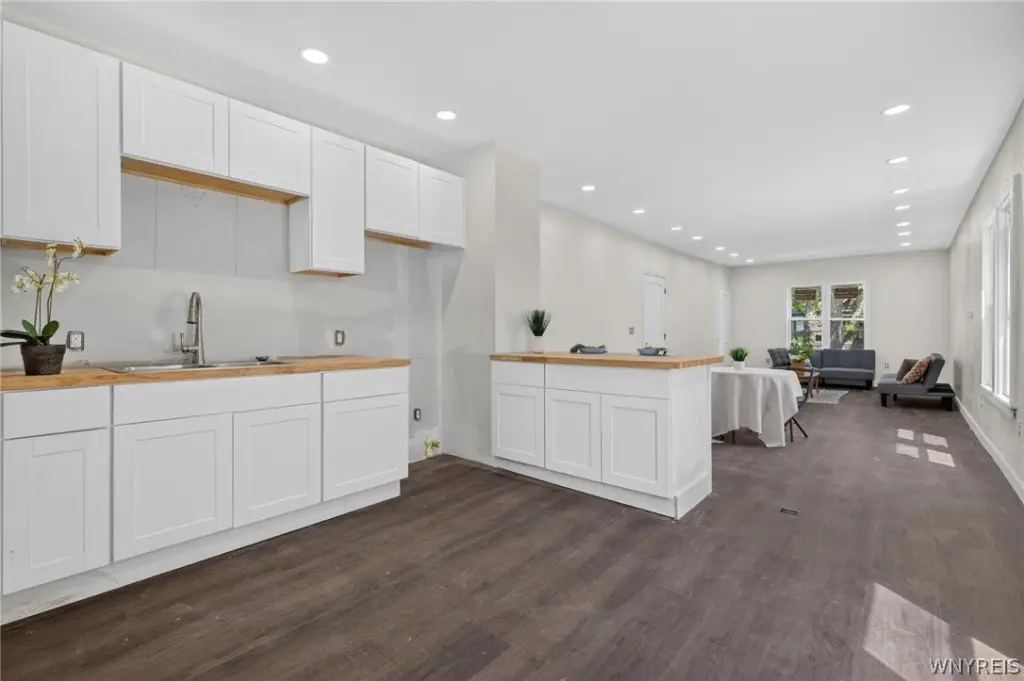
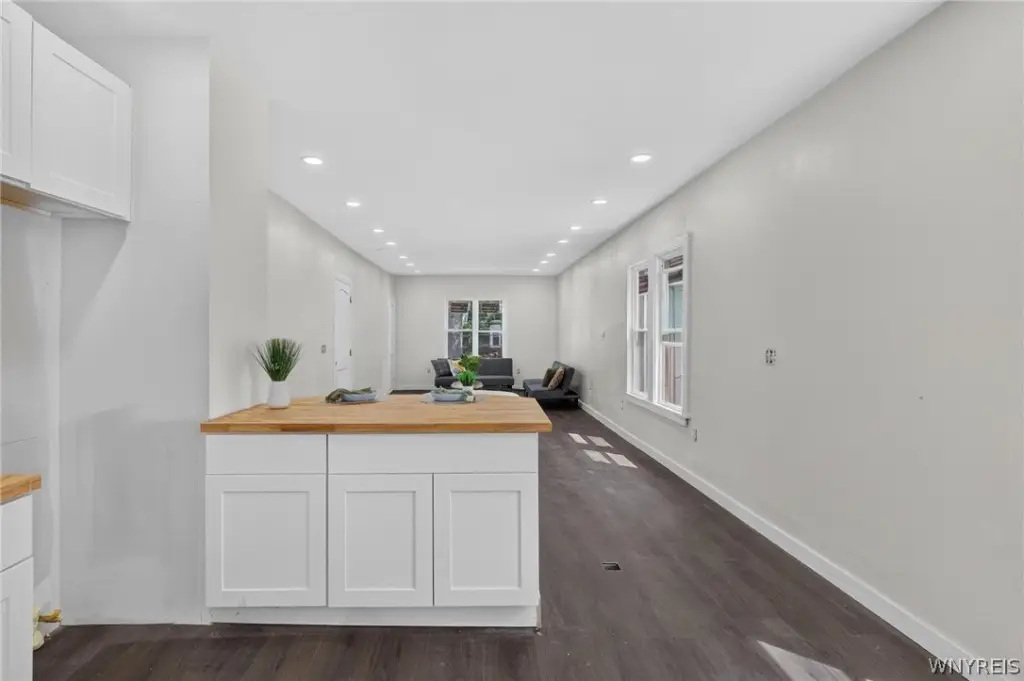
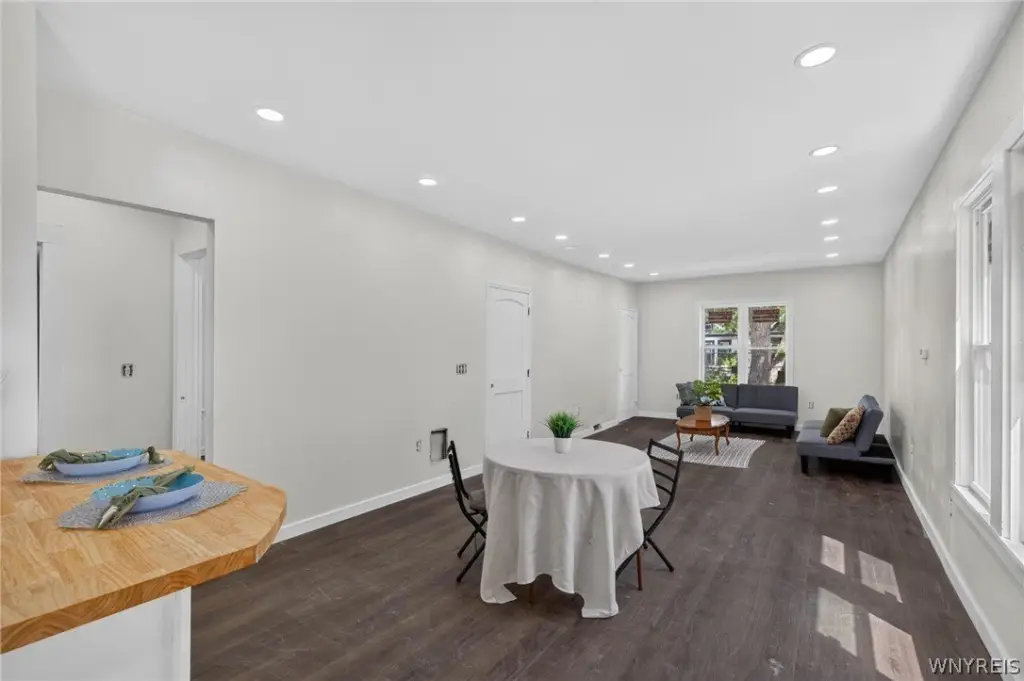
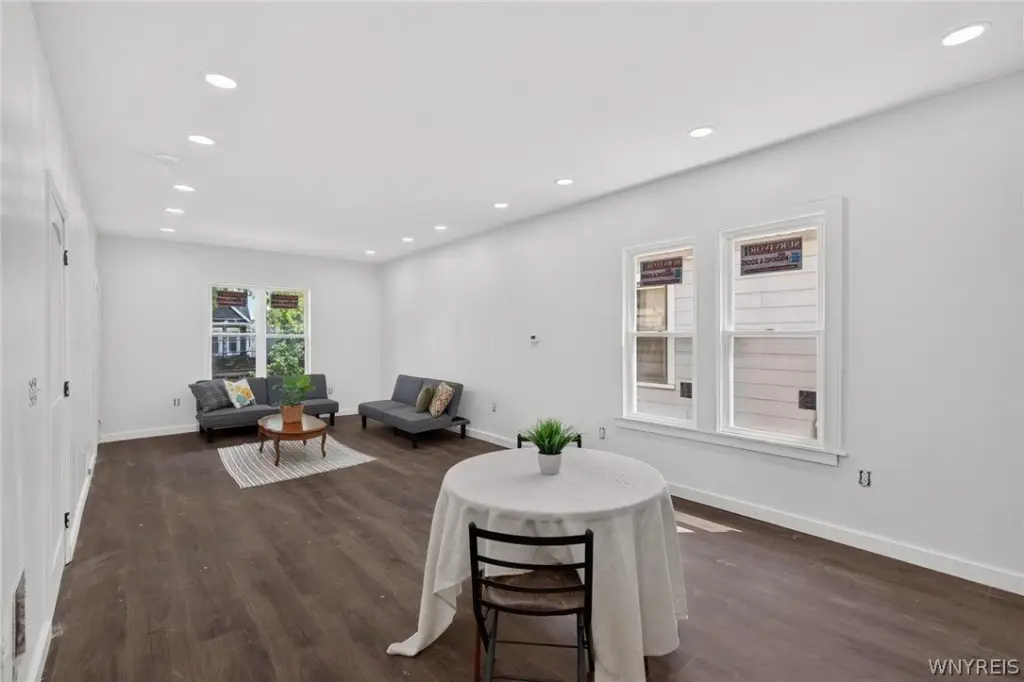
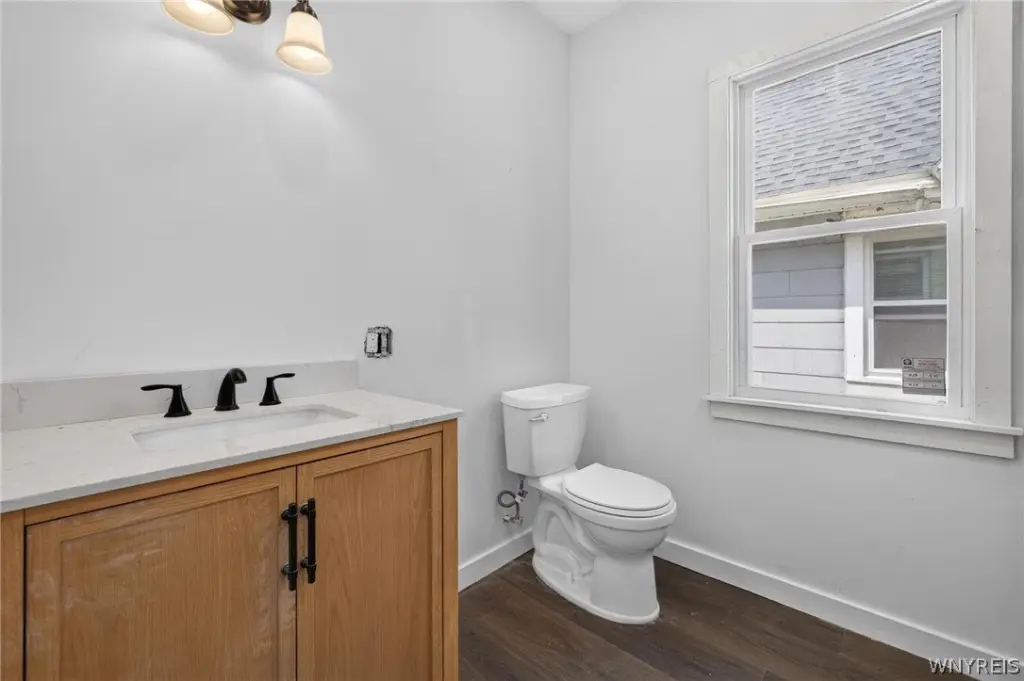
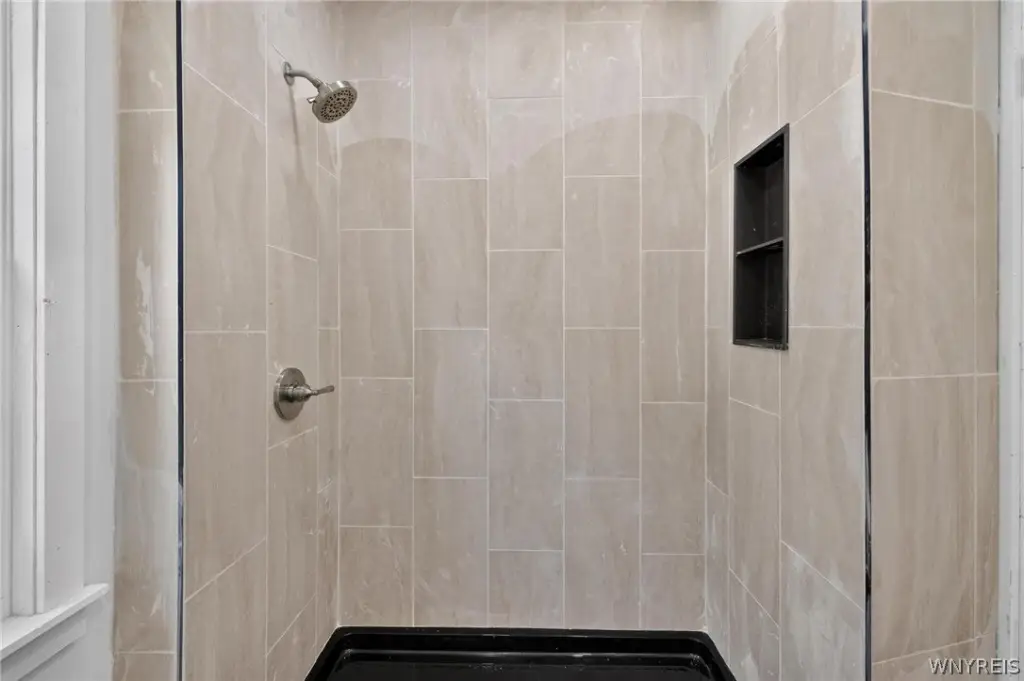
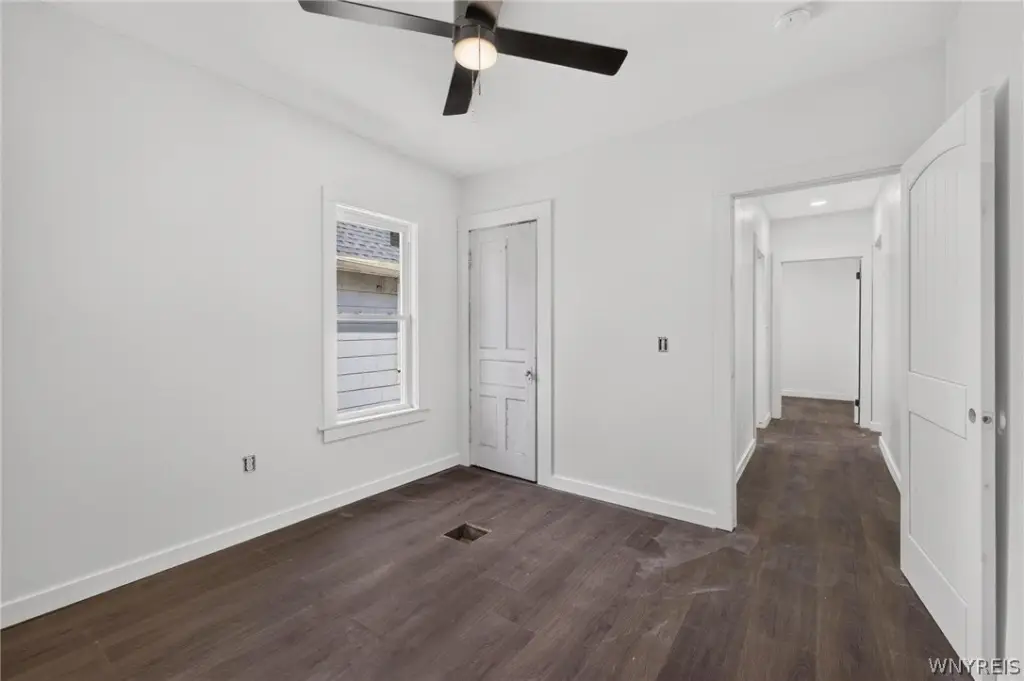
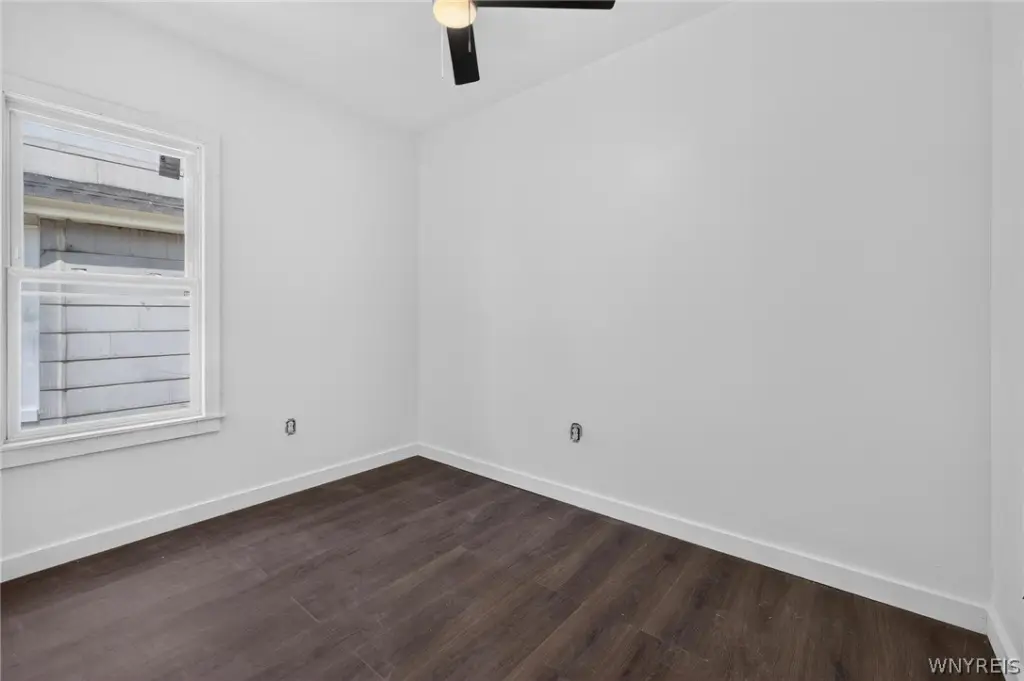
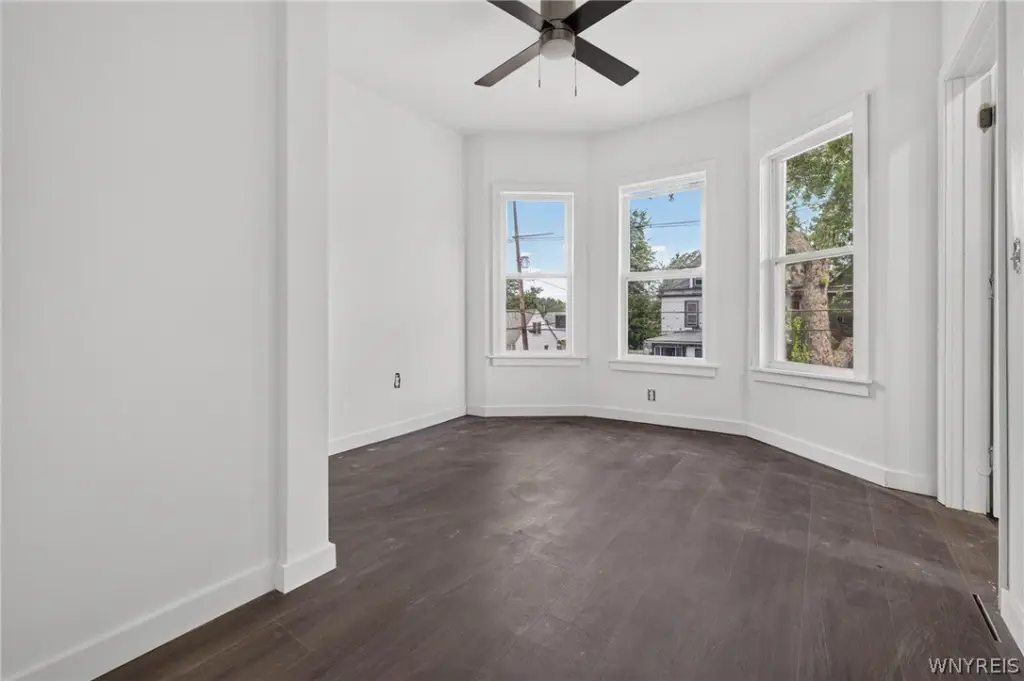
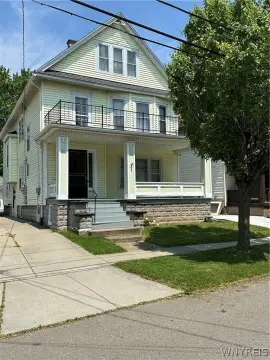
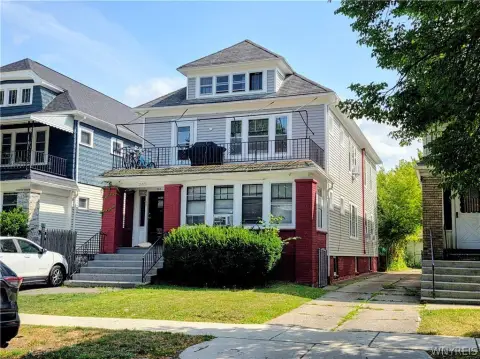
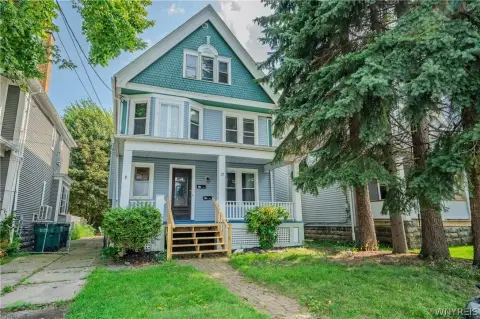
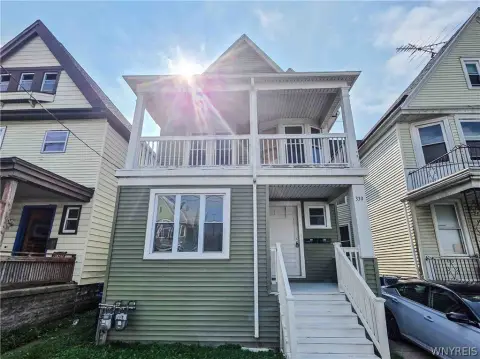
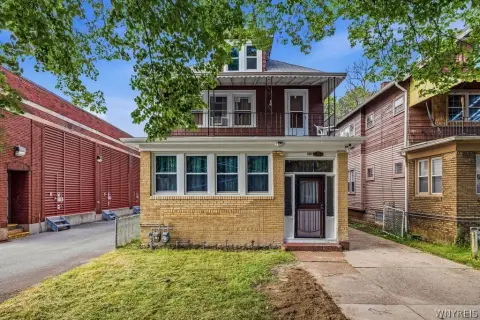
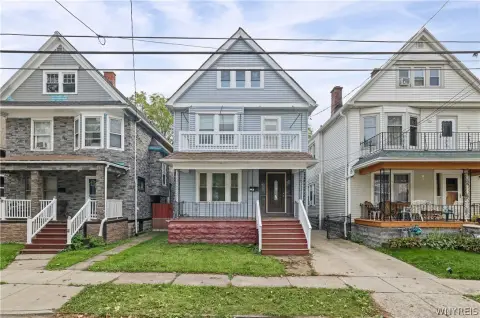
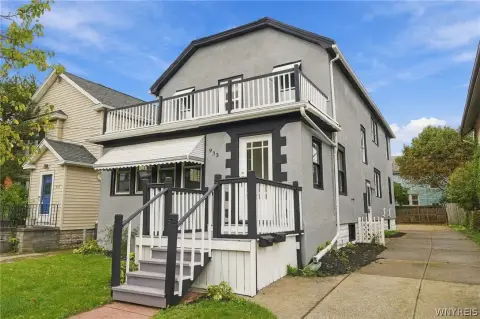
This 2,484-square-foot duplex in Buffalo’s South Buffalo area contains two renovated apartments. The lower unit offers two bedrooms, one bathroom, a formal dining room, a spacious living room, and a newly finished kitchen. The upper apartment includes three bedrooms, one bathroom, an open interior arrangement, and abundant natural light. Each unit has in-unit laundry, updated kitchens and bathrooms, and new finishes including 7mm commercial-grade vinyl flooring, drywall, and paint.
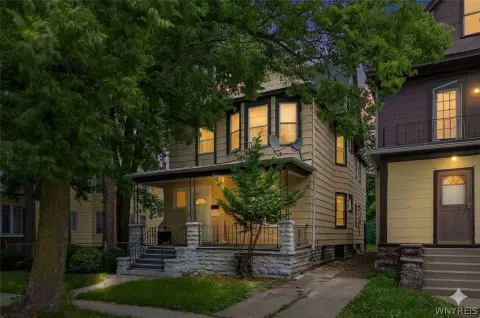
Renovation work was completed by licensed contractors with permits in 2025-2026. Improvements include new plumbing throughout, second-floor electrical wiring, breakers serving both units, separate water and electric meters, two hot water tanks, 17 windows, and new insulation. The property also includes a detached two-car garage, front deck, fenced yard, vinyl siding, forced-air natural-gas heat, and public water. Built in 1930, it is located at 361 Marilla Street in Buffalo, NY 14220.
Renovation work was completed by licensed contractors with permits in 2025-2026. Improvements include new plumbing throughout, second-floor electrical wiring, breakers serving both units, separate water and electric meters, two hot water tanks, 17 windows, and new insulation. The property also includes a detached two-car garage, front deck, fenced yard, vinyl siding, forced-air natural-gas heat, and public water. Built in 1930, it is located at 361 Marilla Street in Buffalo, NY 14220.
Key Highlights
- 2,484‑square‑foot duplex with two apartments
- Lower unit has 2 bedrooms; upper unit has 3 bedrooms
- Renovated by licensed contractors with permits in 2025‑2026
Financial Insights
Estimated NOI and Cap Rate
NOI / Yr
$22,702
Cap Rate
8.57%
Suggested Prices Based on Cap Rates
Cap Rate 5%
$454,040
$454.0K
Cap Rate 7%
$324,314
$324.3K
Cap Rate 9%
$252,244
$252.2K
Market Conditions
NOI Build-Up for 2,484 SF
Gross rent
$43.2K $17.40/SF
− Vacancy
−$1.9K −$0.78/SF
EGI
$41.3K $16.62/SF
− OpEx
−$18.6K −$7.48/SF
NOI
$22.7K $9.14/SF
Area
Buffalo, NY
Vacancy
4.50%
Lease Rate
$17.40 /SF/Yr
Expense Ratio
45.00%
Simulate Cap Rate and NOI
Suggested Prices Based on Cap Rates
Cap Rate 5%
$454,040
Cap Rate 7%
$324,314
Cap Rate 9%
$252,244
Alternative Uses
Best Use
Multifamily LT 5
$352.1K
$308.1K – $410.8K
NOI $24,647 @ 7.0% cap · market cap 9.30%
Second Best
Apartment 5plus
$324.3K
$283.8K – $378.4K
NOI $22,702 @ 7.0% cap · market cap 8.57%
Theoretical Best
Office A
$597.4K
$522.7K – $696.9K
NOI $41,815 @ 7.0% cap · market cap 15.79%
Zoning and permitted uses should be independently verified with authorities.
Property Analytics
Unlock full access to Insights
Subscribe to Realmo Intelligence
Open Analytics
Current Use
Lease Details
2
Residential units
Location Intelligence
Trade Area within ½ mile
308
Businesses Nearby
Explore this area
Business Placement
Demographics for 14220, NY
23,959
Population
11,286
Households
2.1
Avg Household Size
38
Median Age
28%
College-Educated
93%
High-School Grad
3.8 sq mi
ZIP Area
6,305
Density / Sq Mi
$68,337
Median Household Income
$42,112
Median Earnings
$974
Median Rent
$180,200
Median Home Value
Check the figures for this property
Cap Rate, Value Estimation, Potential NOI and more
View Realmo Analytics
Market
Vacancy Rate% for Multifamily in Northeast region

Questions? Ask Rey
Realmo’s AI knows this listing — price, zoning, demand, history. Ask anything.
Frequently Asked Questions
What type of property is this?
Duplex - Fully updated two-unit property with separate kitchens, in-unit laundry, and a detached garage.
Where is this duplex located?
The property is located at 361 Marilla Street Buffalo, NY.
What is the asking price?
The asking price for this property is $264,900.
What are key features of this property?
This property features: 2,484‑square‑foot duplex with two apartments; Lower unit has 2 bedrooms; upper unit has 3 bedrooms; Renovated by licensed contractors with permits in 2025‑2026


