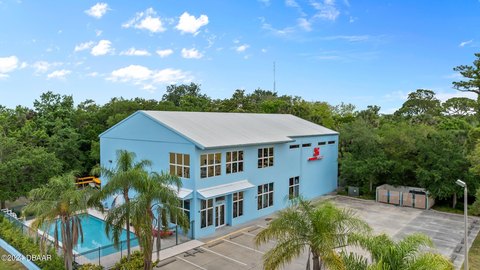
Renovated Multifamily Apartment
For Sale
$6,000,000
1890 S Palmetto Avenue, South Daytona, FL 32119
Commercial Sale, South Daytona, FL
Property Size33,000 SF
Lot Size0.75 Acres
Price / SF$181.82
Days on Market78
Property Features for 1890 S Palmetto Avenue
General Information
Property type
Commercial Sale
Property subtype
Other
Bathrooms
40
Full bathrooms
40
Rooms
Bathroom 12, Bathroom 36, Bathroom 15, Bathroom 25, Bathroom 34, Bathroom 24, Bathroom 39, Bathroom 18, Bathroom 38, Bathroom 22, Bathroom 26, Bathroom 2, Bathroom 21, Bathroom 9, Bathroom 20, Bathroom 29, Bathroom 17, Bathroom 27, Bathroom 4, Bathroom 10, Bathroom 40, Bathroom 19, Bathroom 30, Bathroom 14, Bathroom 35, Bathroom 7, Bathroom 6, Bathroom 13, Bathroom 31, Bathroom 32, Bathroom 37, Bathroom 16, Bathroom 3, Bathroom 11, Bathroom 28, Bathroom 23, Bathroom 1, Bathroom 33, Bathroom 5, Bathroom 8
Parking features
Assigned
Directions
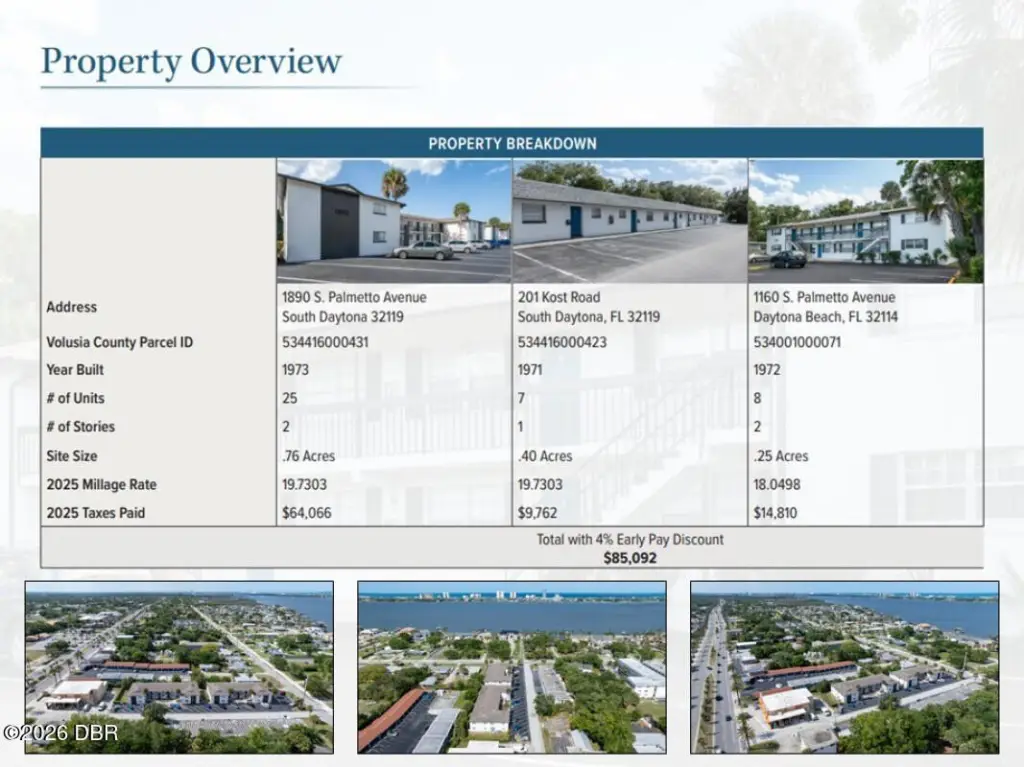
From Beville Rd continue to S Palmetto Ave. North .6 Miles for 1160 Palm. and South .5 miles for 1180 Palm. Both West of road.
Subdivision
25 - Daytona S of Beville, E of Nova
Standard status
Active
APN
5344-16-00-0431
Size
33,000 SF
Lot size
0.75 Acres
Taxes and HOA fees
Tax Year
2025
Tax Description
E 331 FT OF LOT 43A E OF RIDGEWOOD AVE BLAKE DB E PG 150 MB 1 PG 38 PER OR 4673 PGS 1318-1319 PER OR 4673 PGS 1539-1540 PER OR 7792 PG 4778 PER OR 8452 PG 2562
Tax Annual Amount
64066
Legal Description
E 331 FT OF LOT 43A E OF RIDGEWOOD AVE BLAKE DB E PG 150 MB 1 PG 38 PER OR 4673 PGS 1318-1319 PER OR 4673 PGS 1539-1540 PER OR 7792 PG 4778 PER OR 8452 PG 2562
Building Details
Year built
1973
Number of units
40
Flooring type
Vinyl, Tile
Building materials
Block, Concrete
Listing Agency:
FlatFee.com
(954) 965-3990
Listed By:
Cliff Glansen · License #278017259
(877) 575-5505
Added: Jul 24
Changed: Oct 2
Last Checked: Oct 9 at 8:06AM
MLS# 1228957
Copyright © 2026 Daytona Beach Area Association of Realtors. All rights reserved. All information provided by the listing agent/broker is deemed reliable but is not guaranteed and should be independently verified.
Investment Insights
Based on property information with market context.
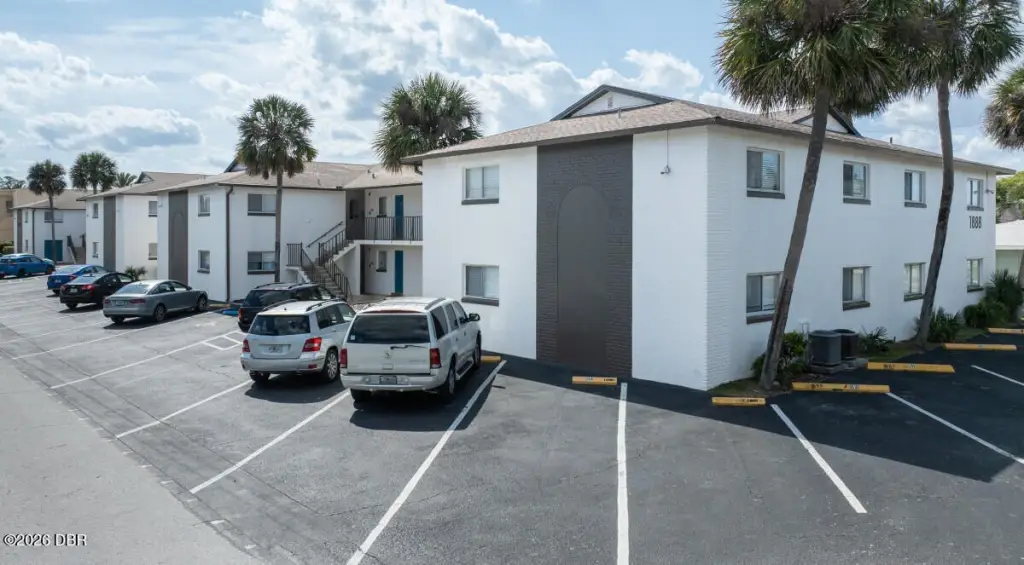
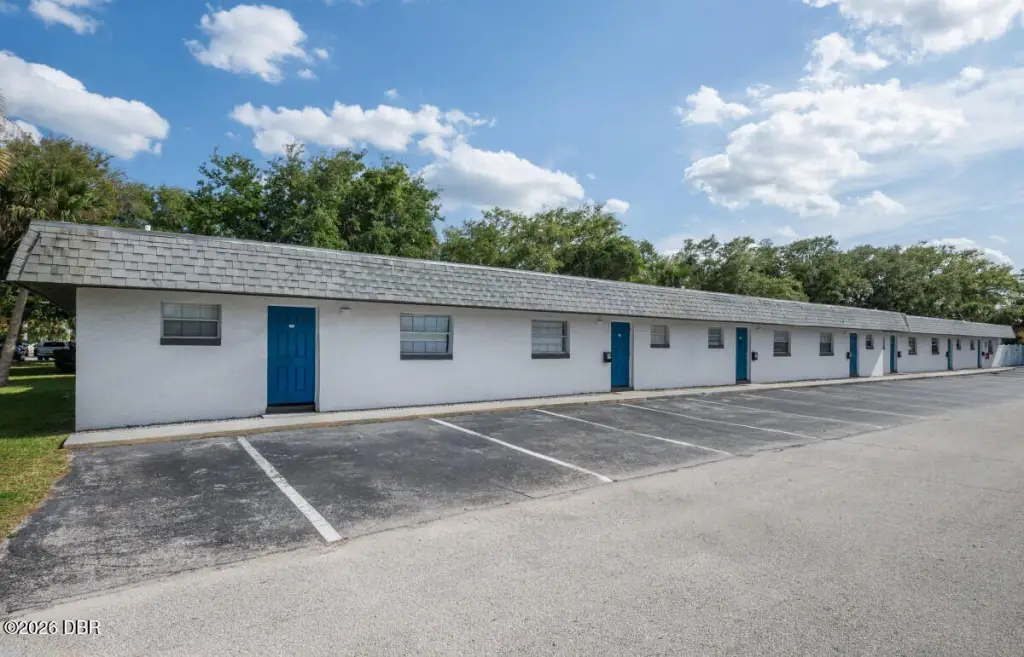
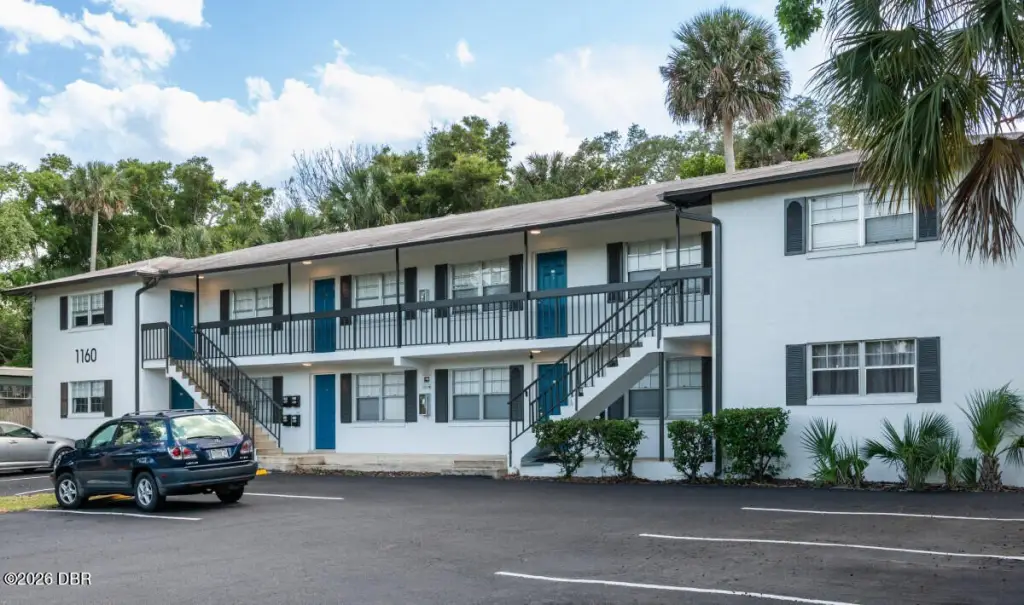
This multifamily portfolio comprises 33,000 square feet across garden-style apartment residences with a mix of one- and two-bedroom floor plans. The property includes 76 bedrooms and 40 bathrooms, with block and concrete construction, vinyl and tile flooring, and assigned parking. Built in 1973, the residences have undergone comprehensive interior renovations along with exterior updates including refreshed paint, soffits, gutters, and monument signage.
The property is located at 1890 S Palmetto Avenue in South Daytona, near the Halifax River corridor and Riverfront Veterans Memorial Park. The park provides boat ramps and recreational amenities in the surrounding area. The site encompasses 0.75 acres and is positioned within a coastal Florida market.
The property is located at 1890 S Palmetto Avenue in South Daytona, near the Halifax River corridor and Riverfront Veterans Memorial Park. The park provides boat ramps and recreational amenities in the surrounding area. The site encompasses 0.75 acres and is positioned within a coastal Florida market.
Key Highlights
- 33,000 square feet of multifamily property on 0.75 acres
- 76 bedrooms and 40 bathrooms across the portfolio
- Garden‑style apartment configuration with one- and two‑bedroom layouts
Financial Insights
Estimated NOI and Cap Rate
NOI / Yr
$251,461
Cap Rate
4.19%
Suggested Prices Based on Cap Rates
Cap Rate 5%
$5,029,220
$5.0M
Cap Rate 7%
$3,592,300
$3.6M
Cap Rate 9%
$2,794,011
$2.8M
Market Conditions
NOI Build-Up for 33,000 SF
Gross rent
$510.8K $15.48/SF
− Vacancy
−$53.6K −$1.63/SF
EGI
$457.2K $13.85/SF
− OpEx
−$205.7K −$6.23/SF
NOI
$251.5K $7.62/SF
Area
Volusia County, FL
Vacancy
10.50%
Lease Rate
$15.48 /SF/Yr
Expense Ratio
45.00%
Simulate Cap Rate and NOI
Suggested Prices Based on Cap Rates
Cap Rate 5%
$5,029,220
Cap Rate 7%
$3,592,300
Cap Rate 9%
$2,794,011
Alternative Uses
Best Use
Apartment 5plus
$3.59M
$3.14M – $4.19M
NOI $251,461 @ 7.0% cap · market cap 4.19%
Second Best
—
—
no second resolved use
Theoretical Best
Office A
$9.73M
$8.51M – $11.35M
NOI $681,120 @ 7.0% cap · market cap 11.35%
Zoning and permitted uses should be independently verified with authorities.
Property Analytics
Unlock full access to Insights
Subscribe to Realmo Intelligence
Open Analytics
Current Use
Lease Details
Yes
Paved road access
Location Intelligence
Trade Area within ½ mile
529
Businesses Nearby
Explore this area
Business Placement
Demographics for 32119, FL
22,498
Population
12,629
Households
1.8
Avg Household Size
50
Median Age
27%
College-Educated
91%
High-School Grad
7.8 sq mi
ZIP Area
2,884
Density / Sq Mi
$53,795
Median Household Income
$37,675
Median Earnings
$1,371
Median Rent
$215,200
Median Home Value
Check the figures for this property
Cap Rate, Value Estimation, Potential NOI and more
View Realmo Analytics
Market
Vacancy Rate% for Multifamily in South region

Questions? Ask Rey
Realmo’s AI knows this listing — price, zoning, demand, history. Ask anything.




Frequently Asked Questions
What type of property is this?
Apartment building - Garden-style residences offer one- and two-bedroom layouts with assigned parking.
Where is this apartment building located?
The property is located at 1890 S Palmetto Avenue South Daytona, FL.
What is the asking price?
The asking price for this property is $6,000,000.
What are key features of this property?
This property features: 33,000 square feet of multifamily property on 0.75 acres; 76 bedrooms and 40 bathrooms across the portfolio; Garden‑style apartment configuration with one- and two‑bedroom layouts



