Multi-Tenant Industrial
For Sale
$6,937,000
Pending
1356 BENNETT Drive, Longwood, FL 32750
Commercial Sale, LONGWOOD, FL
Property Size46,560 SF
Lot Size2.38 Acres
Days on Market778
Property Features for 1356 BENNETT Drive
General Information
Property type
Commercial Sale
Property subtype
Other
Zoning
IND
Security features
Security Lighting
Lot features
Industrial Park, Near Public Transit, Paved
Directions
South Ronald Reagan Blvd and North Street, Left onto North Street, Right onto Bennett Drive, property will be on your right.
Subdivision
32750 - Longwood East
Standard status
Pending
APN
01-21-29-5CK-750E-0001
Size
46,560 SF
Lot size
2.38 Acres
Taxes and HOA fees
Tax Year
2023
Tax Description
LEG S 171.50 FT OF N 226.40 FT OF E 636 FT OF BLK E TRACT 75 SANLANDO SPRINGS PB 7 PG 2
Tax Annual Amount
39000
Legal Description
LEG S 171.50 FT OF N 226.40 FT OF E 636 FT OF BLK E TRACT 75 SANLANDO SPRINGS PB 7 PG 2
Utilities
Utilities
Phone Available
Sewer type
Public Sewer
Heating system
Central
Water source
Public
Building Details
Year built
1984
Flooring type
Concrete, Tile
Building materials
Metal Frame, Metal Siding
Roof type
Metal
Listing Agency:
CREEGAN GROUP
(407) 622-1111
Listed By:
Chris Creegan · License #3168853
(407) 509-2159
Added: Aug 27, 2024
Changed: Sep 28
Last Checked: Oct 13 at 7:06PM
MLS# O6236306
Copyright © 2026 Stellar MLS. All rights reserved. All information provided by the listing agent/broker is deemed reliable but is not guaranteed and should be independently verified.
Investment Insights
Based on property information with market context.
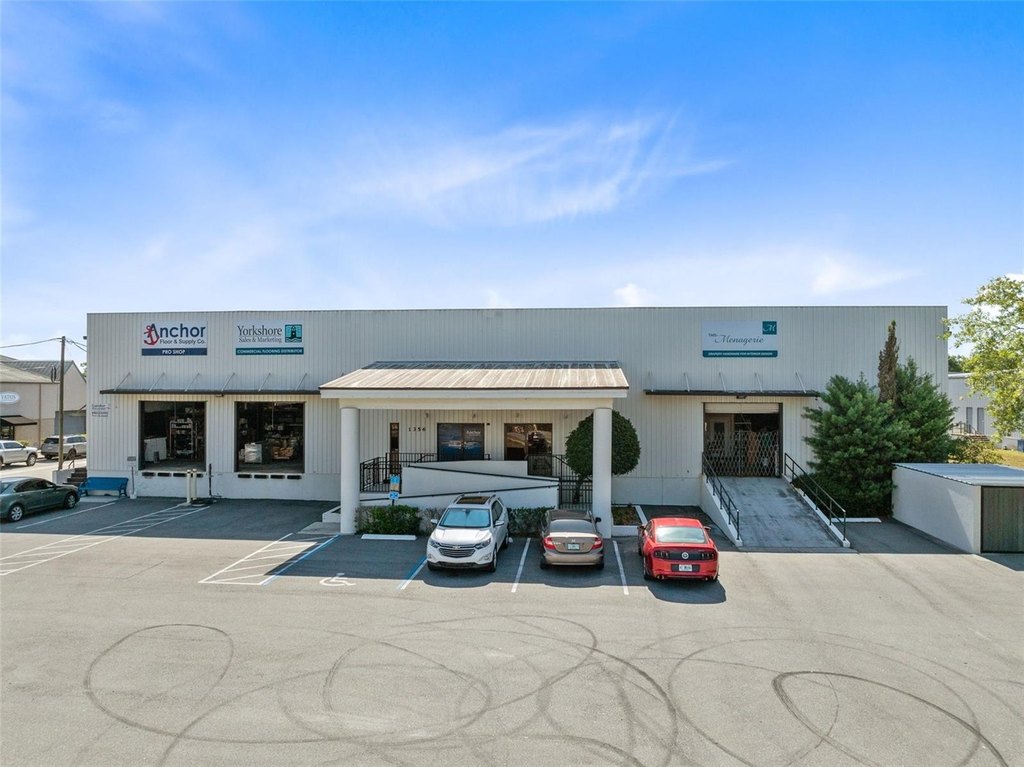
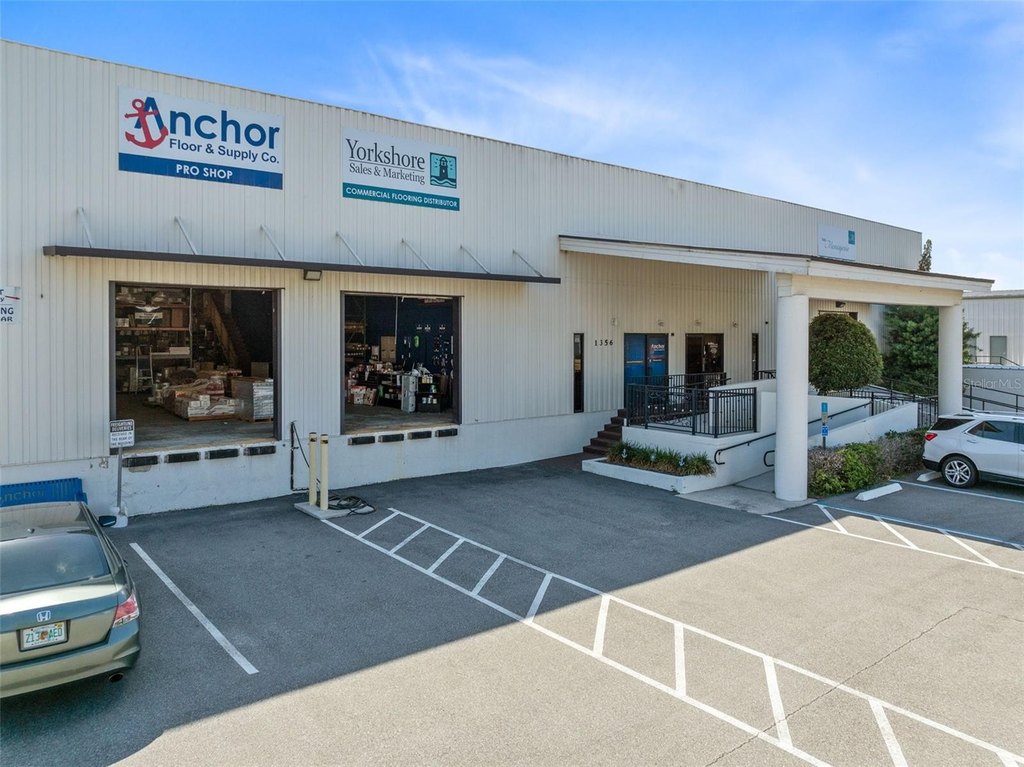
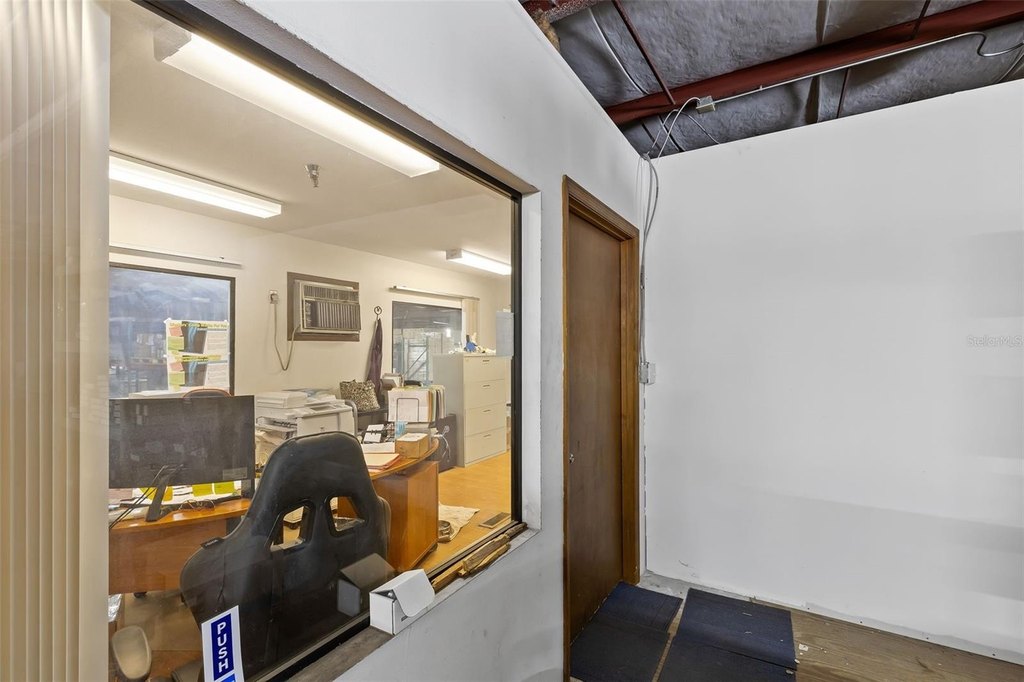
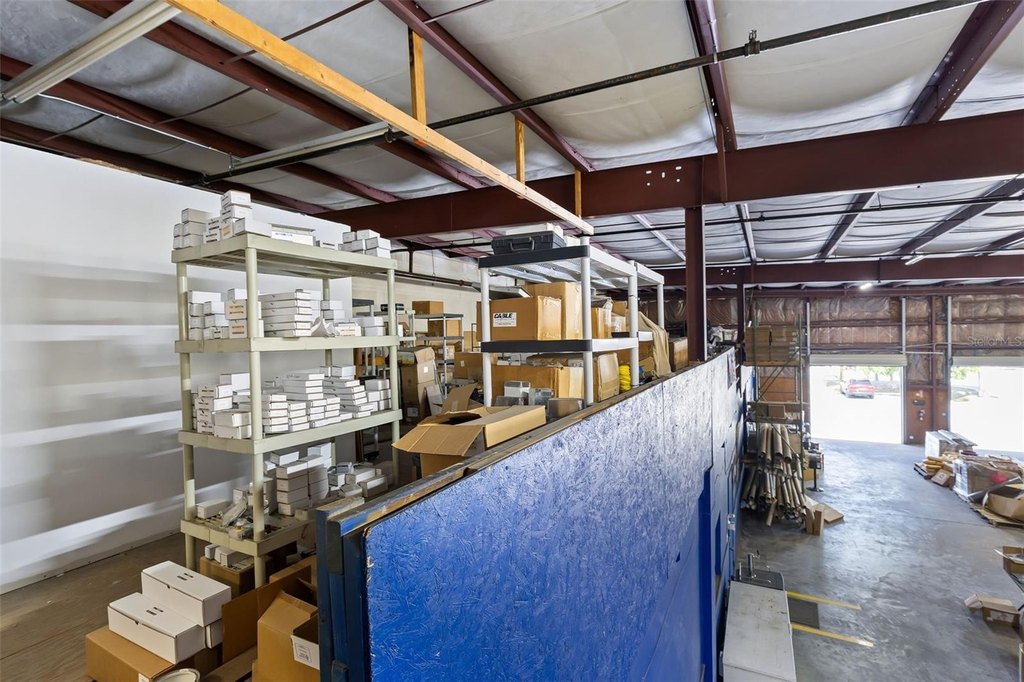
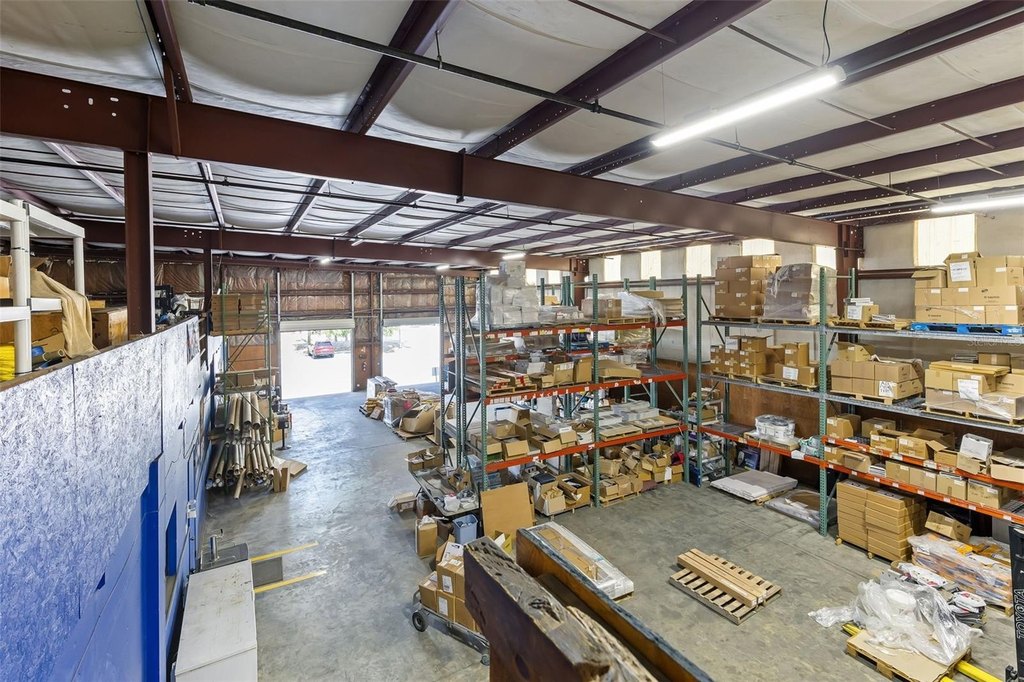
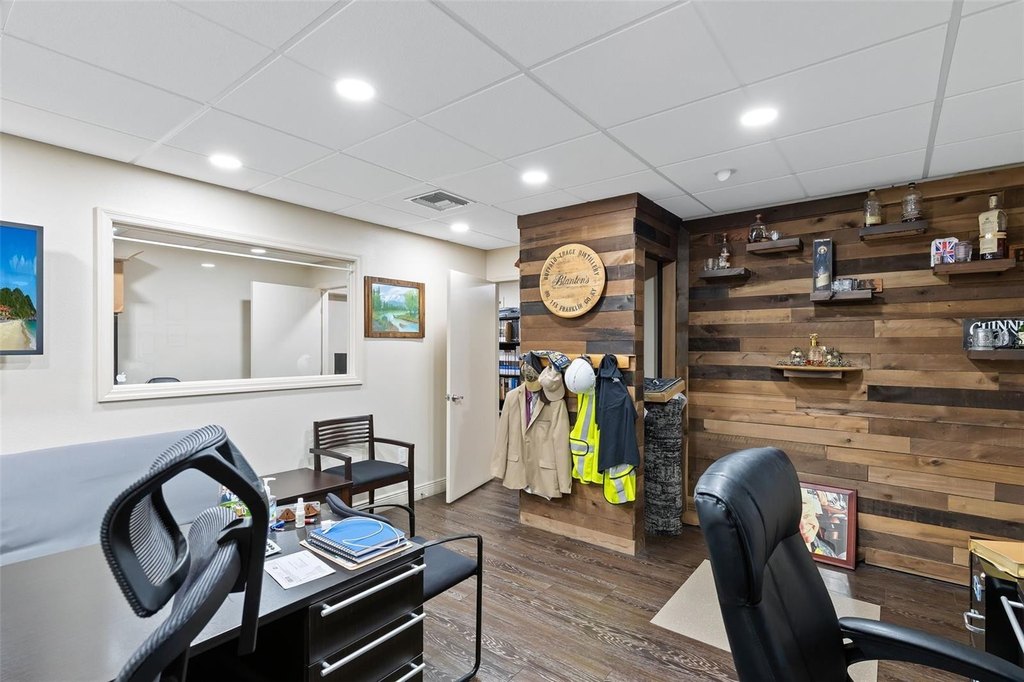
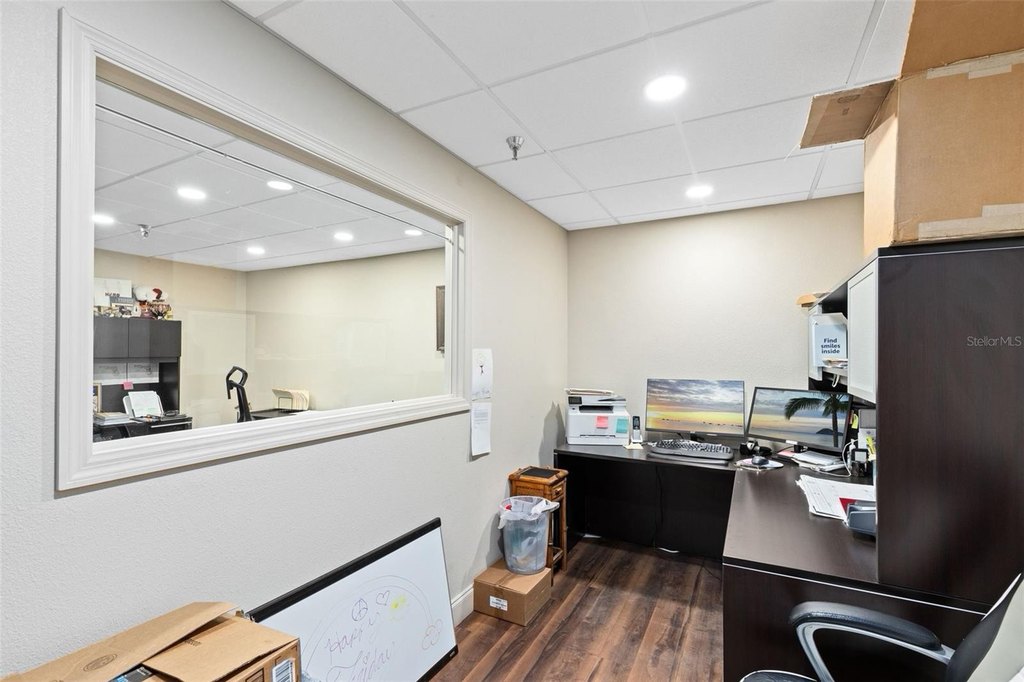
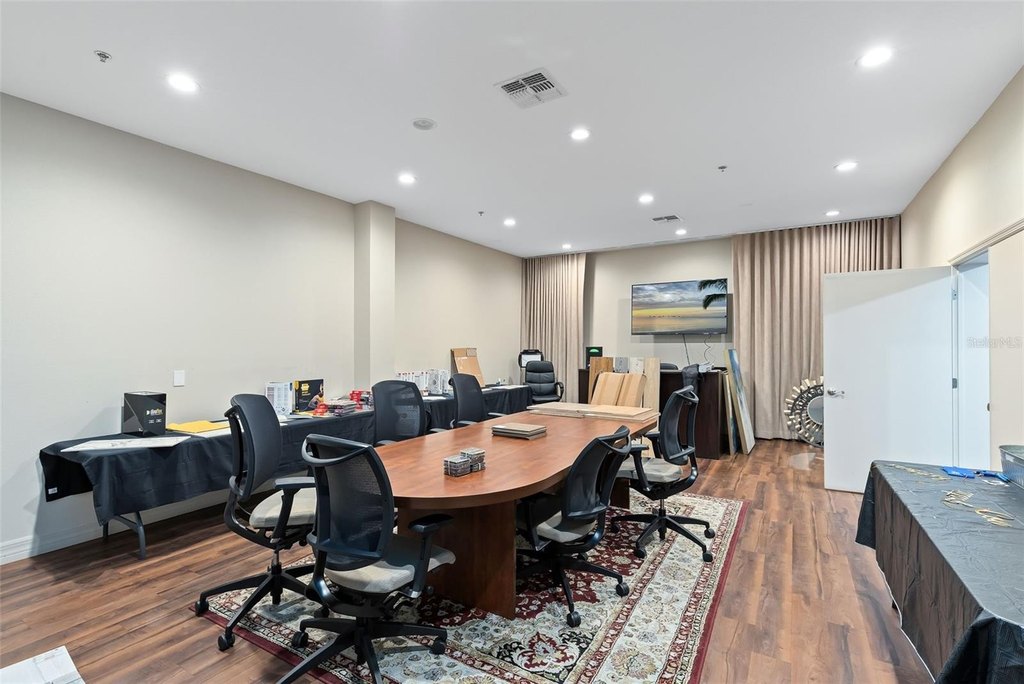
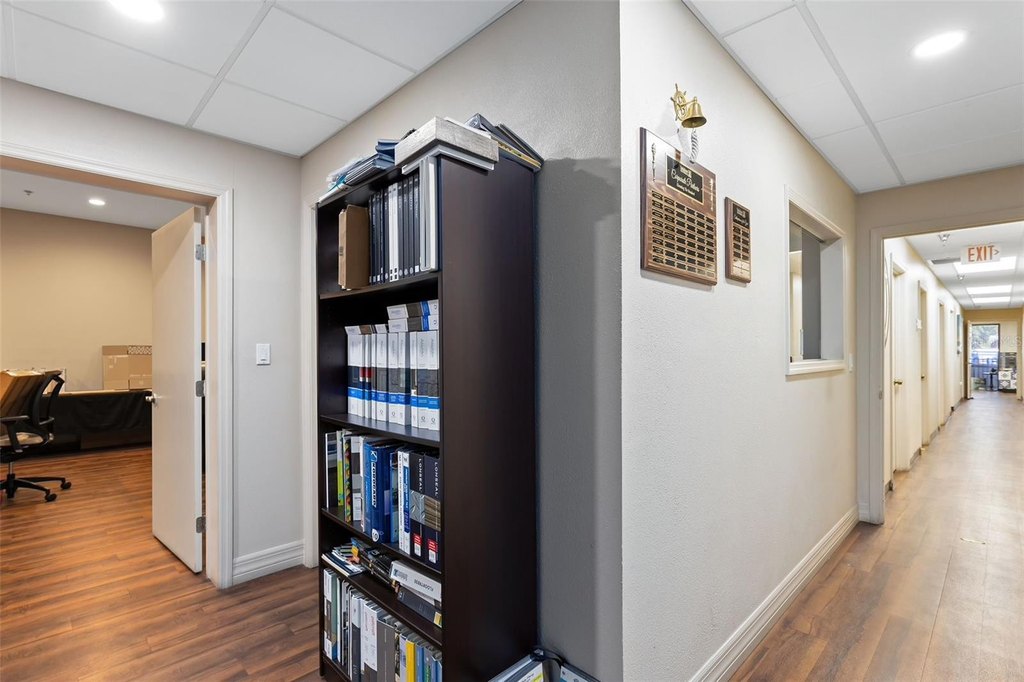
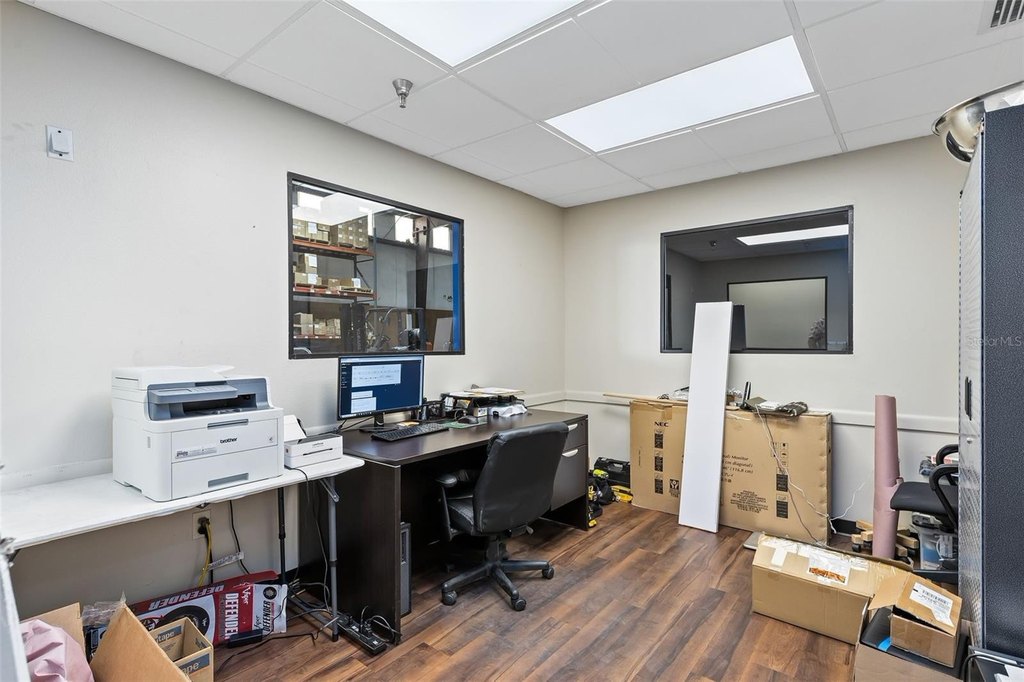
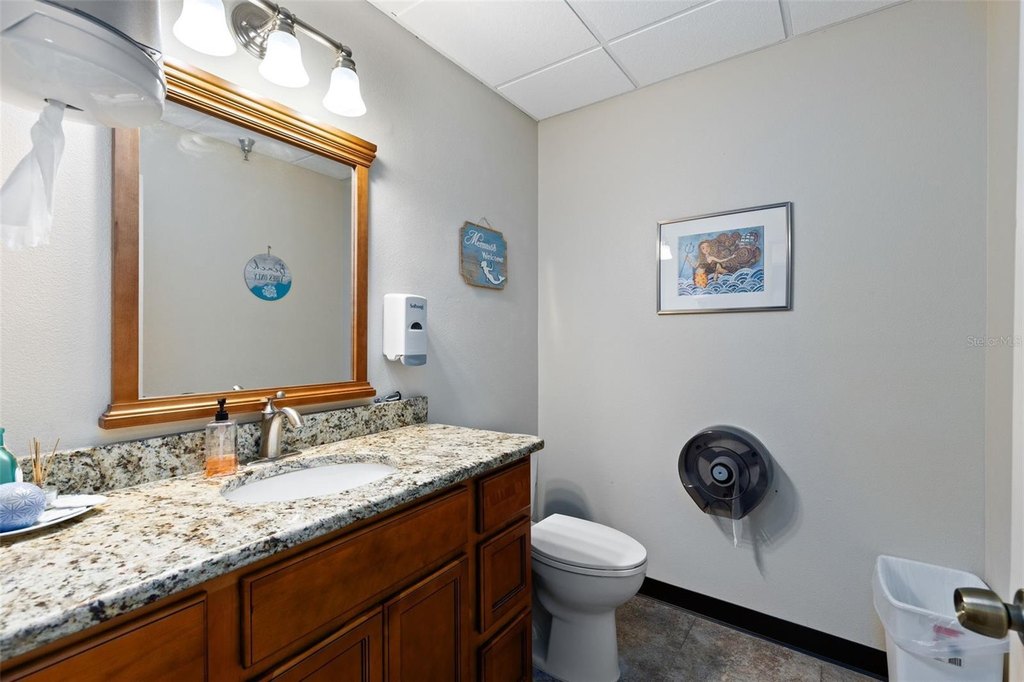
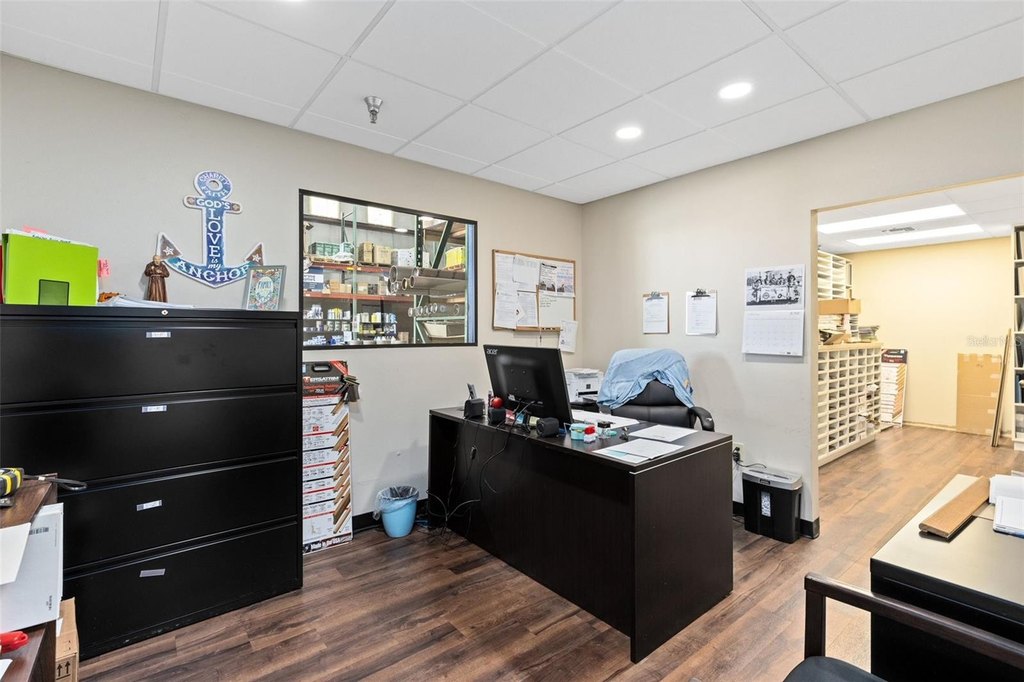
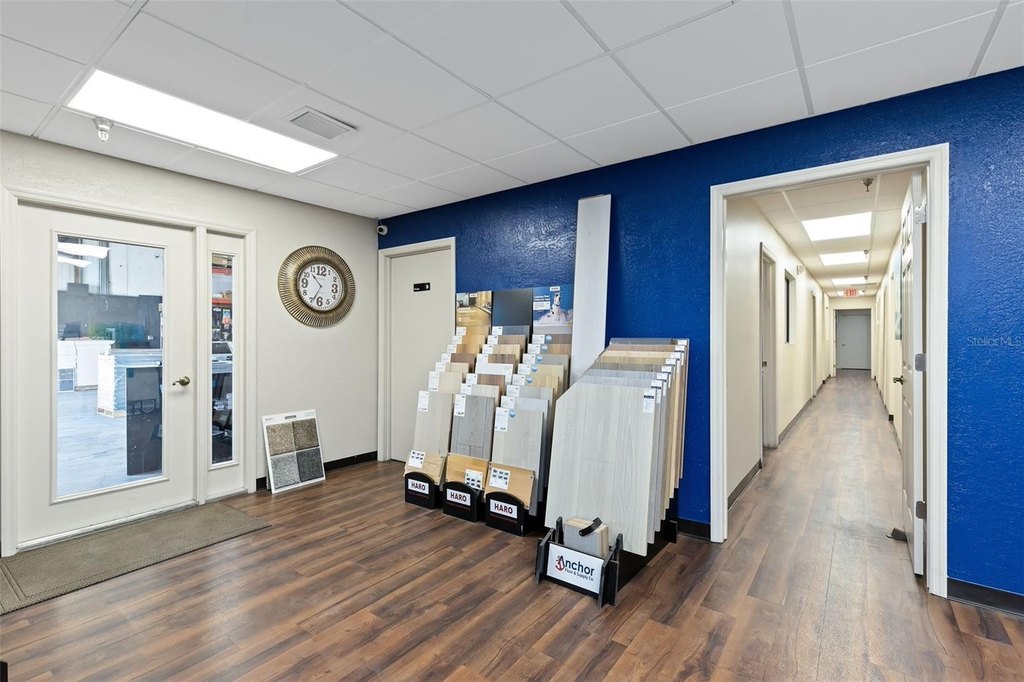
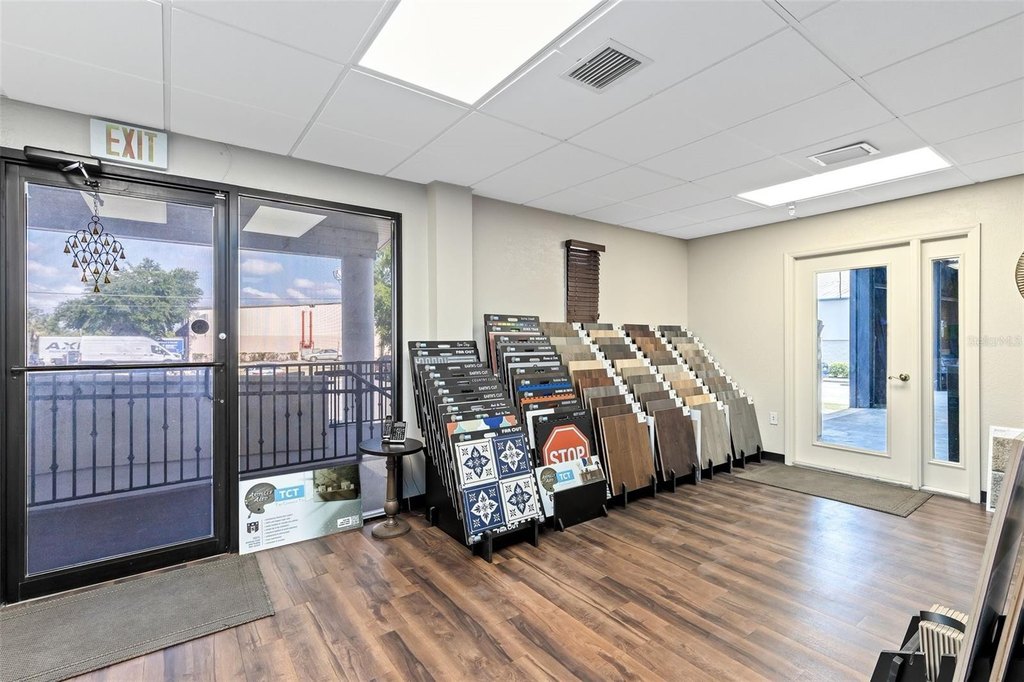
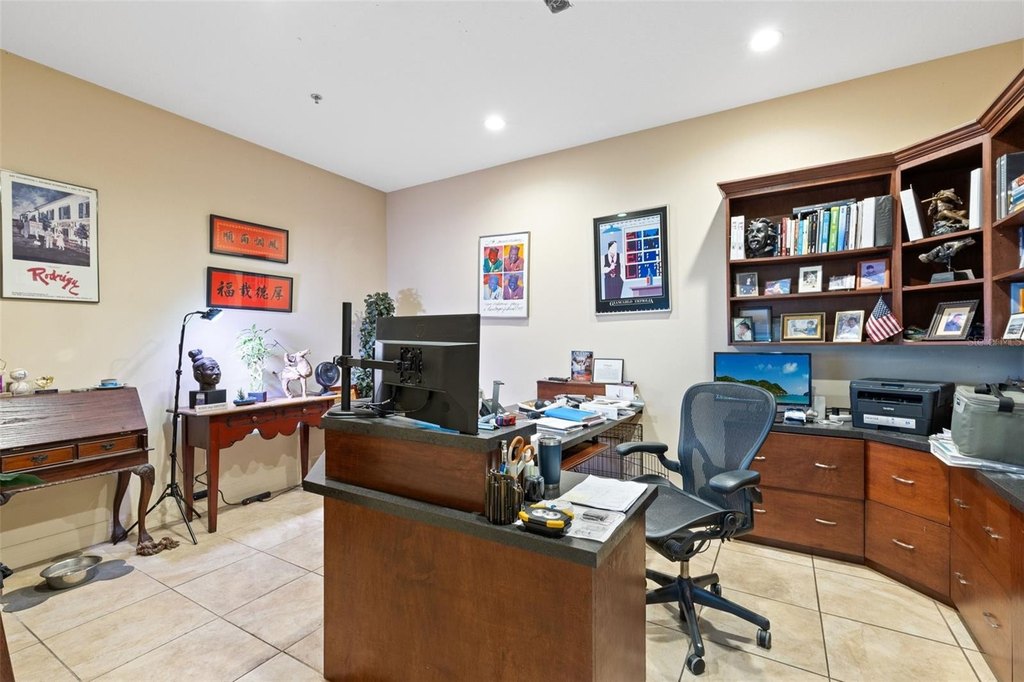
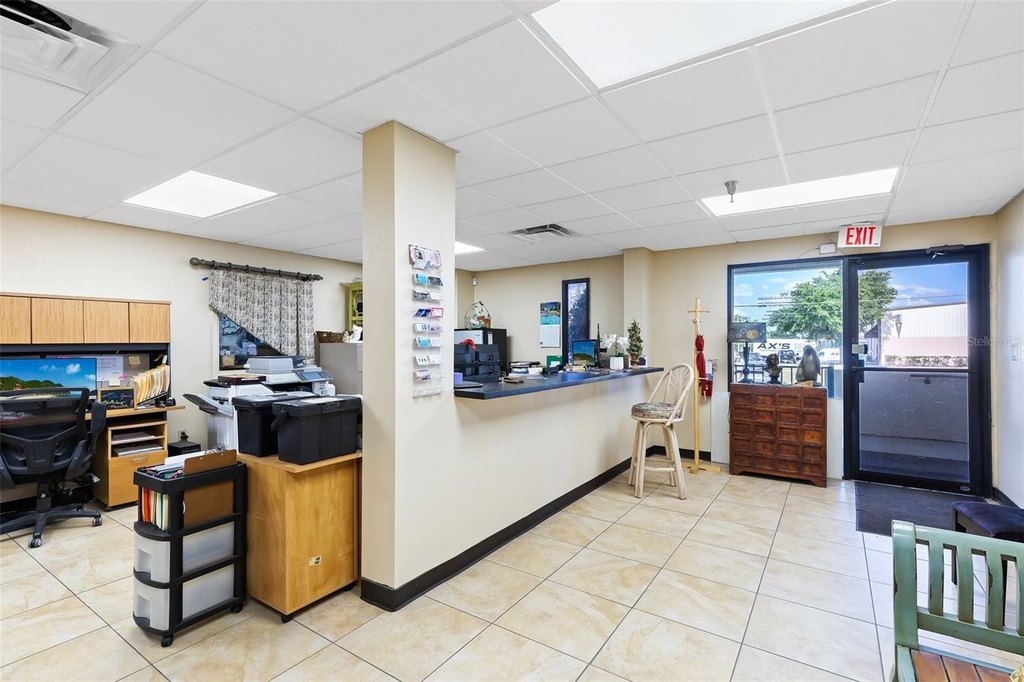
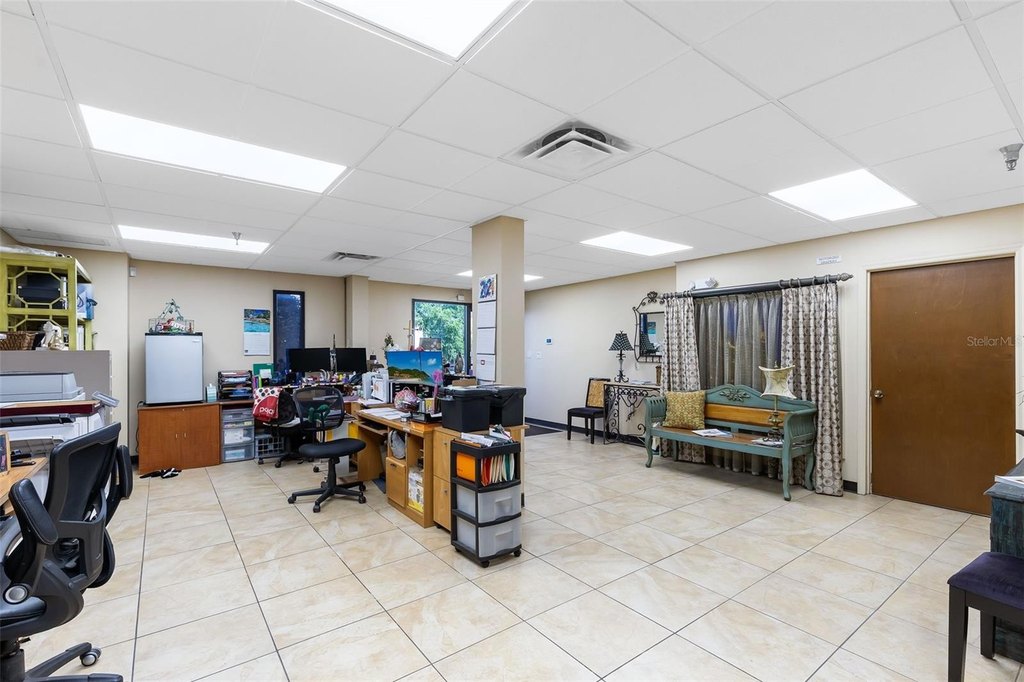
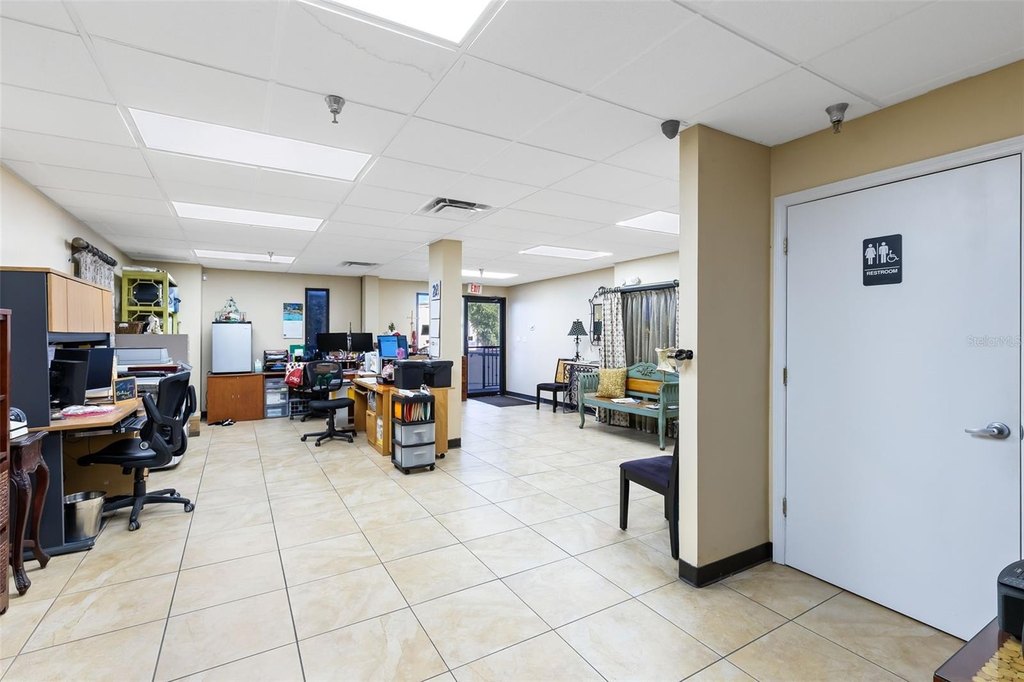
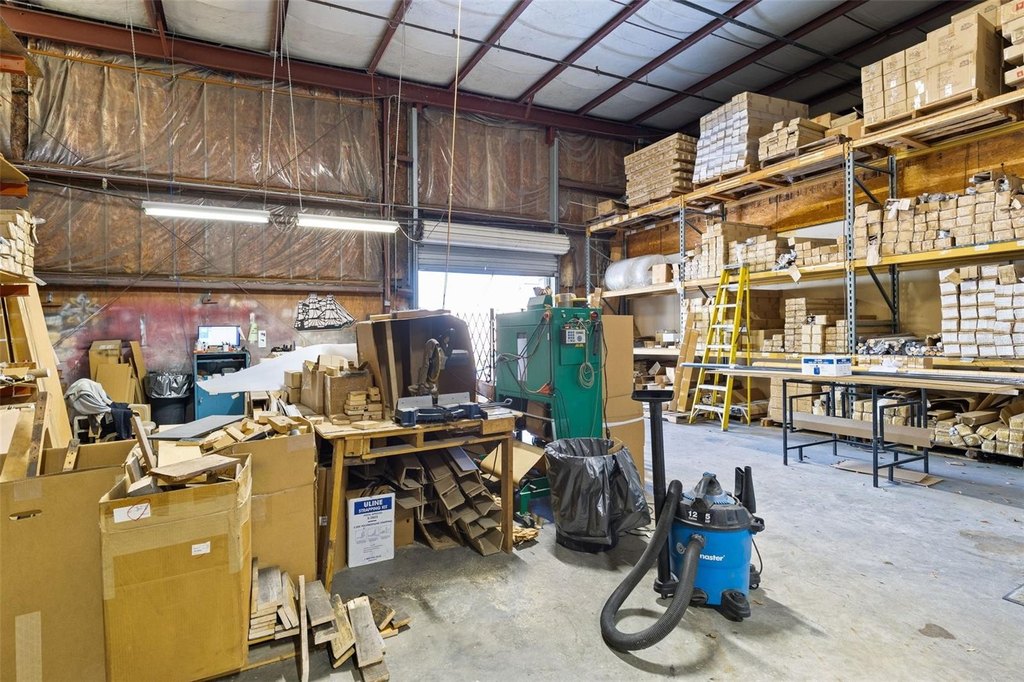
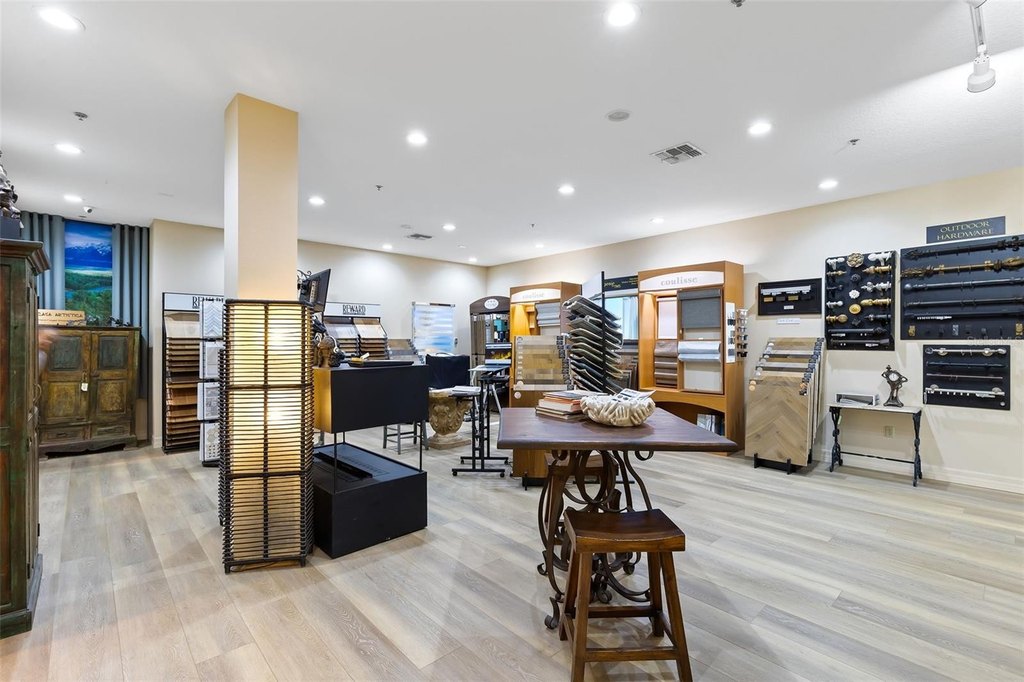
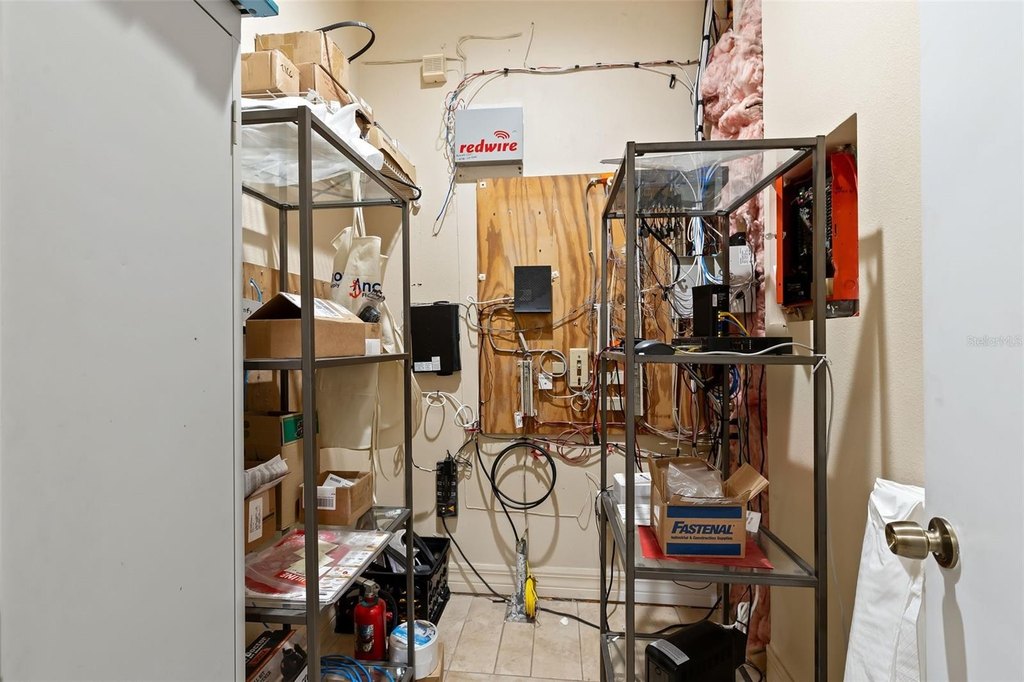
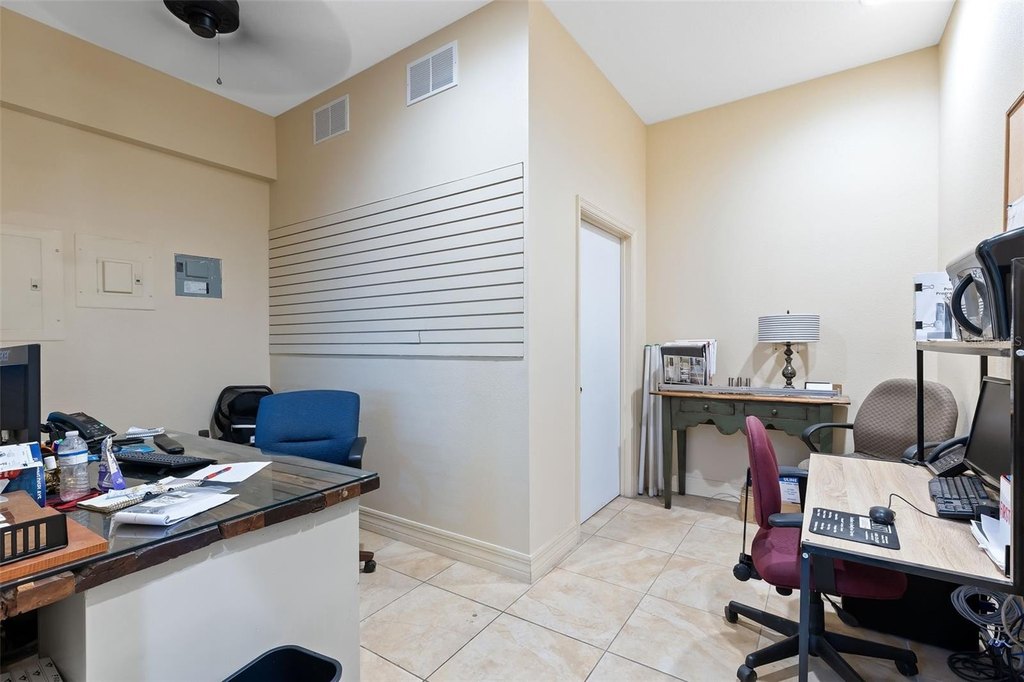
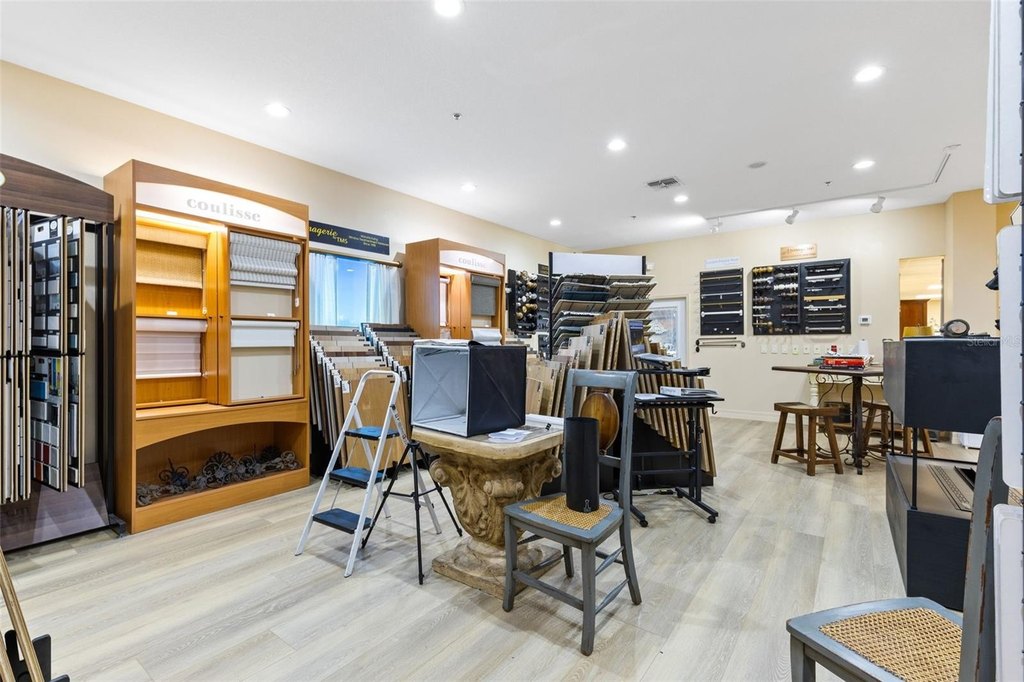
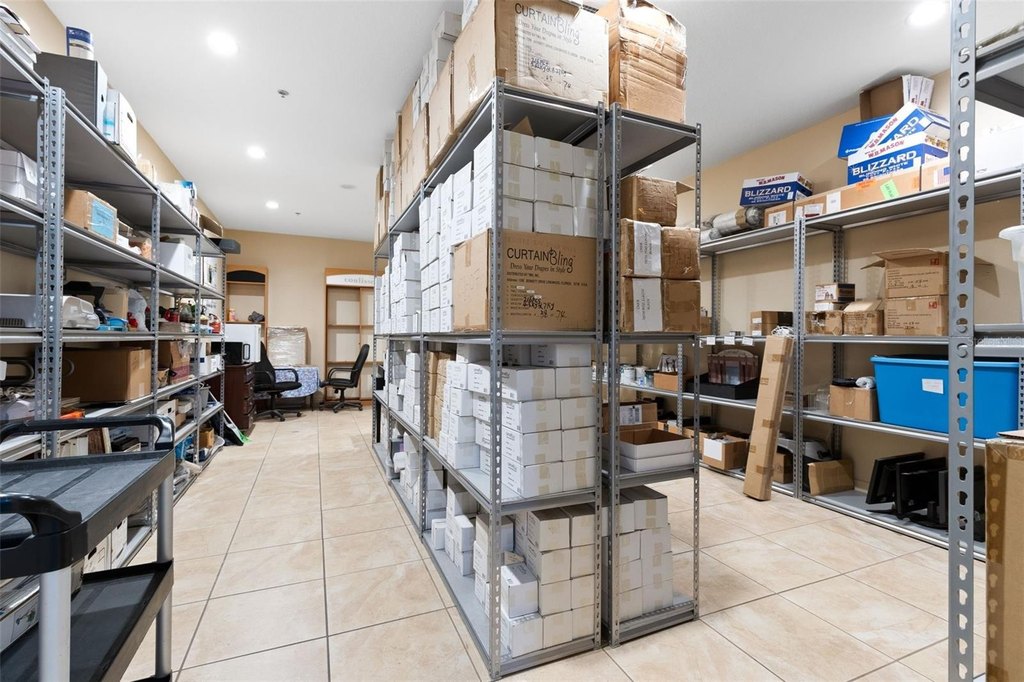
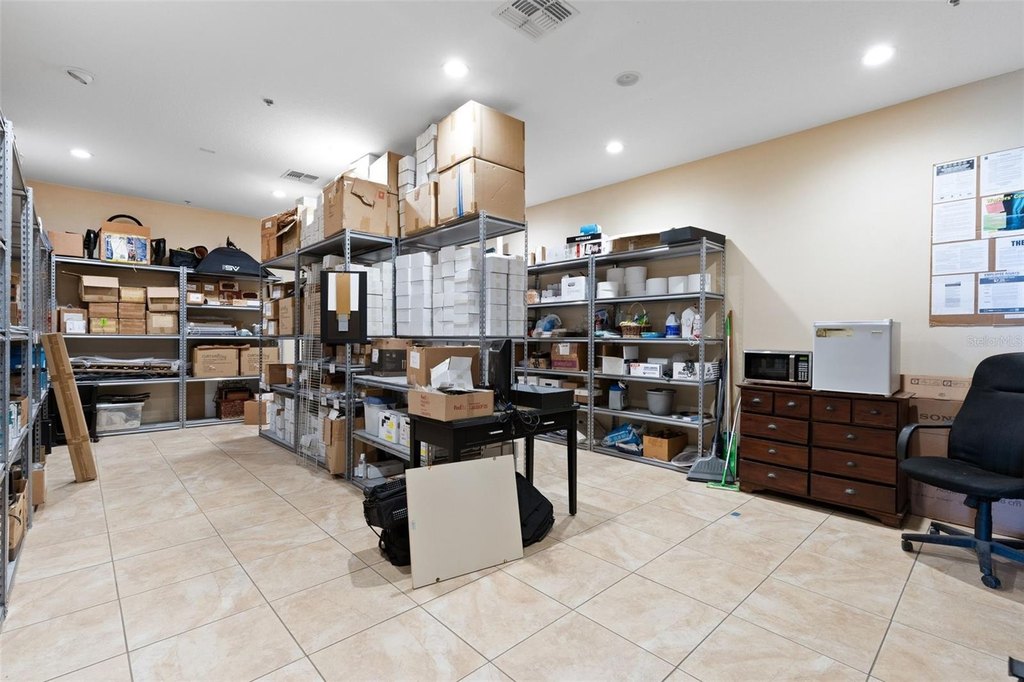
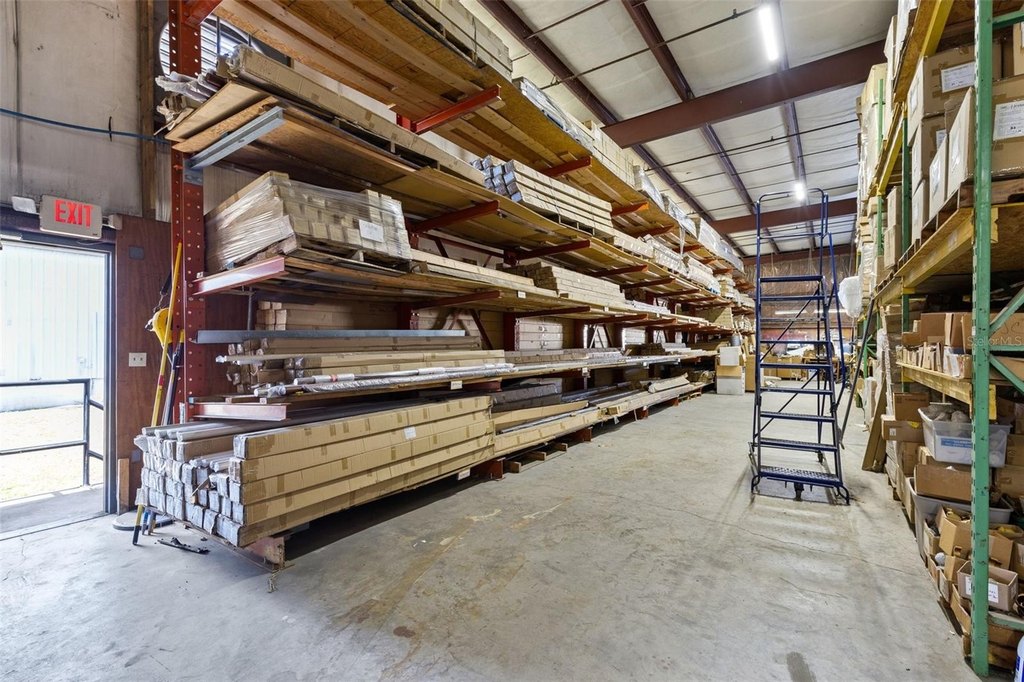
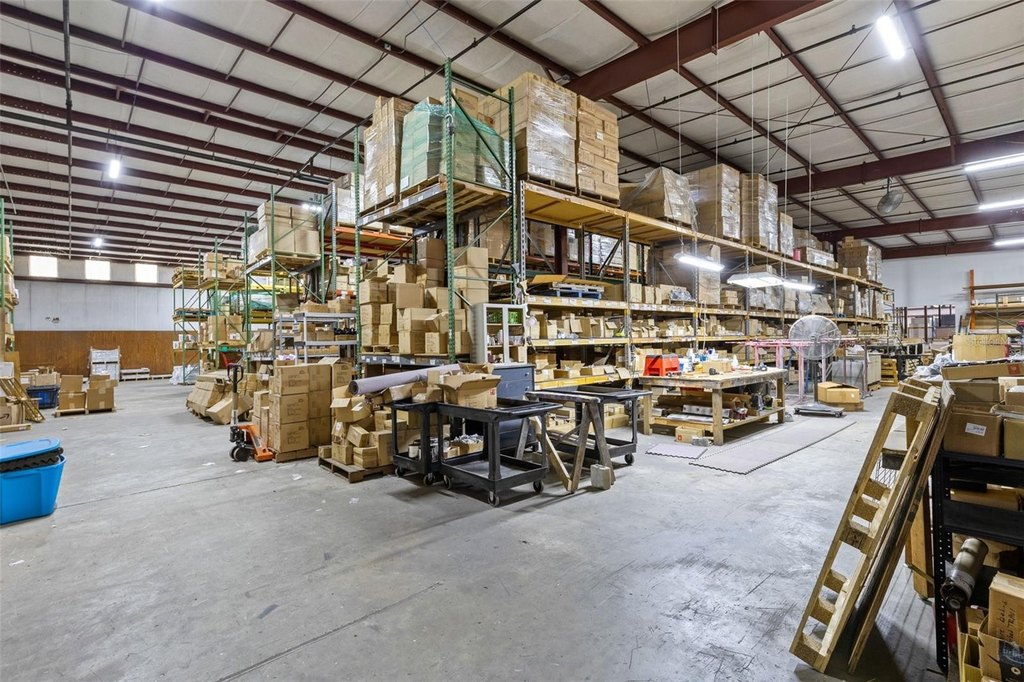
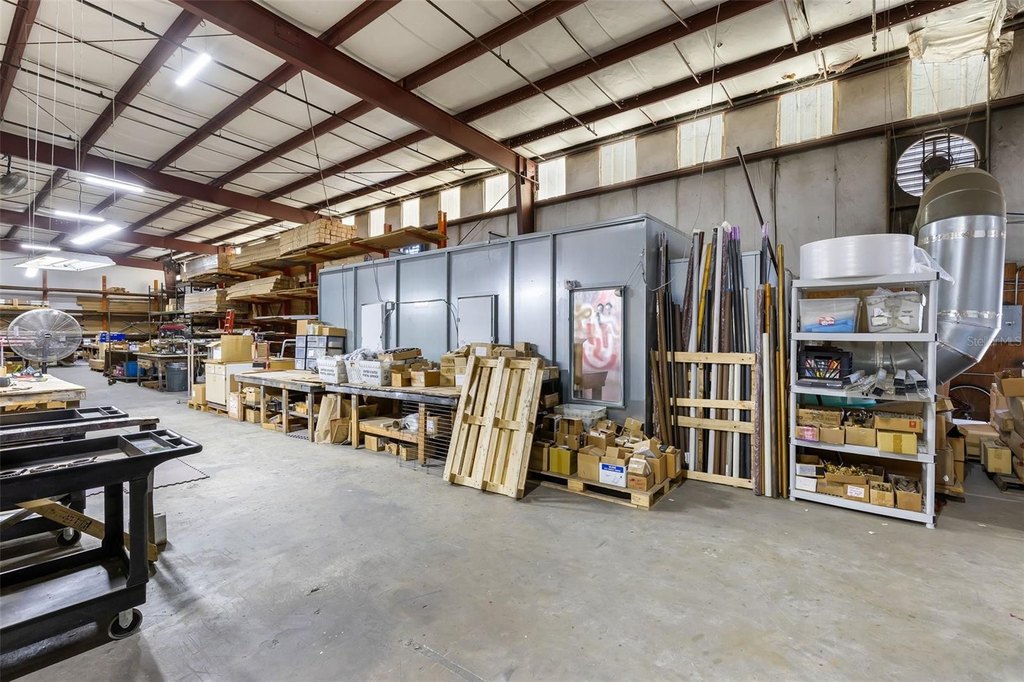
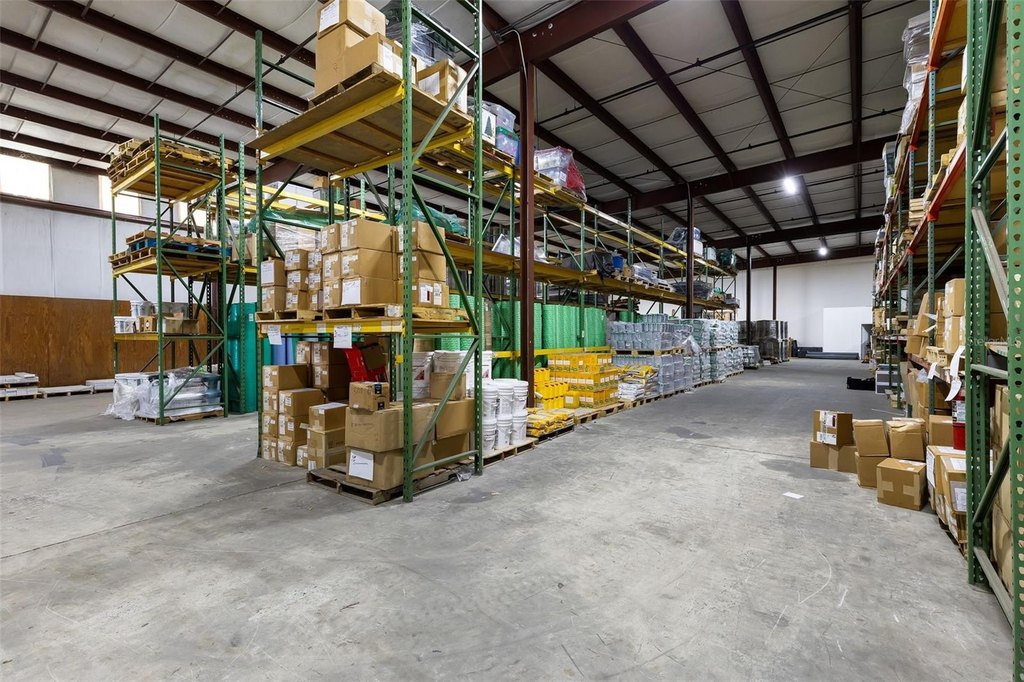
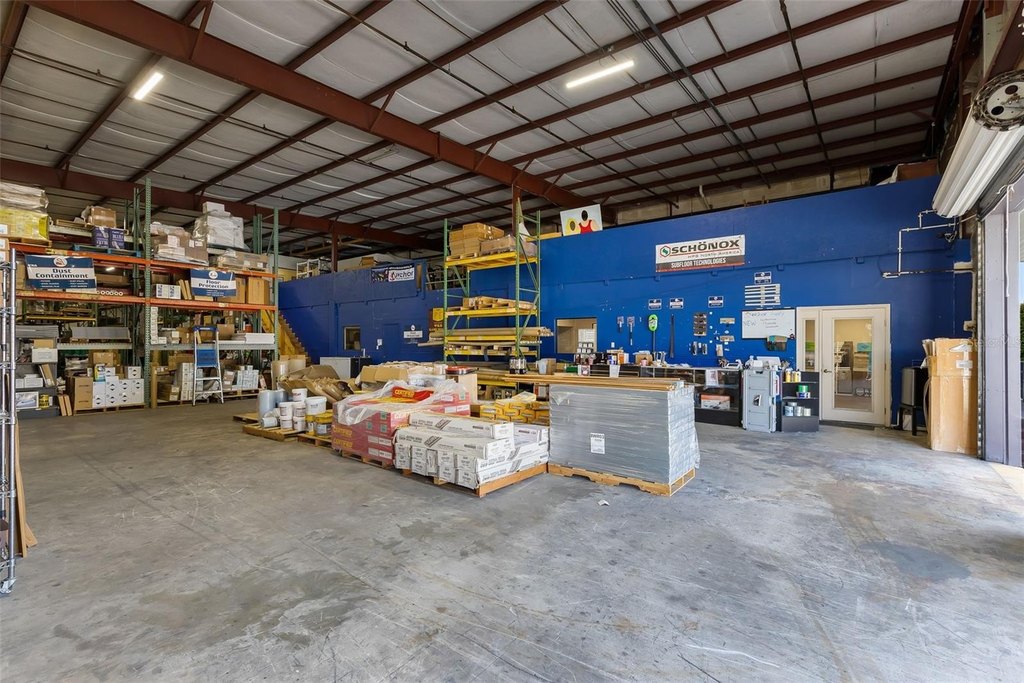
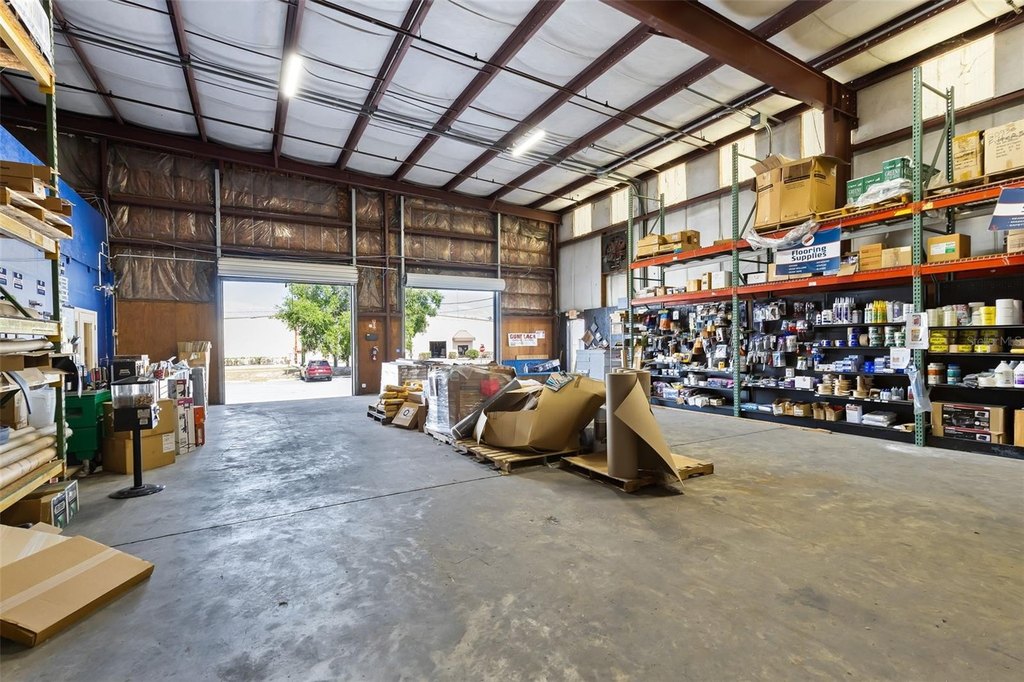
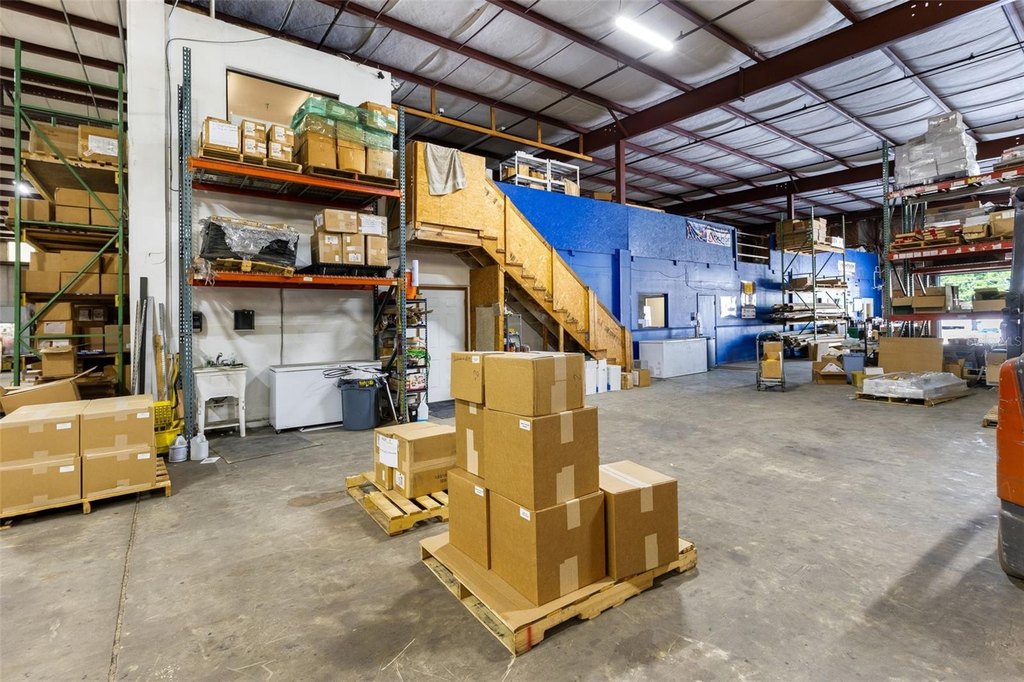
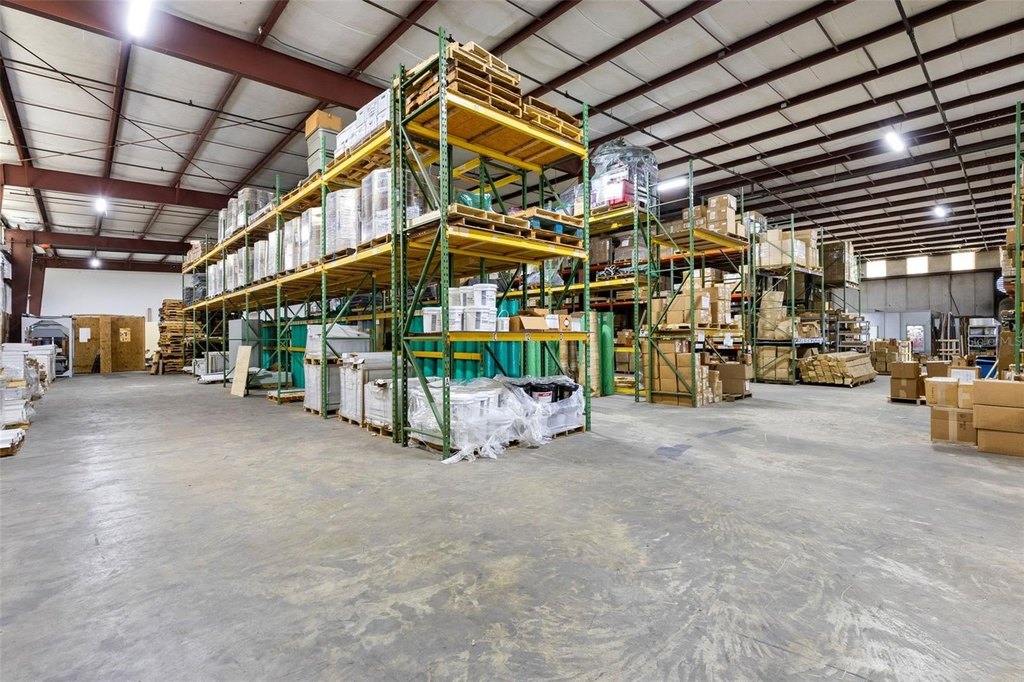
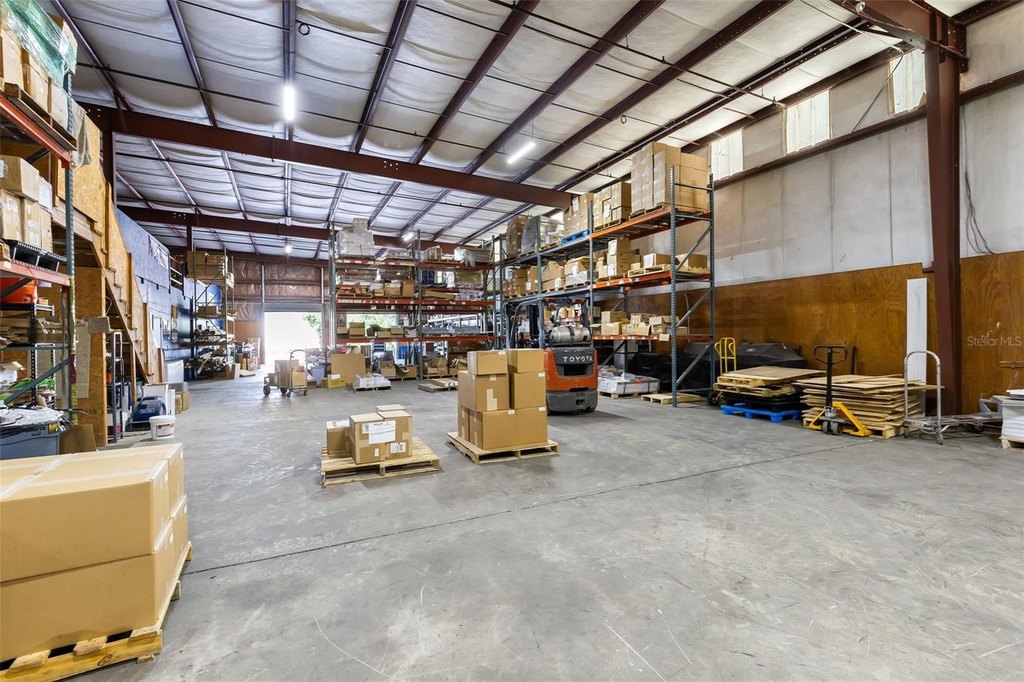
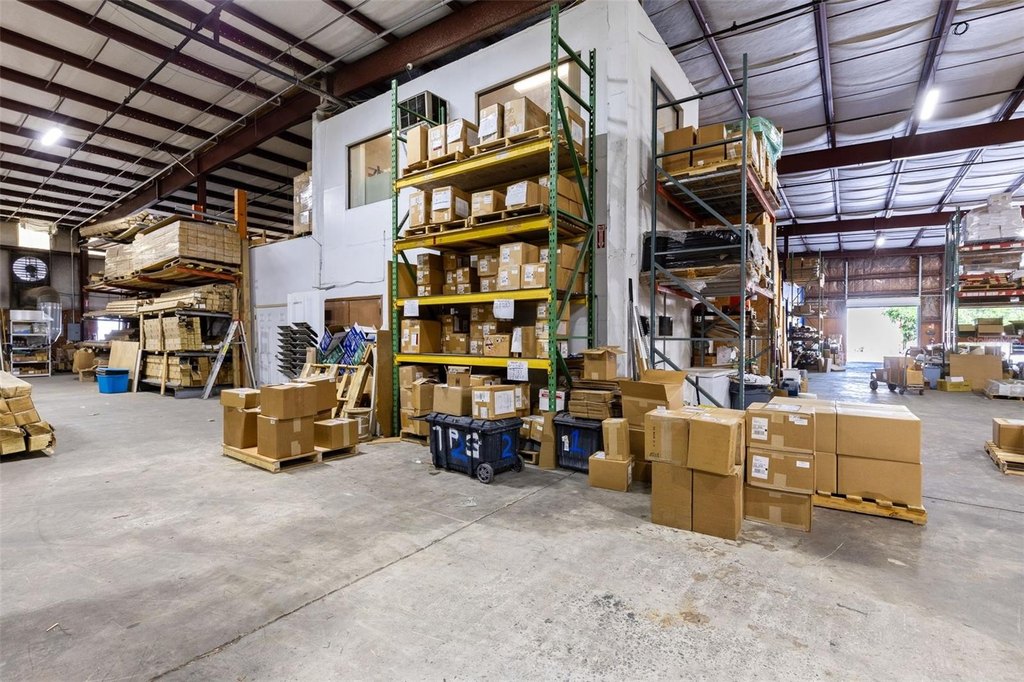
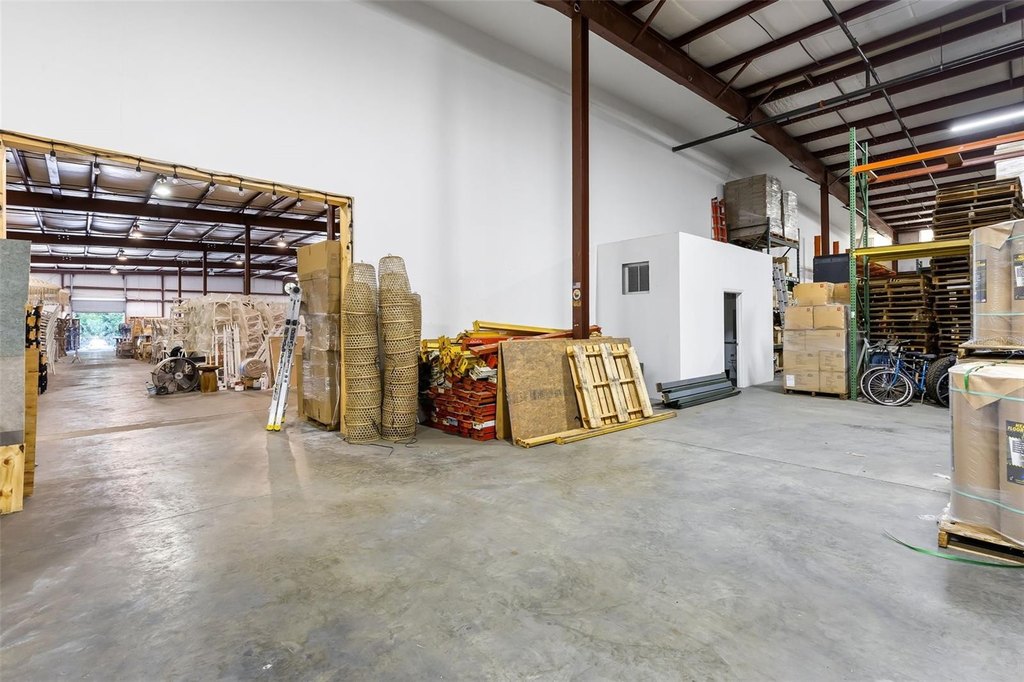
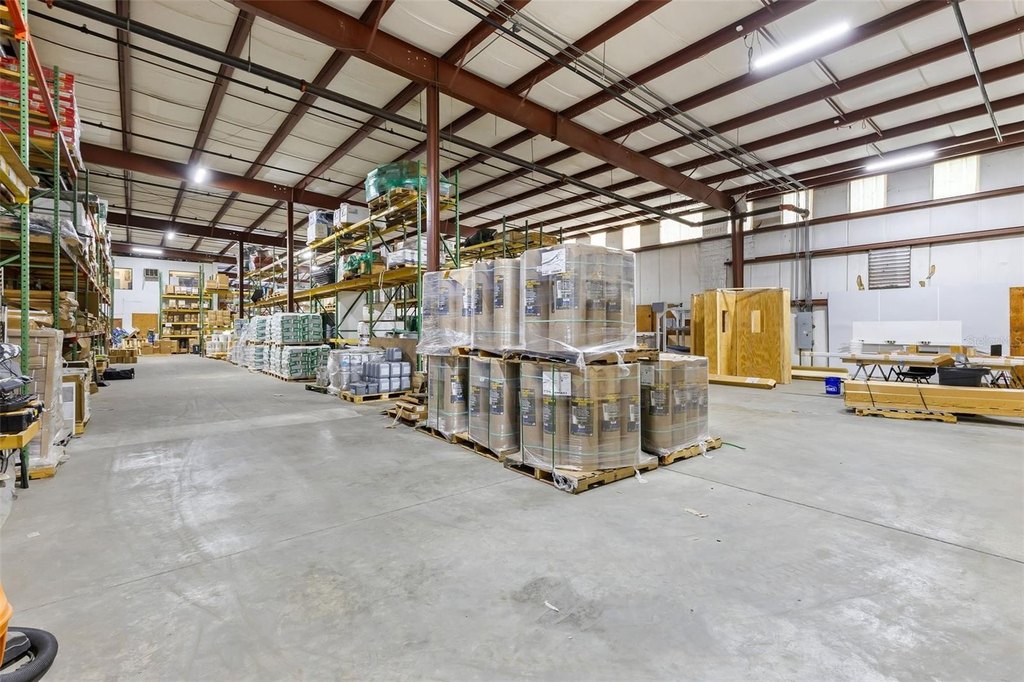
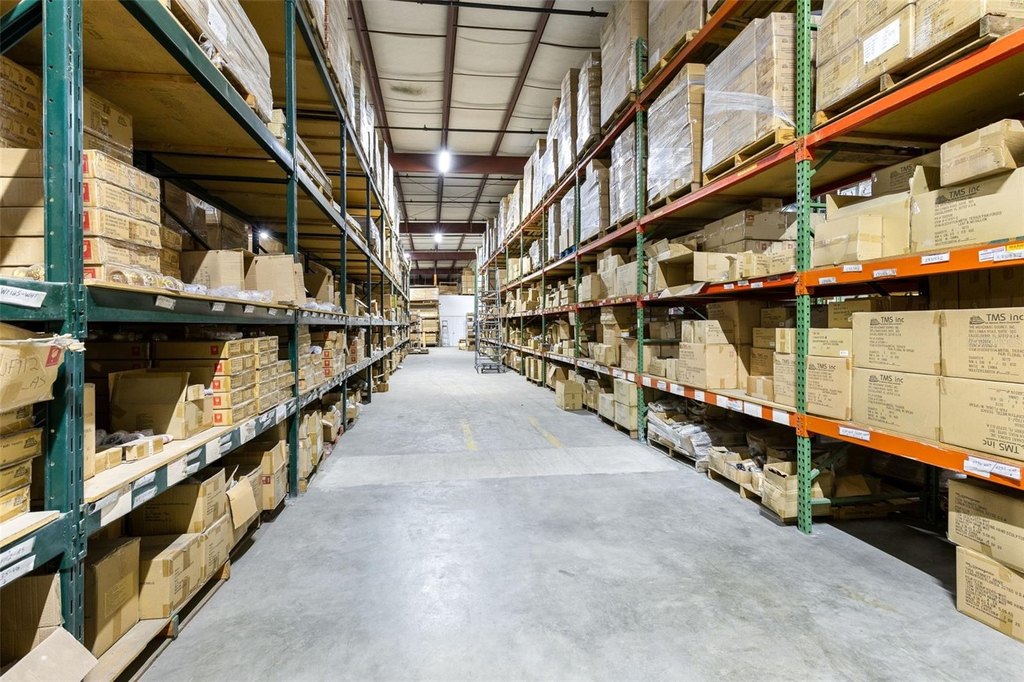
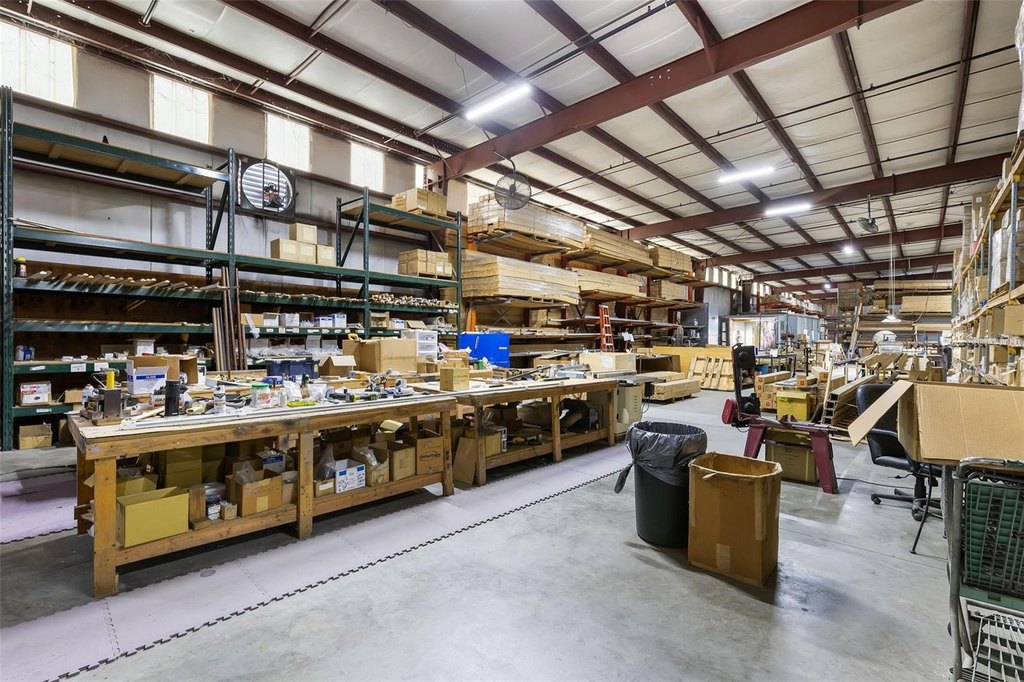
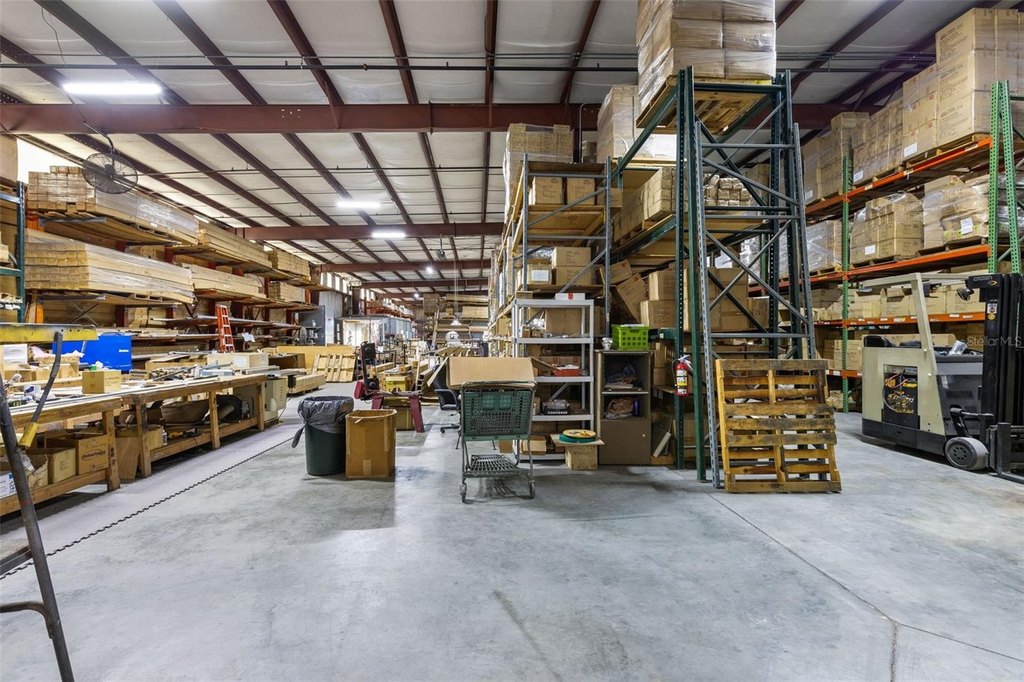
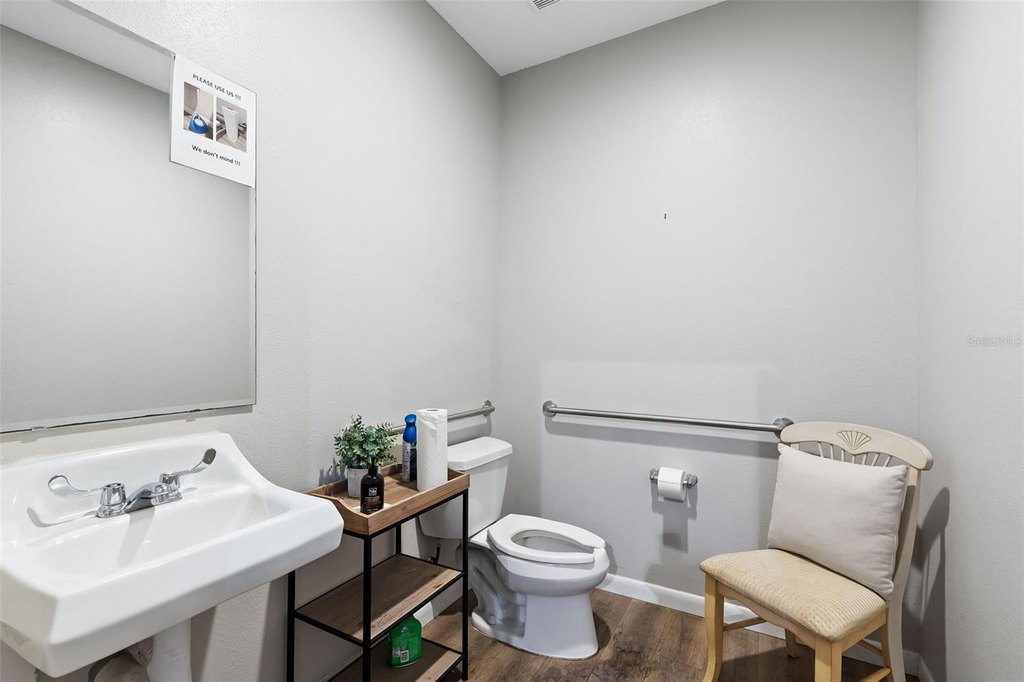
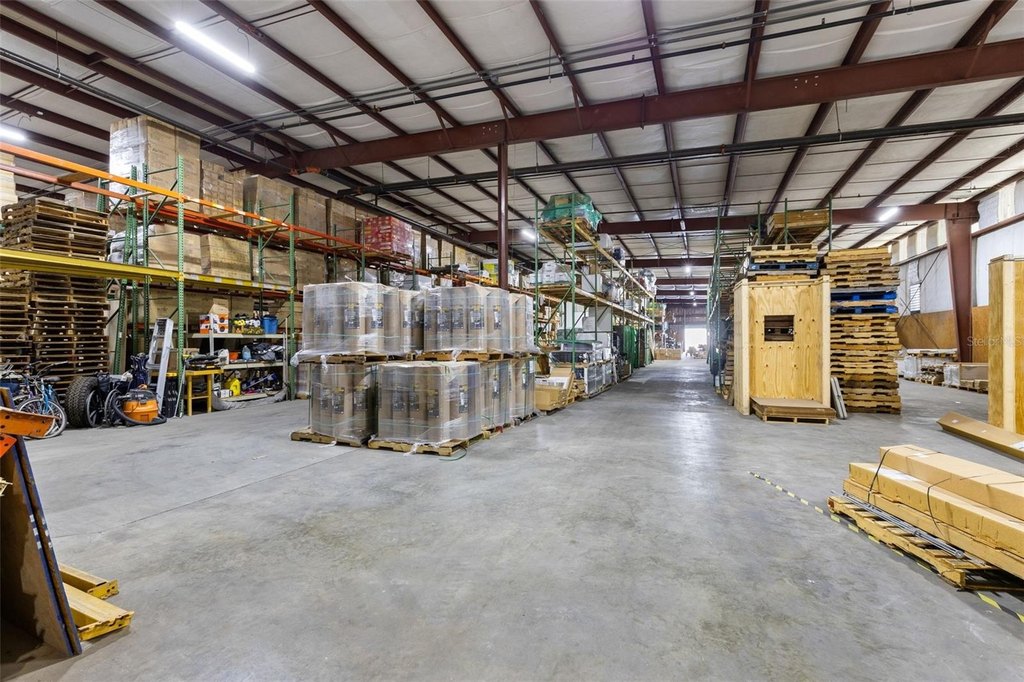
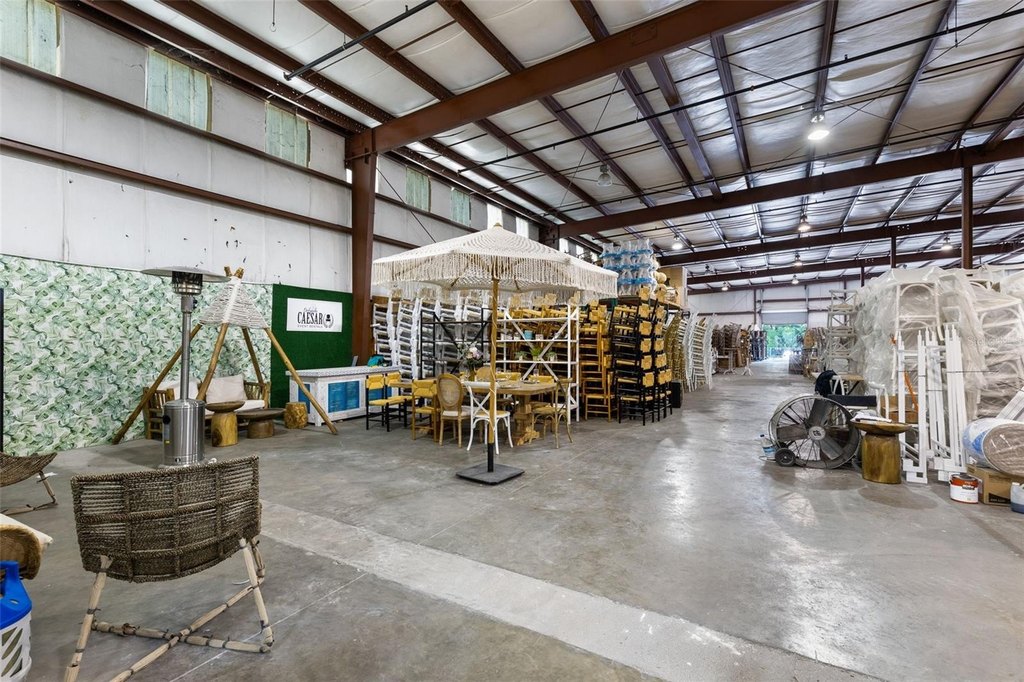
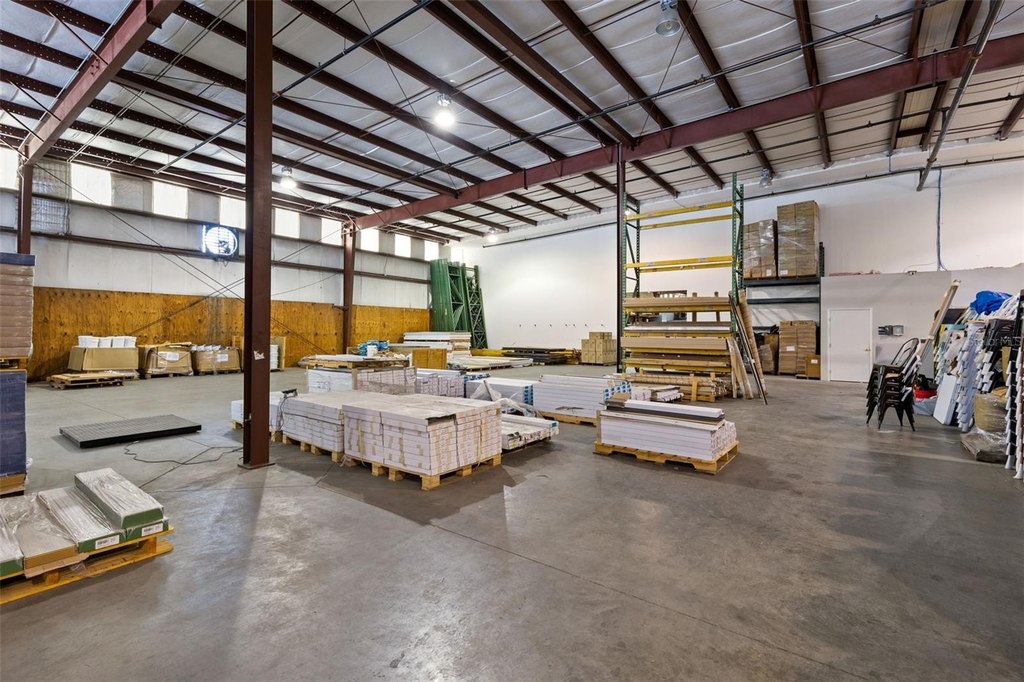
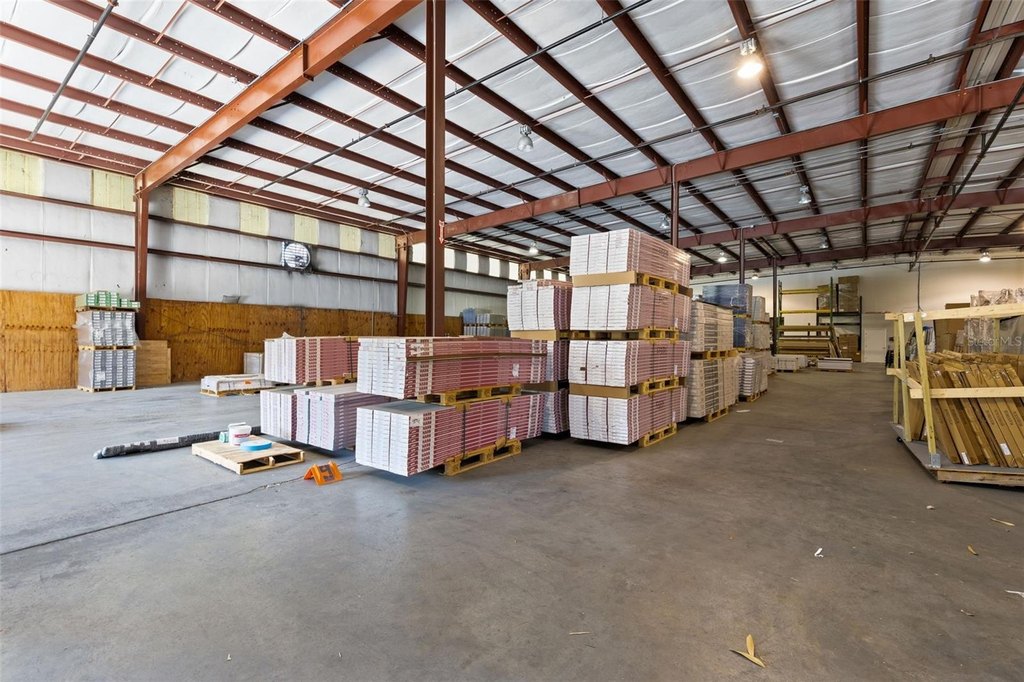
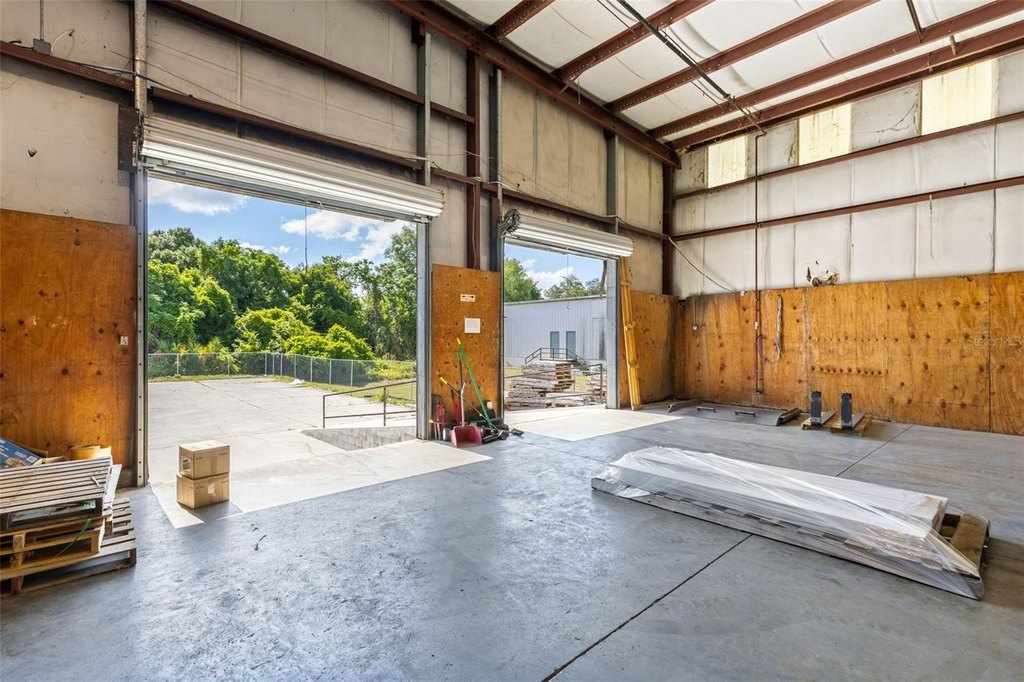
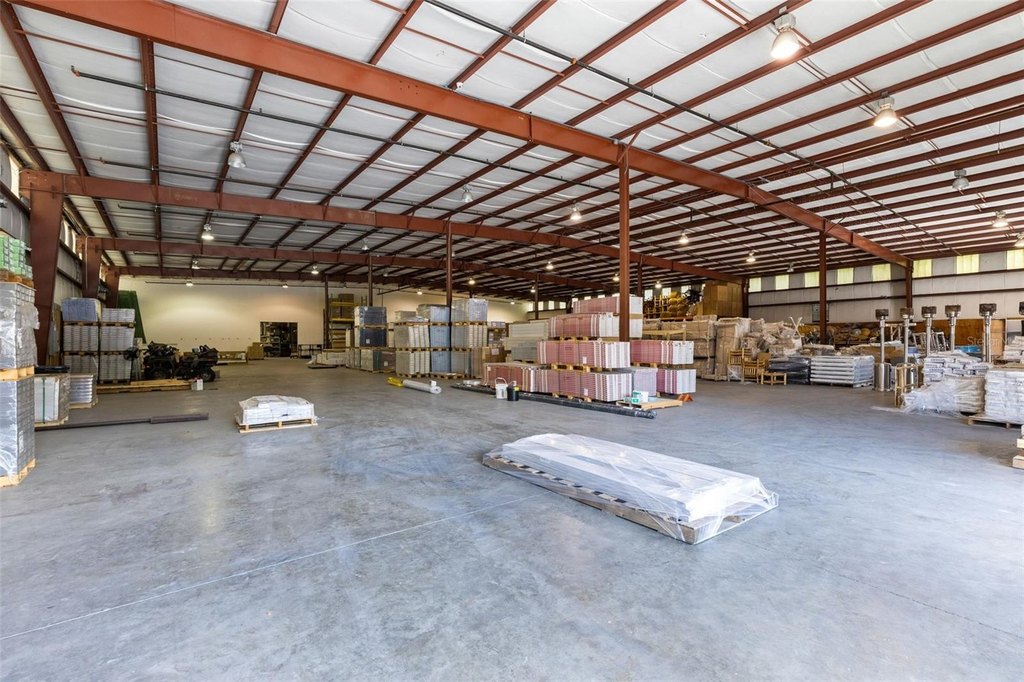
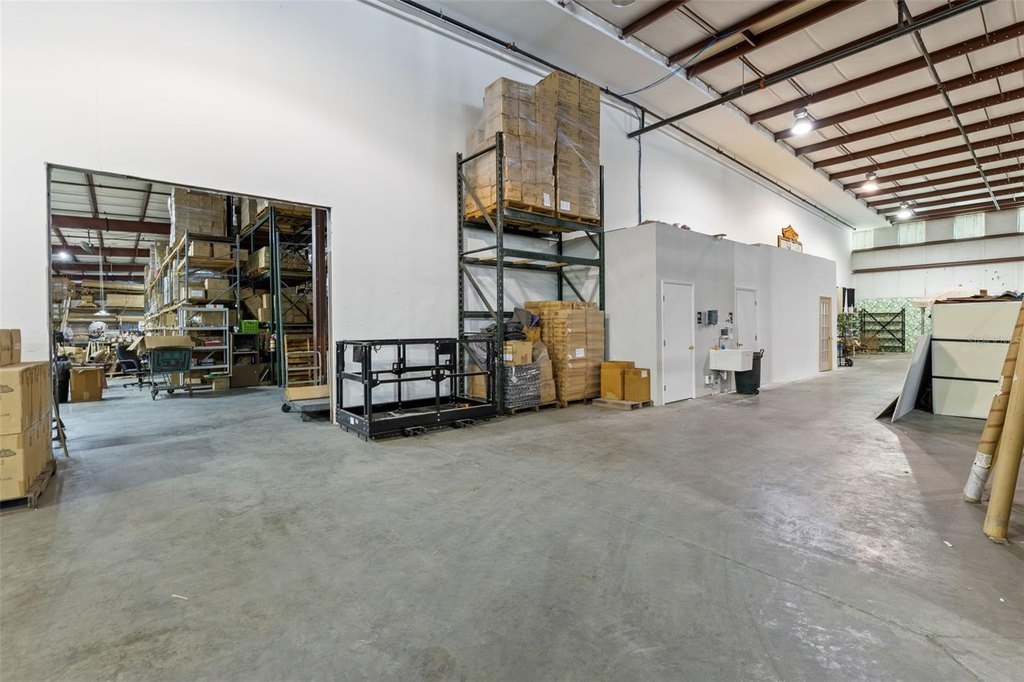
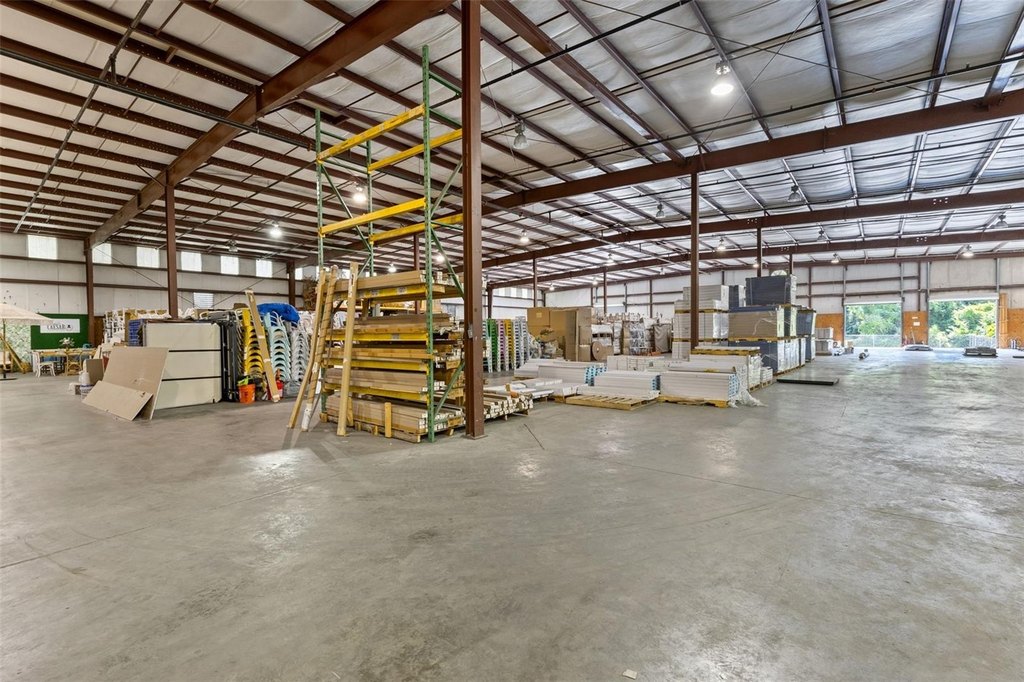
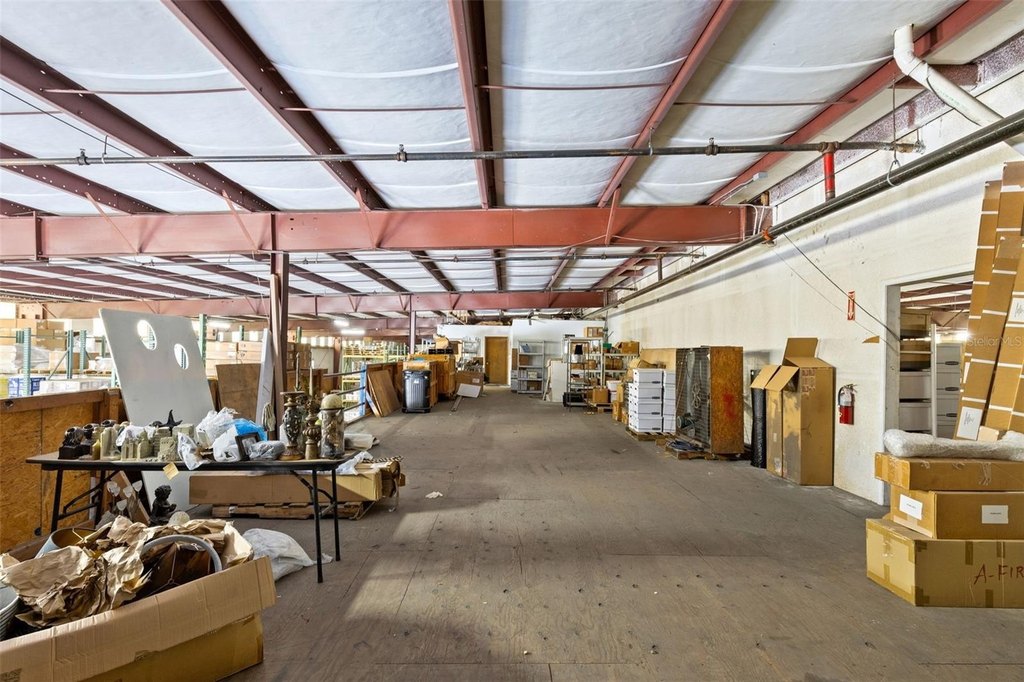
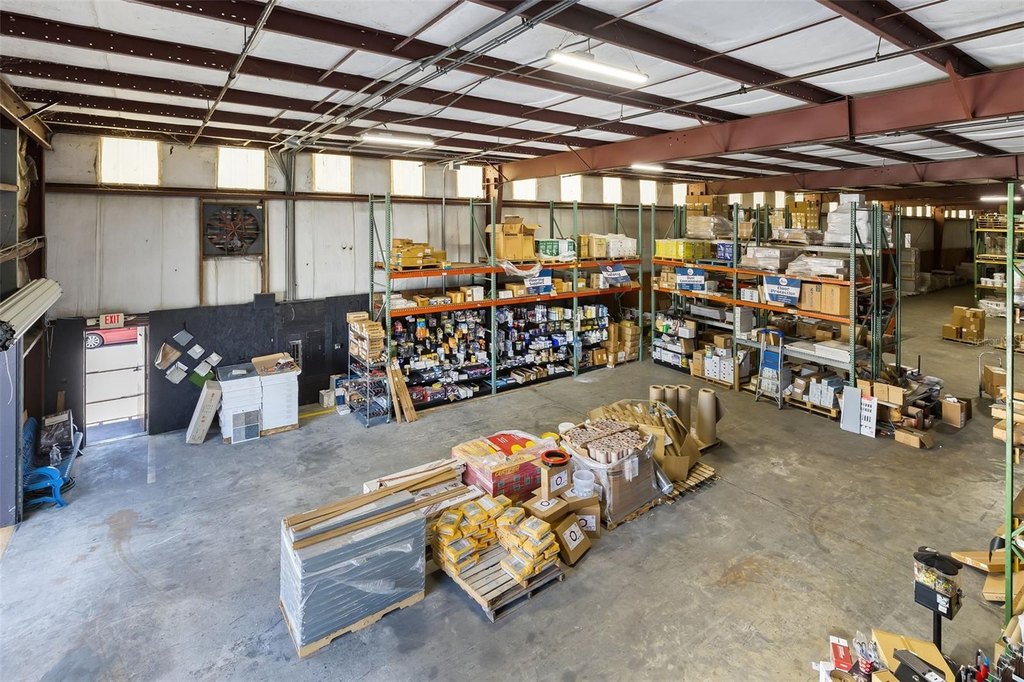
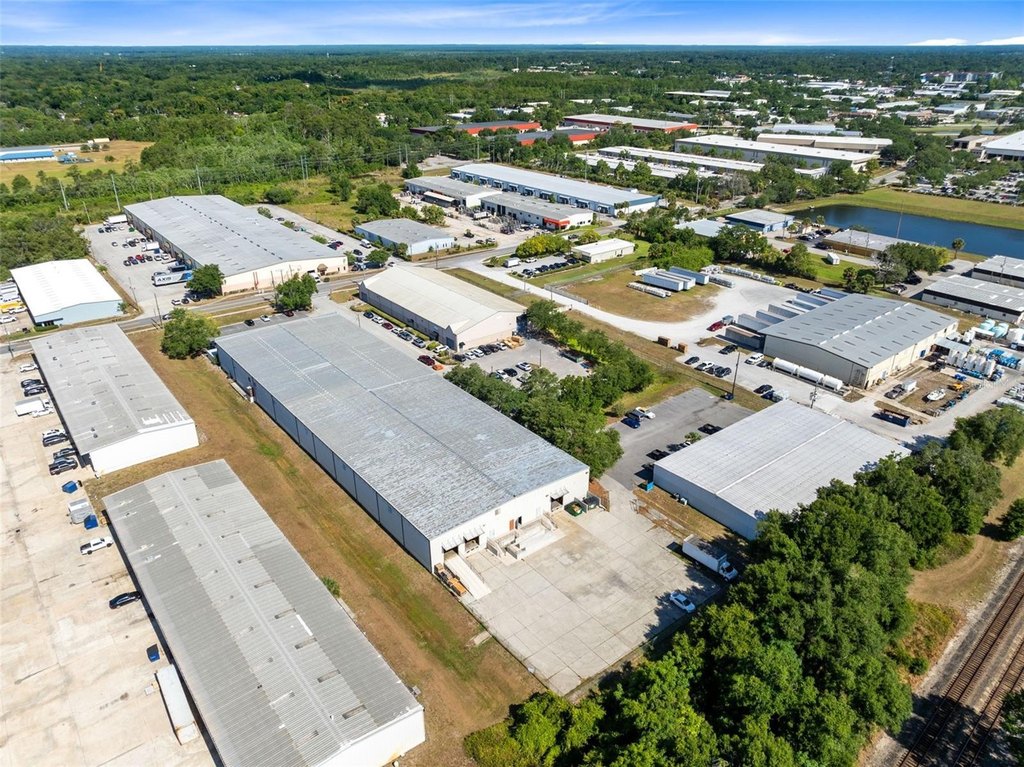
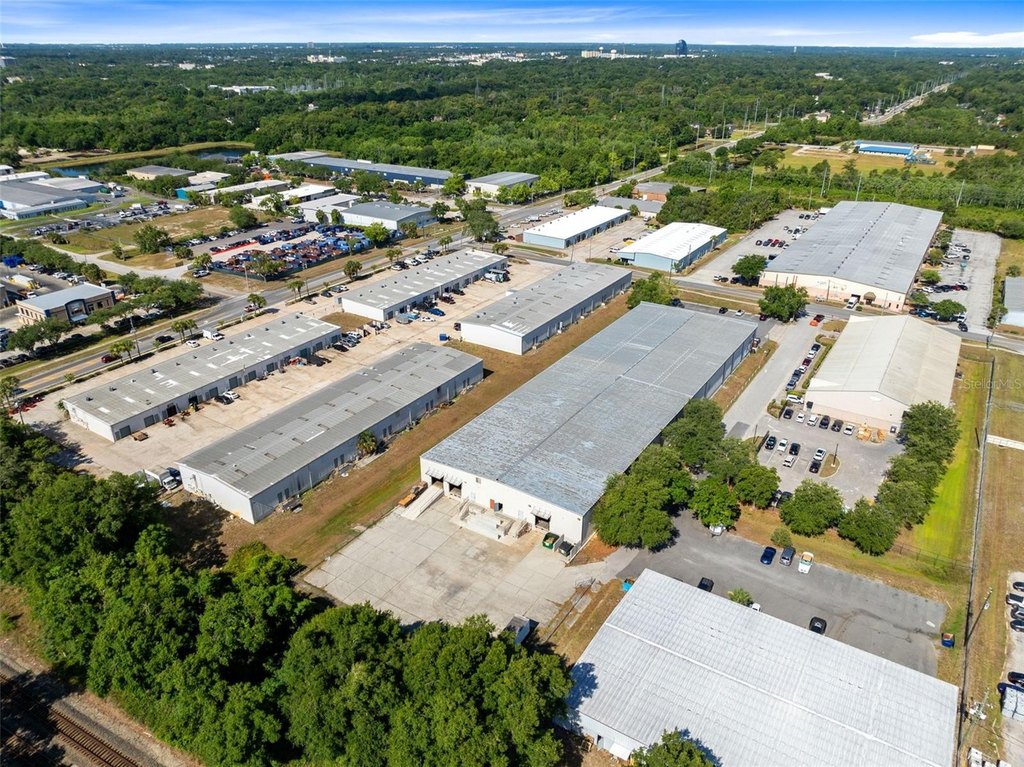
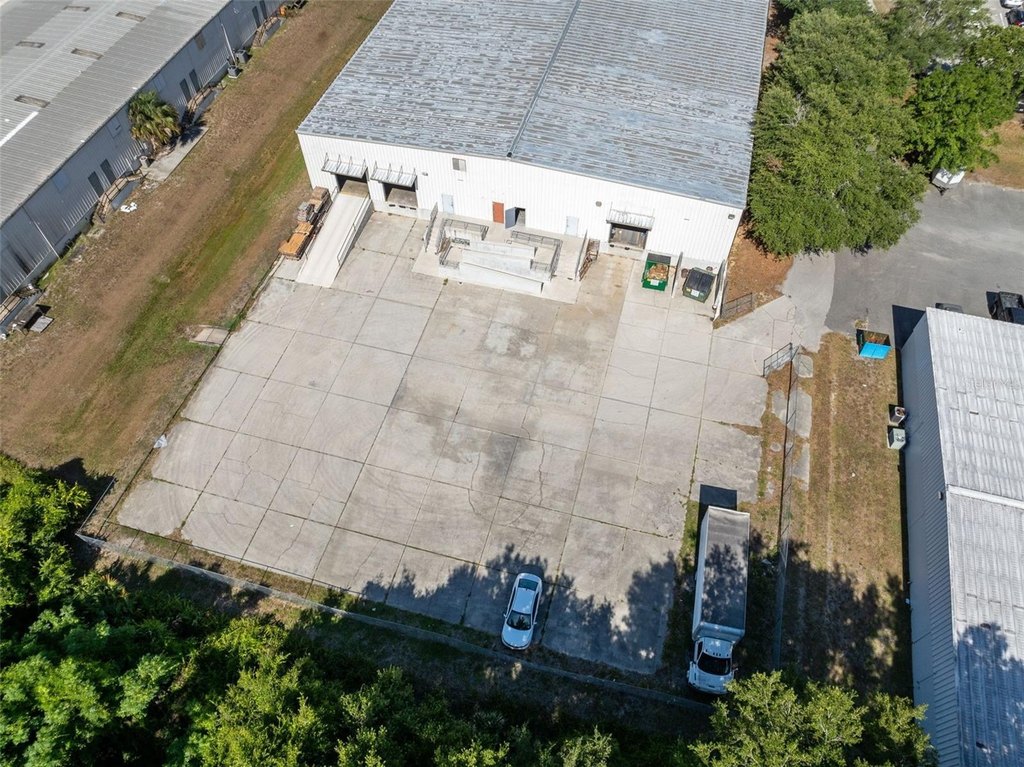
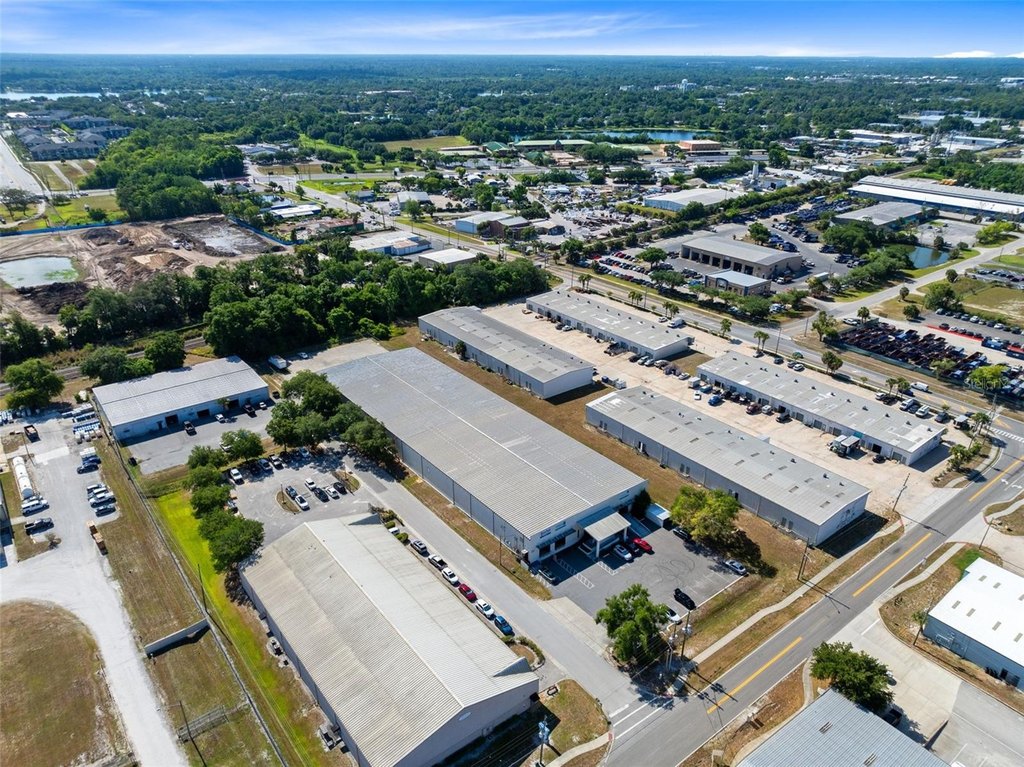
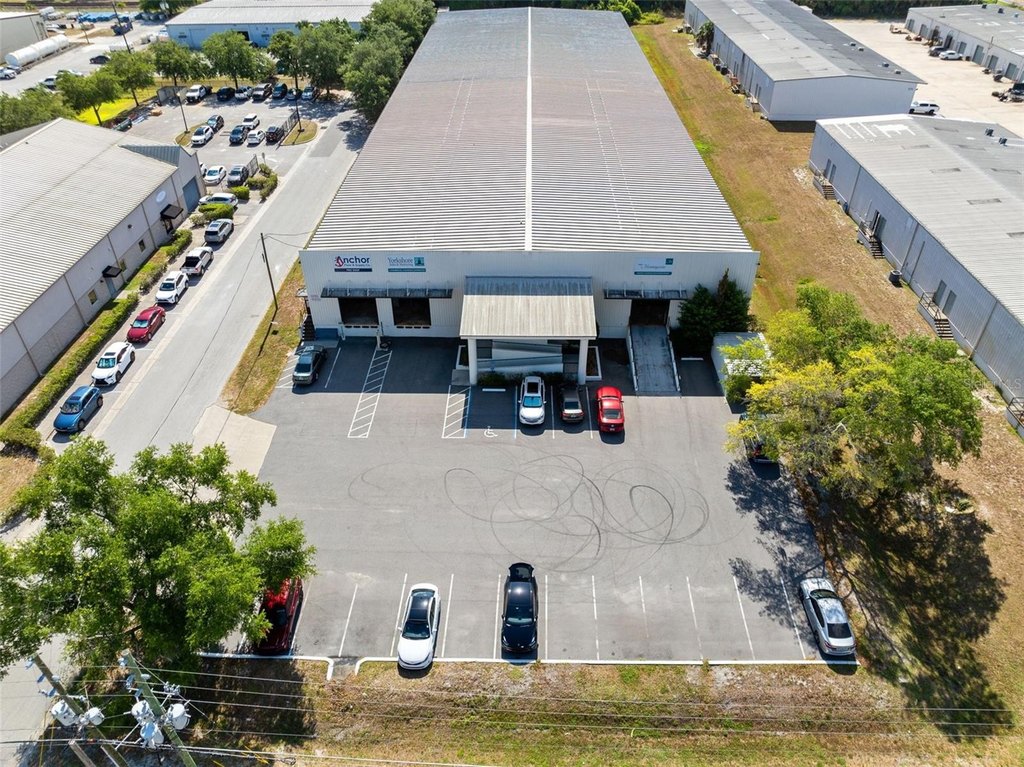
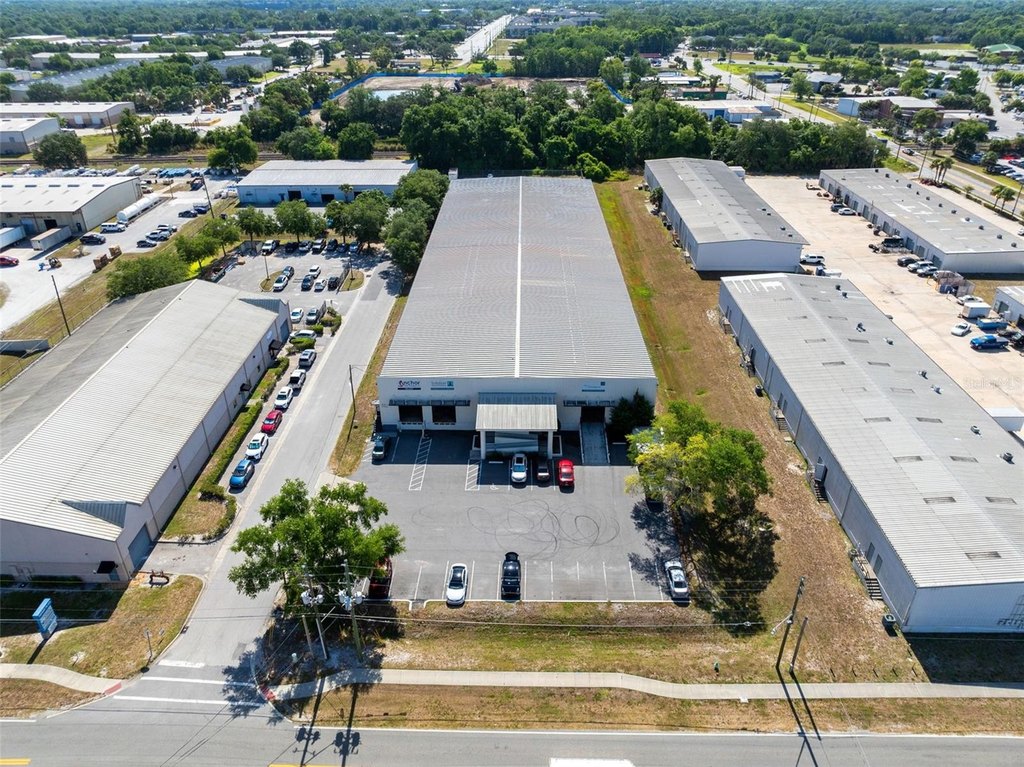
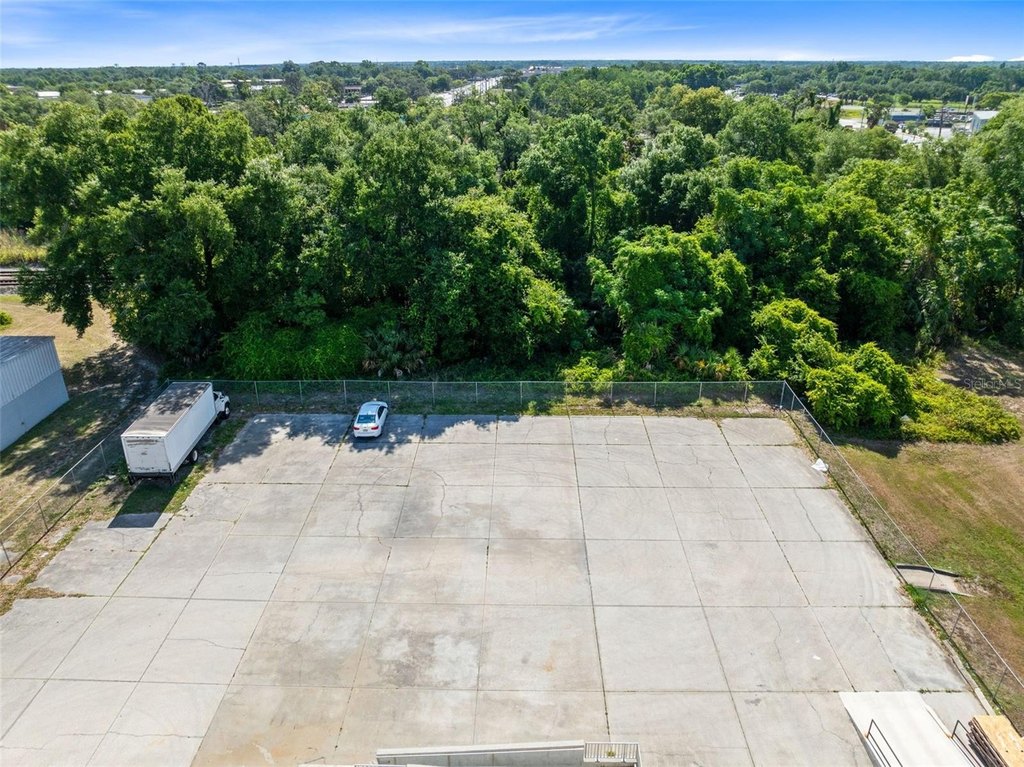
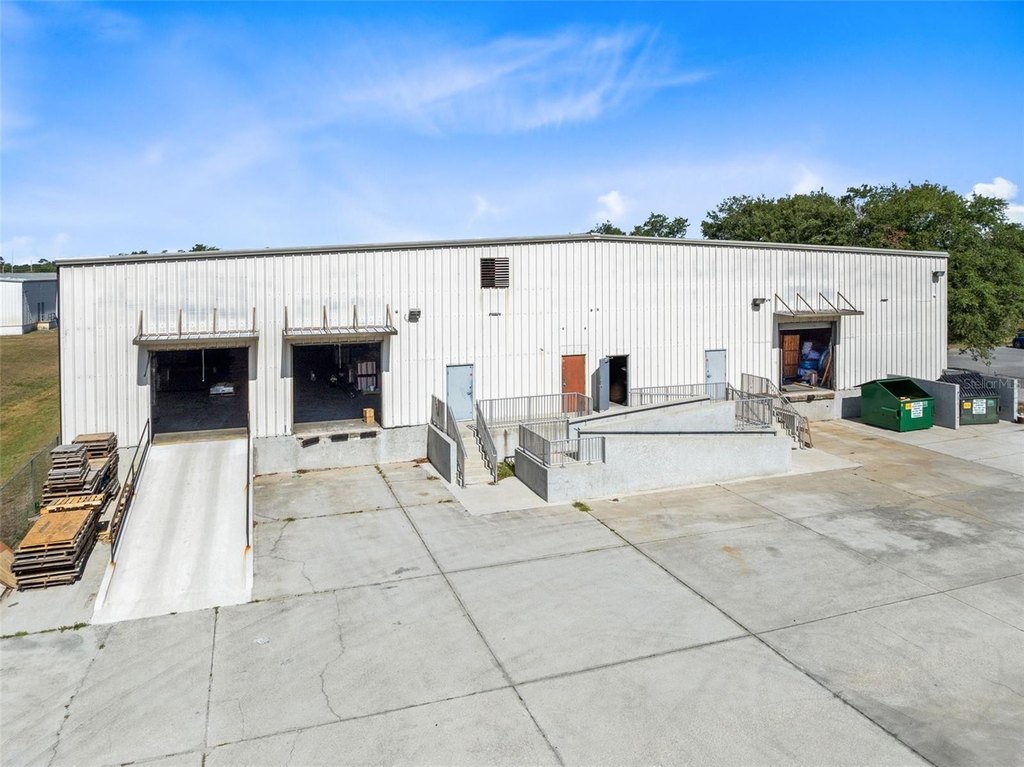
This 46,560-square-foot industrial warehouse occupies 2.38 acres and is currently leased to four tenants. The facility includes 11 offices, a 2,000-square-foot showroom, a 300-square-foot boardroom, a 600-square-foot air-conditioned storage area, and seven bathrooms. Warehouse features include approximately 18-foot ceilings, 40-by-30-foot column spacing, four dock-high doors, and two additional loading doors served by a ramp. A fenced yard of approximately 0.35 acres provides space for truck maneuvering.
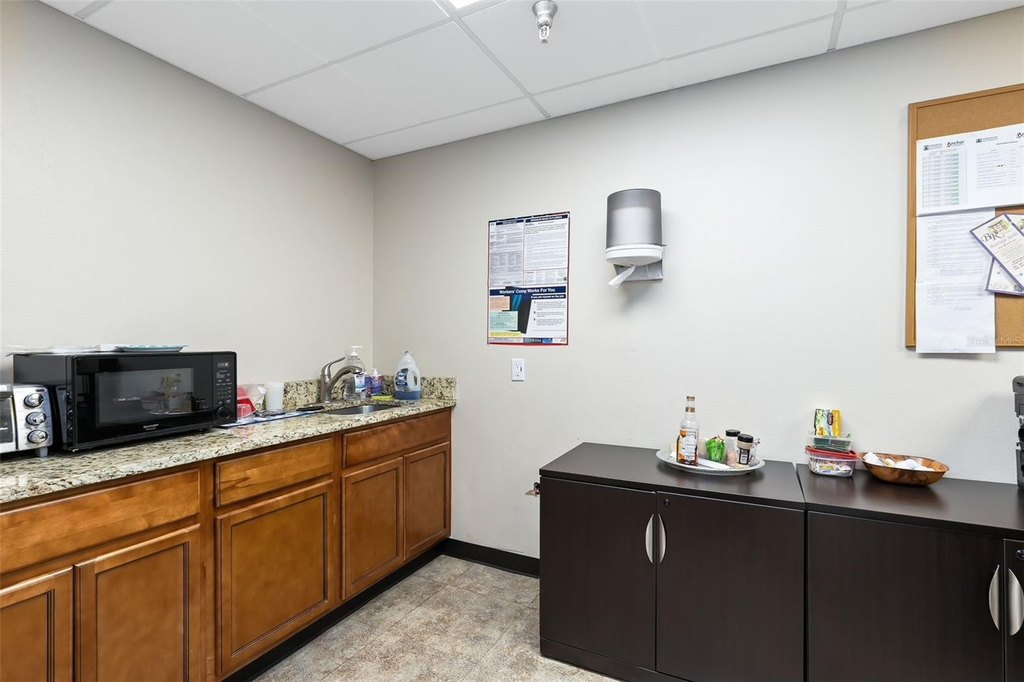
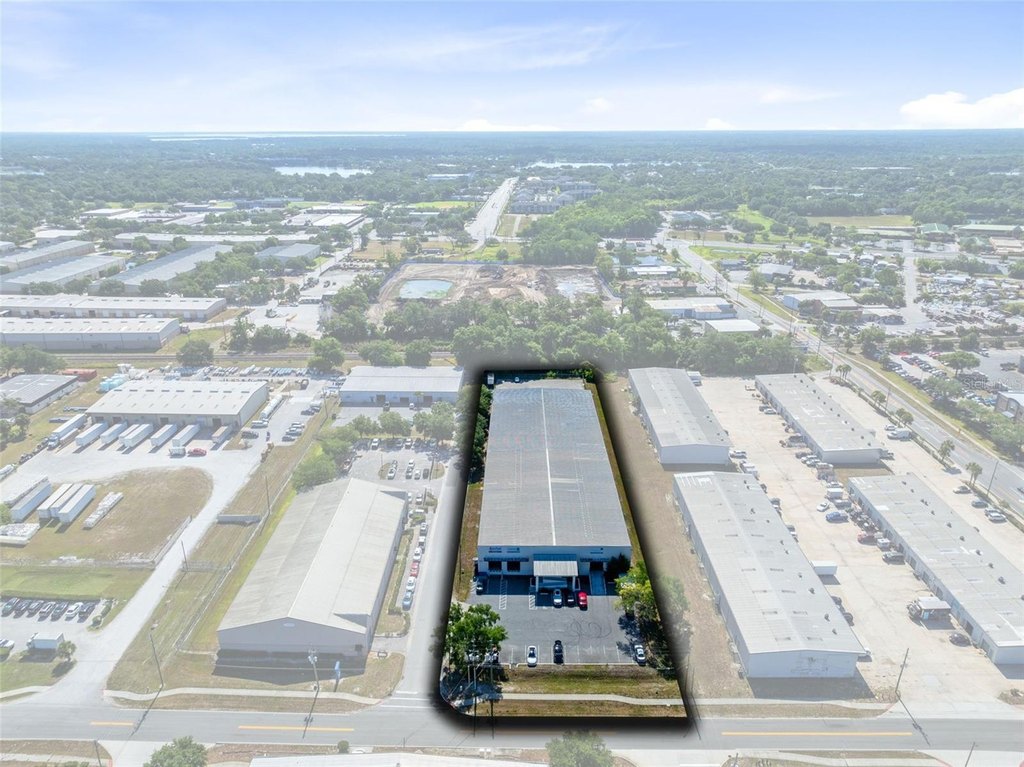
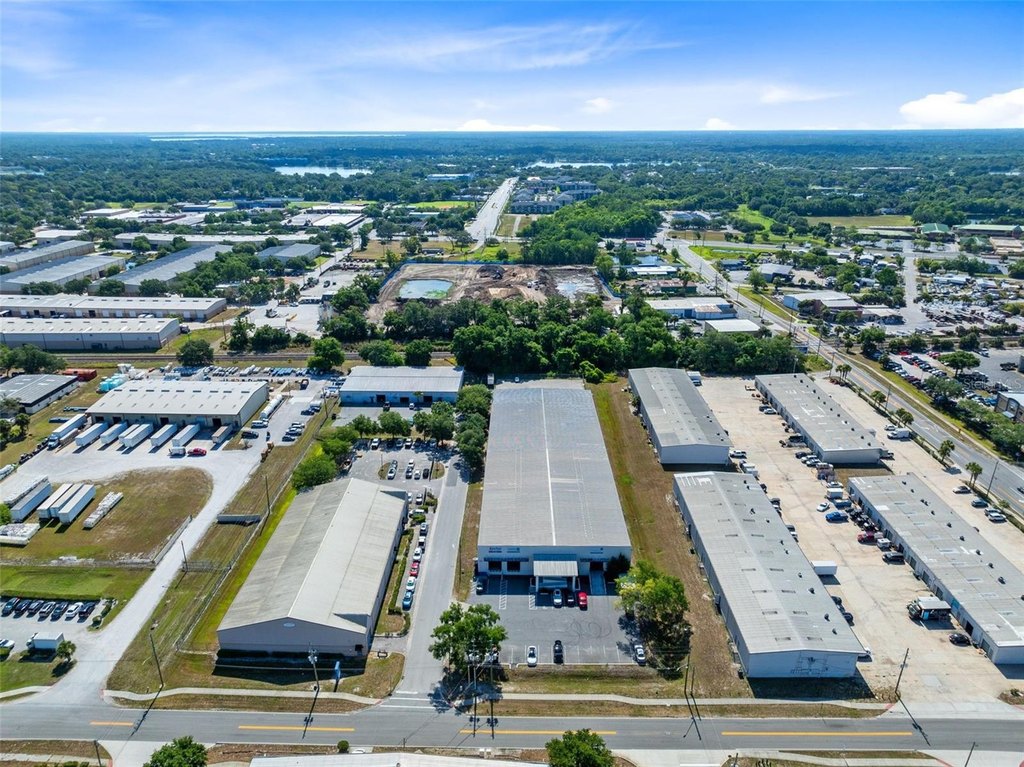
Built in 1984 and 1987, the property underwent major renovations in 2008 and 2018. Recent work includes LED warehouse lighting, updated office and showroom flooring, ceiling tiles, bathroom fixtures, pantry improvements, paving and striping, landscaping, gutters, and underground stormwater piping. The property has a metal frame, metal siding, metal roof, concrete and tile flooring, public water, and public sewer. It is located on Bennett Drive in Longwood, near UPS, FedEx, US 17/92, SR 434, SR 436, and I-4.
Built in 1984 and 1987, the property underwent major renovations in 2008 and 2018. Recent work includes LED warehouse lighting, updated office and showroom flooring, ceiling tiles, bathroom fixtures, pantry improvements, paving and striping, landscaping, gutters, and underground stormwater piping. The property has a metal frame, metal siding, metal roof, concrete and tile flooring, public water, and public sewer. It is located on Bennett Drive in Longwood, near UPS, FedEx, US 17/92, SR 434, SR 436, and I-4.
Key Highlights
- 46,560‑square‑foot warehouse on 2.38 acres
- Four dock‑high doors plus two loading doors with ramp access
- Approximately 0.35‑acre fully fenced yard with semi‑truck turnaround capacity
Financial Insights
Estimated NOI and Cap Rate
NOI / Yr
$315,831
Cap Rate
4.55%
Suggested Prices Based on Cap Rates
Cap Rate 5%
$6,316,620
$6.3M
Cap Rate 7%
$4,511,871
$4.5M
Cap Rate 9%
$3,509,233
$3.5M
Market Conditions
NOI Build-Up for 46,560 SF
Gross rent
$407.9K $8.76/SF
− Vacancy
−$36.3K −$0.78/SF
EGI
$371.6K $7.98/SF
− OpEx
−$55.7K −$1.20/SF
NOI
$315.8K $6.78/SF
Area
Seminole County, FL
Vacancy
8.90%
Lease Rate
$8.76 /SF/Yr
Expense Ratio
15.00%
Simulate Cap Rate and NOI
Suggested Prices Based on Cap Rates
Cap Rate 5%
$6,316,620
Cap Rate 7%
$4,511,871
Cap Rate 9%
$3,509,233
Alternative Uses
Best Use
Warehouse
$4.51M
$3.95M – $5.26M
NOI $315,831 @ 7.0% cap · market cap 4.55%
Second Best
Industrial
$3.72M
$3.25M – $4.33M
NOI $260,096 @ 7.0% cap · market cap 3.75%
Theoretical Best
Office A
$13.25M
$11.59M – $15.46M
NOI $927,475 @ 7.0% cap · market cap 13.37%
Zoning and permitted uses should be independently verified with authorities.
How Realmo checks its estimates
Property Analytics
Unlock full access to Insights
Subscribe to Realmo Intelligence
Open Analytics
Current Use
Lease Details
18 ft
Clear height
4
Dock-high doors
2
Drive-in doors
Multi-tenant
Tenancy
Yes
Fenced yard
Yes
Paved road access
Location Intelligence
Trade Area within ½ mile
953
Businesses Nearby
Well-served
Demand for This Use
Explore this area
Business Placement
Demographics for 32750, FL
25,261
Population
10,541
Households
2.4
Avg Household Size
43
Median Age
37%
College-Educated
93%
High-School Grad
11.4 sq mi
ZIP Area
2,216
Density / Sq Mi
$85,227
Median Household Income
$48,311
Median Earnings
$1,633
Median Rent
$350,600
Median Home Value
Check the figures for this property
Cap Rate, Value Estimation, Potential NOI and more
View Realmo Analytics
Market
Vacancy Rate% for Industrial in South region

Questions? Ask Rey
Realmo’s AI knows this listing — price, zoning, demand, history. Ask anything.




Similar Off Market Nearby
- JVDRVStorage.com — 350 Anchor Rd, Casselberry, FL 32707
- Life Storage — 130 Concord Dr, Casselberry, FL 32707
- Plumosa Storage Units — 440 Plumosa Ave, Casselberry, FL 32707
- Seminole 5th Wheel — 500 Plumosa Ave, Altamonte Springs, FL 32701
- Warehouse Location — 1355 Bennett Dr #233, Longwood, FL 32750
Frequently Asked Questions
What type of property is this?
Warehouse - Updated industrial facility with warehouse, office, showroom, fenced yard, loading infrastructure, and public utilities.
Where is this warehouse located?
The property is located at 1356 BENNETT Drive Longwood, FL.
What is the asking price?
The asking price for this property is $6,937,000.
What are key features of this property?
This property features: 46,560‑square‑foot warehouse on 2.38 acres; Four dock‑high doors plus two loading doors with ramp access; Approximately 0.35‑acre fully fenced yard with semi‑truck turnaround capacity