B-4 Storefront Property with Adjoining
For Sale
$325,000
1005 S Pueblo Blvd, Pueblo, CO 81005
Commercial Sale, Pueblo, CO
Property Size1,150 SF
Lot Size0.59 Acres
Price / SF$282.61
Days on Market90
Property Features for 1005 S Pueblo Blvd
General Information
Property type
Commercial Sale
Property subtype
Other
Zoning
B-4
Subdivision
Regency And Meadows
Lot features
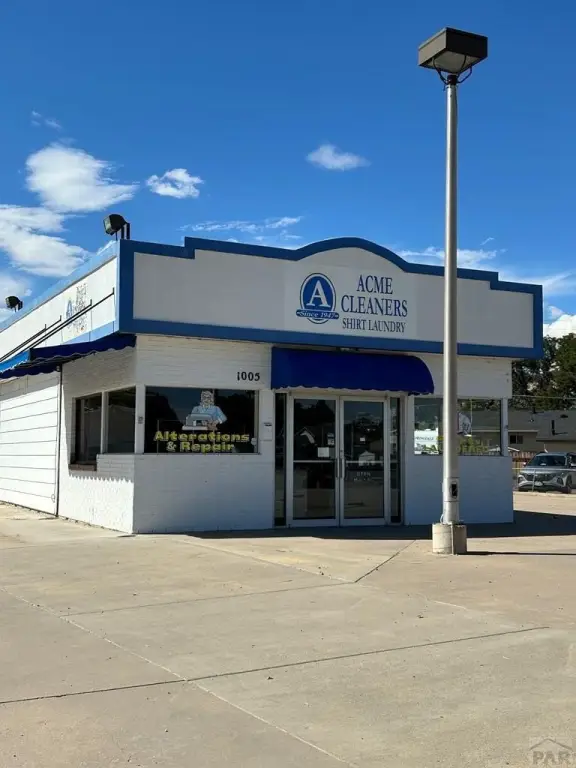
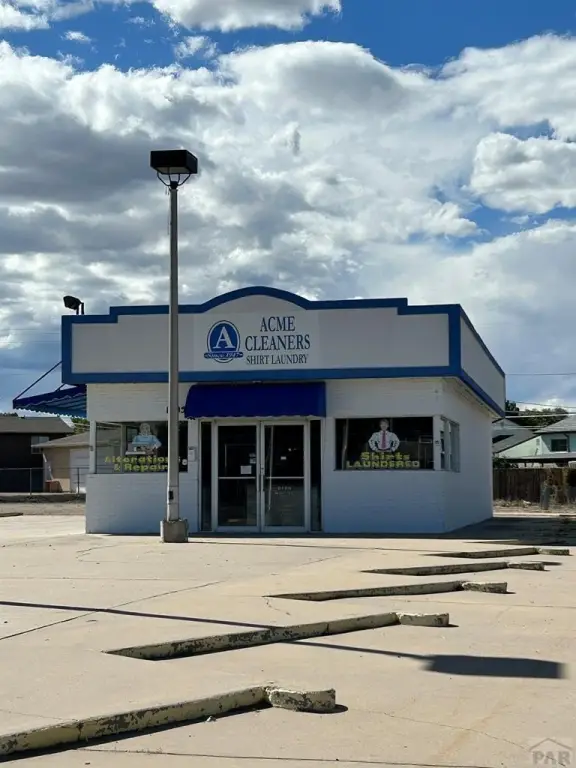
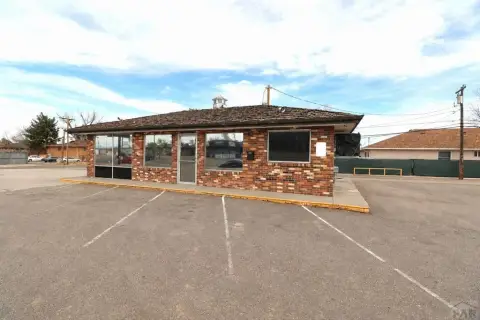
Free Standing
Elementary school
60
Middle school
60
High school
60
Standard status
Active
APN
1504401033
Size
1,150 SF
Lot size
0.59 Acres
Taxes and HOA fees
Tax Year
2024
Tax Description
LOT 1 STANLEYS FILING 3RD LOT 2 STANLEYS FILING #3 LESS POR TO DPT BY PROJECT #SHE 0451-009 FORMERLY #15-044-01-036
Tax Annual Amount
3698
Legal Description
LOT 1 STANLEYS FILING 3RD LOT 2 STANLEYS FILING #3 LESS POR TO DPT BY PROJECT #SHE 0451-009 FORMERLY #15-044-01-036
Utilities
Sewer type
Public Sewer
Heating system
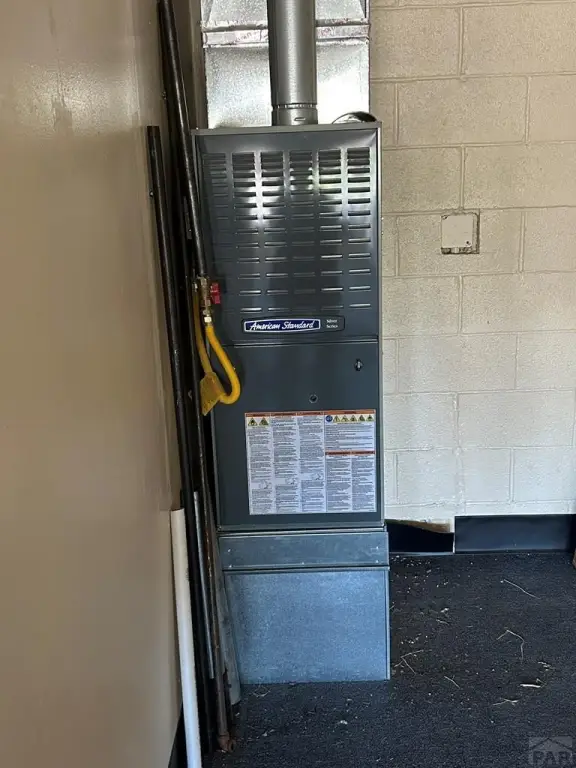
Natural Gas, Forced Air
Cooling system
Evaporative Cooling
Water source
Public
Building Details
Year built
1977
Floors in Building
1
Roof type
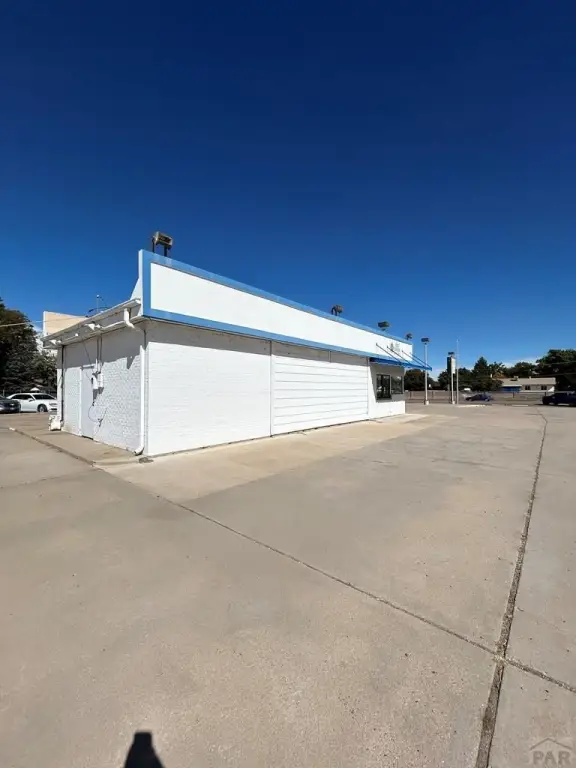
Flat
Listing Agency:
RE/MAX Of Pueblo Inc · RE/MAX International
(719) 546-1717
Listed By:
John Grove · License #40034264
(719) 369-7169
Added: Jul 9
Changed: Sep 13
Last Checked: Oct 6 at 10:06PM
MLS# 234881
Copyright © 2026 Pueblo Association of Realtors. All rights reserved. All information provided by the listing agent/broker is deemed reliable but is not guaranteed and should be independently verified.
Investment Insights
Based on property information with market context.
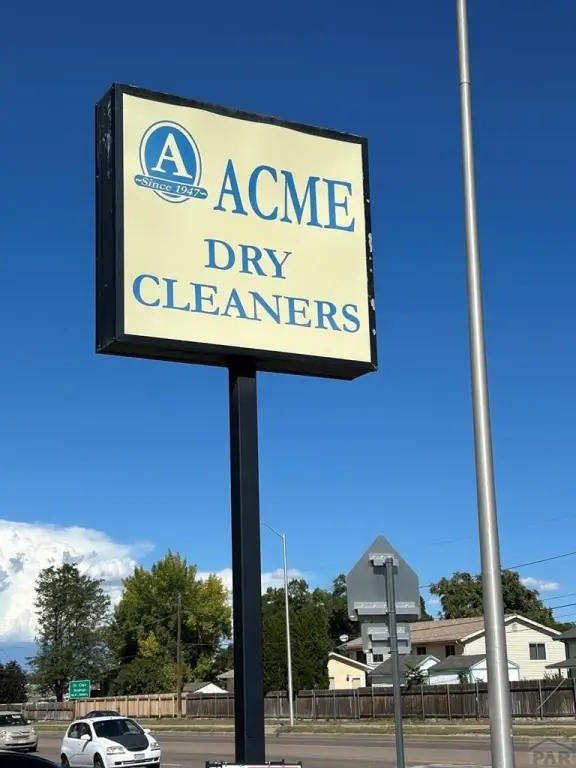
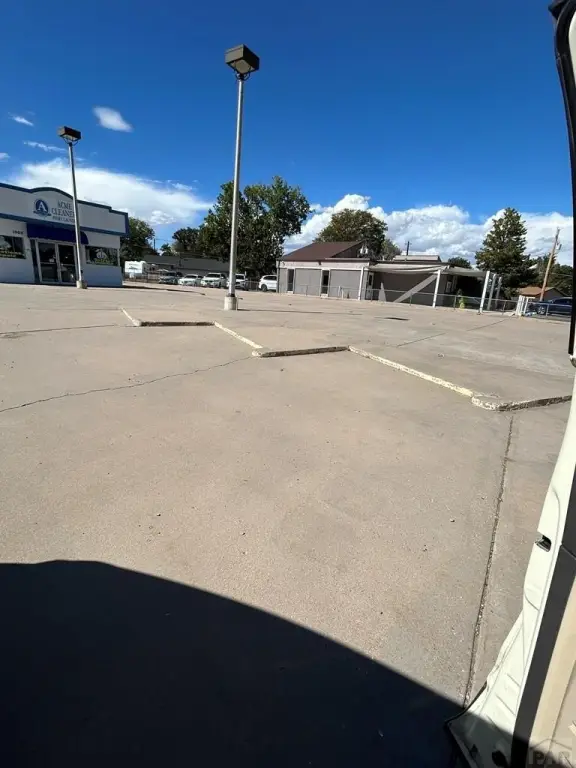
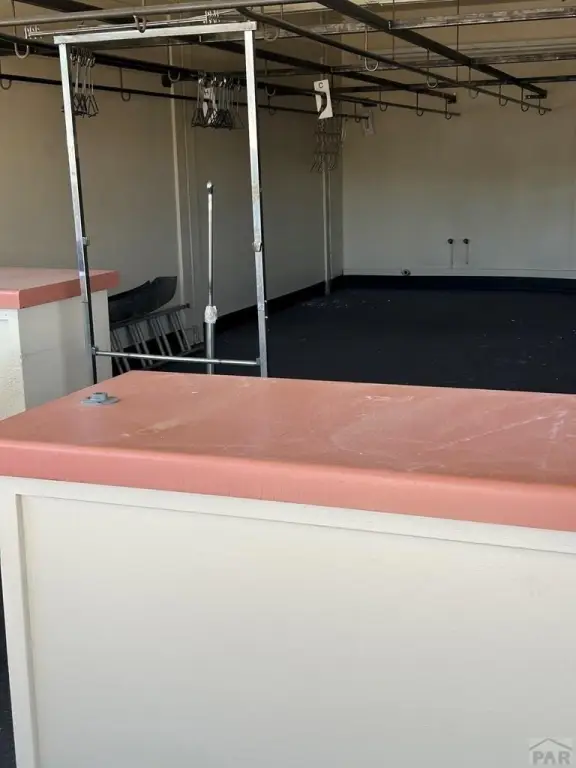
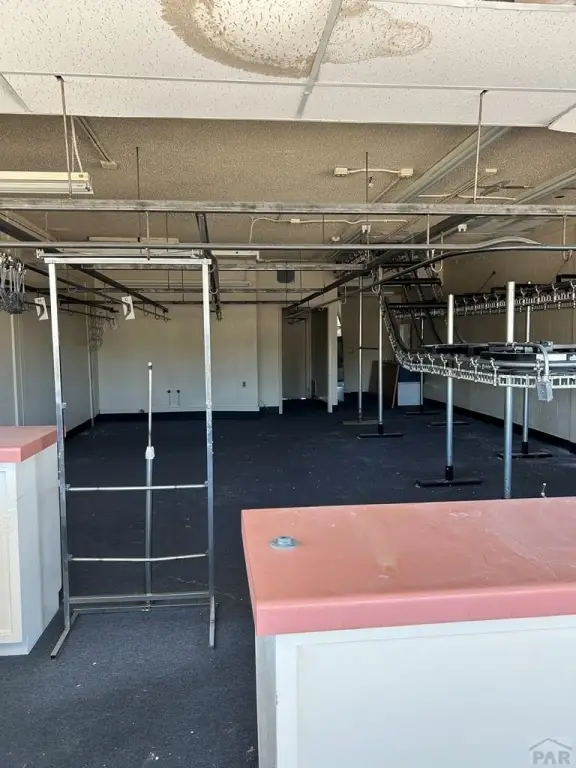
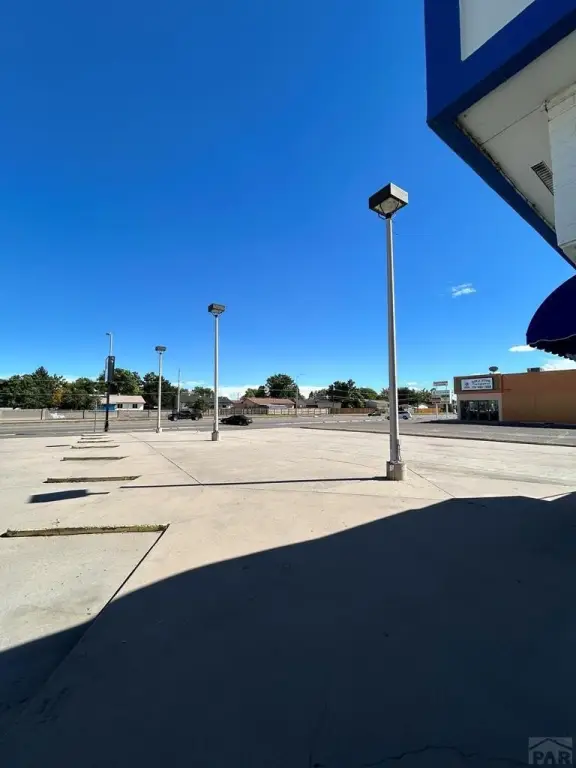
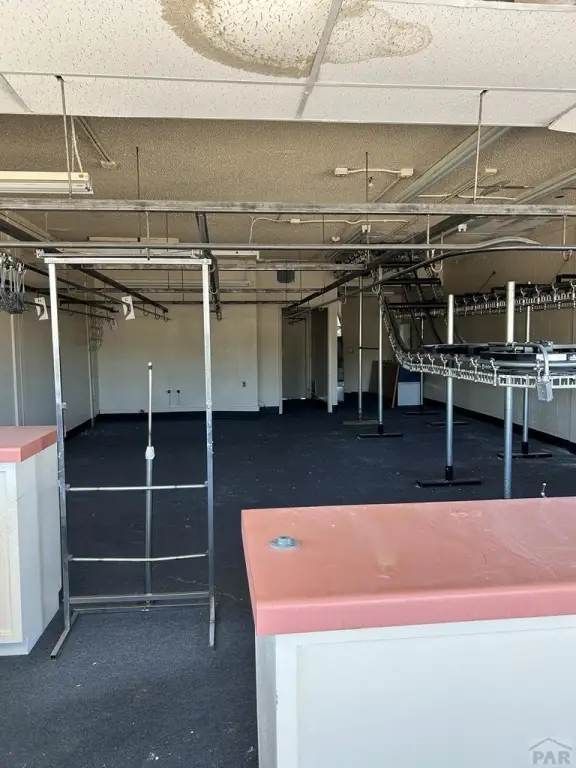
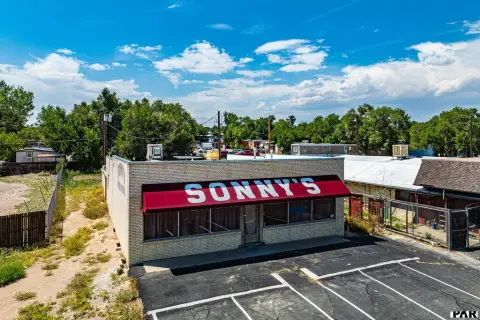
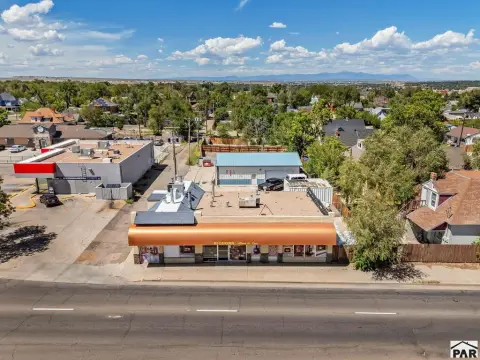
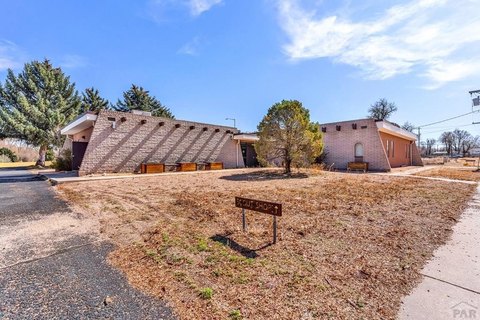
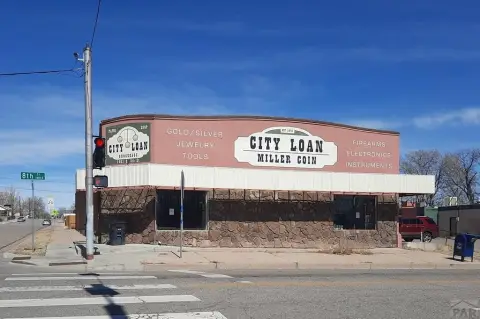
This storefront property includes a 1,150-square-foot building on a 0.59-acre lot, plus an adjoining 0.31-acre paved parcel. The building dates to 1977 and features a flat roof, natural gas forced-air heat, evaporative cooling, public water, and public sewer. Concrete paving remains in place around the structure, including the original drive-in layout cutouts from its former Sonic location.
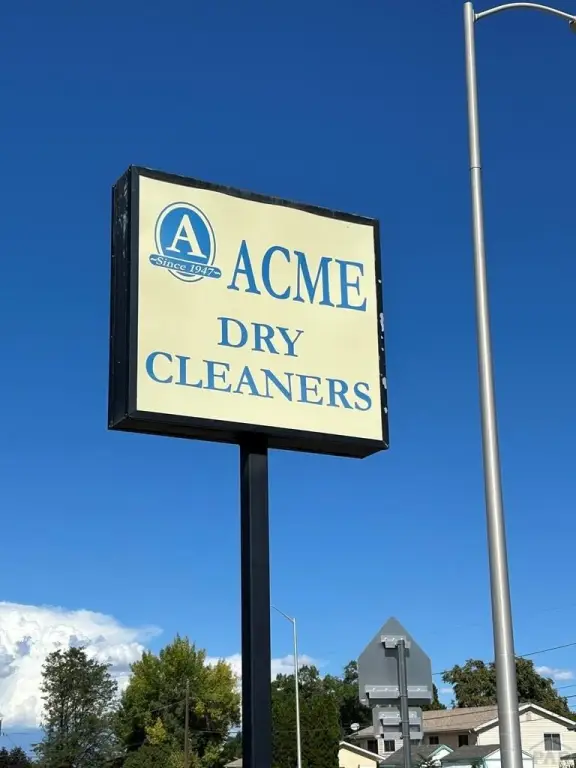
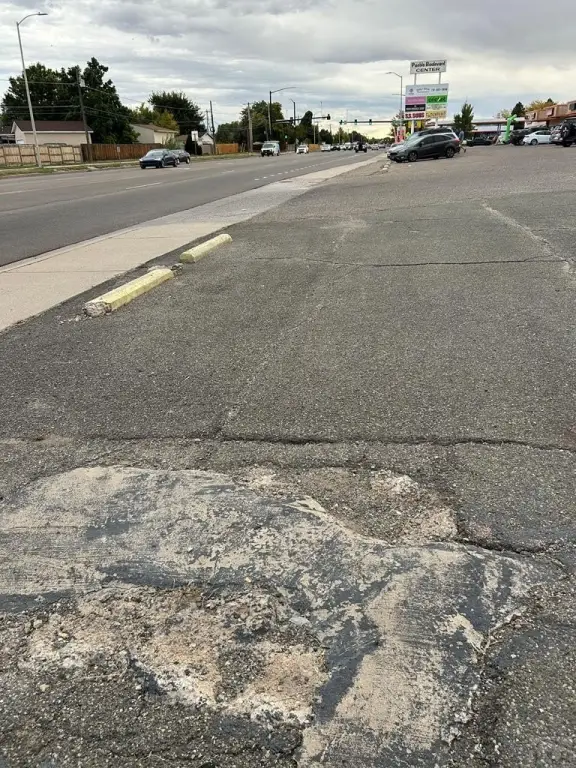
Located at 1005 S. Pueblo Blvd. in Pueblo, the property fronts State Hwy. 45, a major route connecting Hwy 50 with I-25. CDOT reports approximately 27,000 vehicles per day passing the site. The additional parcel includes an entry curb cut, expanding the overall site configuration. B-4 zoning supports a range of commercial possibilities identified for the property, including retail sales, restaurant, medical office, auto dealership, car wash, and beauty or barber services.
Located at 1005 S. Pueblo Blvd. in Pueblo, the property fronts State Hwy. 45, a major route connecting Hwy 50 with I-25. CDOT reports approximately 27,000 vehicles per day passing the site. The additional parcel includes an entry curb cut, expanding the overall site configuration. B-4 zoning supports a range of commercial possibilities identified for the property, including retail sales, restaurant, medical office, auto dealership, car wash, and beauty or barber services.
Key Highlights
- 1,150‑square‑foot storefront building on a 0.59‑acre primary lot
- Adjoining 0.31‑acre paved parcel included in the sale
- B‑4 zoning supports multiple commercial use possibilities
Financial Insights
Estimated NOI and Cap Rate
NOI / Yr
$10,589
Cap Rate
3.26%
Suggested Prices Based on Cap Rates
Cap Rate 5%
$211,780
$211.8K
Cap Rate 7%
$151,271
$151.3K
Cap Rate 9%
$117,656
$117.7K
Market Conditions
NOI Build-Up for 1,150 SF
Gross rent
$16.0K $13.92/SF
− Vacancy
−$880 −$0.77/SF
EGI
$15.1K $13.15/SF
− OpEx
−$4.5K −$3.95/SF
NOI
$10.6K $9.21/SF
Area
Pueblo, CO
Vacancy
5.50%
Lease Rate
$13.92 /SF/Yr
Expense Ratio
30.00%
Simulate Cap Rate and NOI
Suggested Prices Based on Cap Rates
Cap Rate 5%
$211,780
Cap Rate 7%
$151,271
Cap Rate 9%
$117,656
Alternative Uses
Best Use
Retail
$151.3K
$132.4K – $176.5K
NOI $10,589 @ 7.0% cap · market cap 3.26%
Second Best
—
—
no second resolved use
Theoretical Best
Office A
$239.6K
$209.7K – $279.6K
NOI $16,775 @ 7.0% cap · market cap 5.16%
Zoning and permitted uses should be independently verified with authorities.
Property Analytics
Unlock full access to Insights
Subscribe to Realmo Intelligence
Open Analytics
Current Use
Lease Details
27,000 VPD
Traffic count
Yes
Paved road access
Location Intelligence
Trade Area within ½ mile
215
Businesses Nearby
Under-served
Demand for This Use
Explore this area
Business Placement
Demographics for 81005, CO
31,327
Population
13,578
Households
2.3
Avg Household Size
44
Median Age
26%
College-Educated
93%
High-School Grad
198.7 sq mi
ZIP Area
158
Density / Sq Mi
$67,500
Median Household Income
$45,198
Median Earnings
$990
Median Rent
$282,100
Median Home Value
Check the figures for this property
Cap Rate, Value Estimation, Potential NOI and more
View Realmo Analytics
Market
Vacancy Rate% for Retail in West region

Questions? Ask Rey
Realmo’s AI knows this listing — price, zoning, demand, history. Ask anything.

Frequently Asked Questions
What type of property is this?
Storefront property - B-4 zoning, paved parking, and an adjoining parcel with an entry curb cut support varied commercial use.
Where is this storefront property located?
The property is located at 1005 S Pueblo Blvd Pueblo, CO.
What is the asking price?
The asking price for this property is $325,000.
What are key features of this property?
This property features: 1,150‑square‑foot storefront building on a 0.59‑acre primary lot; Adjoining 0.31‑acre paved parcel included in the sale; B‑4 zoning supports multiple commercial use possibilities