Nash, TX Commercial Real Estate for Sale
Notify Me
Texarkana, TX
Wake Village, TX
Texarkana, AR
Hooks, TX
Redwater, TX
- Texarkana, TX
- Wake Village, TX
- Texarkana, AR
- Hooks, TX
- Redwater, TX

Opportunities in Nearby Cities
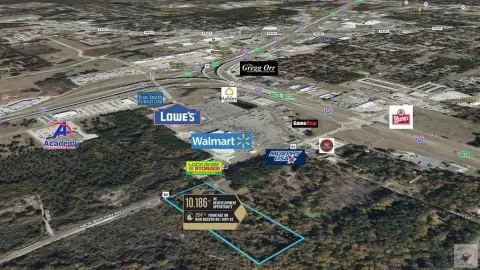


Off-Market Properties in Nash, TX


Nash, TX Commercial Real Estate Market Trends and Statistics
Explore 72 commercial real estate for sale in Nash, TX on our real estate platform.
Demographics Overview
Population
3,601
Population Growth (5Y)
+7.5%
Median Household Income
$38,750
College Educated
22.9%
High-Yield Neighborhoods for Investment
Identify Nash submarkets with the highest inventory density on the market and evaluate the average listing prices of real estate assets
| Neighborhood | Average Price |
|---|---|
| Texarkana - 75503 | $199K |
| Nash - 75569 | $701.2K |
Taxes & Financing
Tax Rate (average for all types)
1.95%
Property Tax per SF
$46.23 per SF
Tax Rate vs County Average
0.22 pp below county avg
Average Loan-to-Value
65.0%
Listings Trend
New vs delisted commercial listings in Bowie County
New
Delisted
Total CRE Inventory on Market (SF)
Average Property Price per SF
For-sale Office pricing trends in Bowie County
Office
How Realmo verifies these figures
Need Help?
Reach out if you need assistance with Realmo tools or have questions about your listings