
New search
Property profile & analytics
OFF-MARKET
Estimated value
$1,485,000
Drive through restaurants
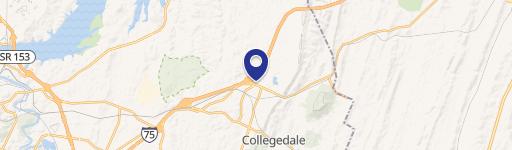
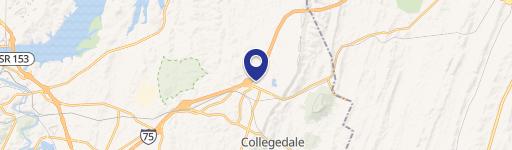
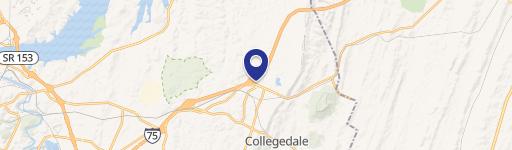
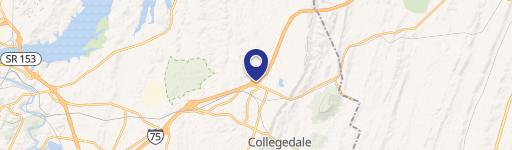
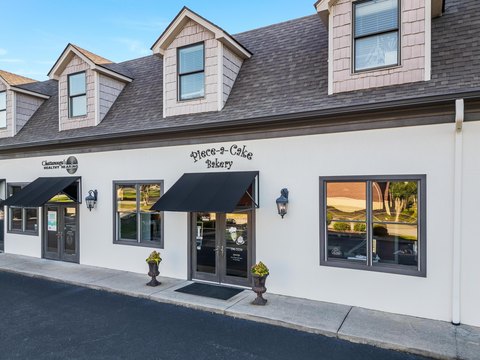
9315 Apison Pike, Ooltewah, TN 37363-4340
Entity Owned
3-yr Hold
Free & Clear
Property ID
US80-3448556
Property profile
Verified
Property type
Drive through restaurants
Use group
DRIVE-THRU RESTAURANT, FAST FOOD
Year built
2022
Total area
3,336 SF
Lot
2.01 ac (87,599 SF)
Zoning code
C2
APN
140 187.20
UPID
US80-3448556
Cap rate & NOI
Priority signal for investors
Implied cap rate, NOI & suggested price
Cap rate vs submarket · NOI estimate · 3 price anchors
Implied cap rate, NOI & suggested price
Cap vs submarket · NOI estimate · 3 price anchors
Current use
Occupant on record · Public records
-
Jack’s Restaurant Take-out & Catering
Value estimations
Realmo proprietary · 4 methods
AI Approach
AI
by Request
CAP Approach
CAP
by Request
Comparable Approach
Comparable
$1.90M
Blend (final)
Blend
$1.49M
Owner & transaction history
Jacks Family Restaurants LP · 3 yrs held
Jacks Family Restaurants LP
since 2023
Last sale
$1.5M
2 recorded transactions
Zoning & alternative use
C2 · Ooltewah, TN
Permitted uses
Permitted uses
Allowed · conditional · prohibited
Cap rate
Implied · in-place · derived from last sale + estimated NOI
Implied Cap rate
#1
Implied · in-place · NOI ÷ last sale
In-place · derived from last sale + estimated NOI
Cap rate, NOI & submarket benchmark
Implied cap rate vs Ooltewah submarket · NOI estimate · Typical band, median & reading
Implied cap rate, NOI & submarket benchmark
Cap vs Ooltewah submarket · NOI estimate · typical band, median & reading
Refine your cap rate
8-question underwriting flow
1.
Property current status — Going-In vs Stabilized
2.
Price for denominator — asking / offer / market
3.
Leasing status & lease structure (NNN / Gross)
4.
Tenant risk profile & vacancy assumption
5.
Upload T12 / rent roll / OM (optional)
Refine in 60 seconds, get exact suggested price
T12 upload · Submarket benchmarks · Sensitivity grid
Suggested price · 3 cap rate anchors
Income approach @ 5% / 7% / 9% — aggressive / typical / conservative
Suggested price at 5% / 7% / 9% cap
Aggressive / typical / conservative · Implied $/SF per anchor · Sensitivity grid
Suggested price at 5% / 7% / 9% cap
Aggressive / typical / conservative · implied $/SF · sensitivity
Value
AI, CAP & Alternative Use estimations · Realmo proprietary blendValue Estimations
Based on Realmo’s proprietary methodology
AI Approach
Method
Estimation
Statistic approach
$1,465,000
ML approach
by Request
CAP Approach
CAP Return
Estimation
6%
by Request
6.5%
by Request
7%
by Request
Alternative Use
Use
Estimation
RESTAURANT
$1,140,000
Current use
COMMERCIAL (GENERAL)
$1,085,000
Change: -5% · Conversion: Easy
Blend value · Realmo final
$1.49M
Range $1.34M – $1.63M · ±10% · vs last sale $1.49M (Apr 6 2023)
Last sale anchor
$1.49M
Apr 6 2023
Realmo estimate · informational only.
These numbers are calculated by our models from public records and may not reflect actual market value.
Not an appraisal.
Verify with a licensed appraiser before transacting. Realmo accepts no liability for divergence from real-world outcomes.
View the full estimation — every method, every assumption
Confidence drivers & risk notes · Custom comparable set · Free for first 3 / day
Full estimation methodology
Every method · every assumption · confidence drivers
Price per SF
Sale + rent benchmarks
Subject property
$445 / SF
Submarket sale & rent benchmarks
Median sale $/SF · Asking & closed rent · Submarket vacancy
Submarket sale & rent benchmarks
Median sale $/SF · asking & closed rent · submarket vacancy
Property tax & assessments
Tax year 2023Property tax & assessments
Tax year 2023
Tax billed
$26,204
Tax year 2023
Assessed value
$691,400
Assessed 2023
Previous assessed
$183,960
+275.8% YoY
Effective rate
3.79%
On assessed value
Land market value
$706,300
Improvement market value
$1,022,200
Total market value
$1,728,500
Comparables
6 recent transactions · within 1.5 miComparable in this city
6 recent transactions
Comparable in this City
Similar Nearby for Sale

Similar Nearby for Lease


Recent comparable sales
Sale price & price/SF · Sale date & distance · Adjustments & confidence
Recent comparable sales
Sale price & $/SF · sale date & distance · adjustments
Property description
Physical attributes from public recordsBuilding & lot
Public records
Property type
Drive through restaurants
Use group
DRIVE-THRU RESTAURANT, FAST FOOD
Status
Off-Market
Year built
2022
Stories
1
Total area
3,336 SF
Lot
2.01 ac (87,599 SF)
Zoning code
C2
APN
140 187.20
UPID
US80-3448556
Jurisdiction
HAMILTON
Zoning & alternative use
C2 · Ooltewah, TN
Zoning C2 · permitted uses
C2 · Ooltewah, TN
Permitted & conditional uses
Allowed uses · Special-permit conditions · Prohibited uses
Permitted & conditional uses
Allowed · special-permit conditions · prohibited
Ooltewah. Always verify with local authorities before improvements.
Alternative use value scenarios
Repositioning upside vs current use
RESTAURANT Current
Est. value
$1.1M
COMMERCIAL (GENERAL)
Est. value
$1.1M
RESTAURANT Current
COMMERCIAL (GENERAL)
Alternative use deep dive — conversion cost, permits, timeline
Conversion cost estimate · Permit path & risks · Stabilized NOI per option
Alternative use deep dive
Conversion cost · permit path · stabilized NOI per option
Building & site characteristics
From public records
Year built
2022
Stories
1
Lot
2.01 ac
Current owner
From public records · entity-resolved
Jacks Family Restaurants LP
Entity
Free & Clear · 3 yrs held
Mailing address
902 CARNEGIE CTR STE #520, PRINCETON, NJ 08540-6531
Ownership since
2023
Owner contacts — direct phone, email, and related entities
Decision-maker phone · Verified email · Related entities & filings
Owner contacts
Email · phone · related entities
Sales History
2 recorded events · public records
Date
Price
Buyer
Seller
Deed Type
Mortgage
Apr 6, 2023
—
Jacks Family Restaurants LP
Scf Rc Funding IV LLC
Lease
—
Apr 6, 2023
$1,492,537
Scf Rc Funding IV LLC
Jacks Family Restaurants LP
Special Warranty Deed
—
Coming soon
Costs & Benchmarks
Operating expenses, capex projections, utility benchmarks, and submarket comparables — all in one view.
Coming soon
Risks
Flood, climate, environmental, title, and tenant-concentration risk — surfaced with mitigations and source citations.
Try Rey
Ask anything about this address in plain English.
“Is 15.6% cap rate sustainable?” · “Best tenant mix for BU1?” · “What’s the redev upside?”
You own 9315 Apison Pike?
List it free. Reach 20,000 daily buyers.
We’ve already pulled the facts. Confirm photos + price and you’re live in 2 minutes.
List this address →
Full reports are paid
Unlock the full Property Analytics report
Start free for 7 days — no card required. Full owner contacts, all 4 valuations with methodology, refine flow, comparable adjustments, foot-traffic deep dive, export to PDF / CSV.


