
New search
Property profile & analytics
OFF-MARKET
Estimated value
$13,985,000
Retail space
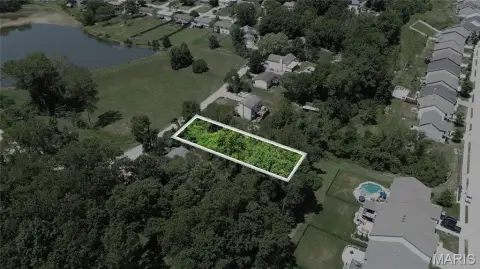
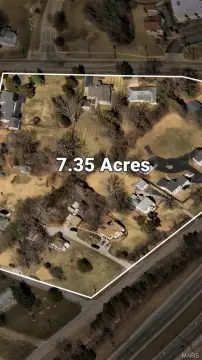
909 Horan Dr, Fenton, MO 63026-2401
Entity Owned
6-yr Hold
~
Est. High Equity
Property ID
US48-0737112
Property profile
Verified
Property type
Retail space
Use group
RETAIL STORES (PERSONAL SERVICES)
Year built
2000
Total area
67,126 SF
Lot
4.88 ac (212,573 SF)
Zoning code
21BP-3
APN
26O-1-1-005-3
UPID
US48-0737112
Cap rate & NOI
Priority signal for investors
Implied cap rate, NOI & suggested price
Cap rate vs submarket · NOI estimate · 3 price anchors
Implied cap rate, NOI & suggested price
Cap vs submarket · NOI estimate · 3 price anchors
Value estimations
Realmo proprietary · 4 methods
AI Approach
AI
$11.56M
CAP Approach
CAP
$13.89M
Comparable Approach
Comparable
by Request
Blend (final)
Blend
$13.99M
Owner & transaction history
St Louis Indl Portfolio LLC · 6 yrs held
St Louis Indl Portfolio LLC
since 2020
Last sale
$15.2M
3 recorded transactions
Zoning & alternative use
21BP-3 · Fenton, MO
Permitted uses
Permitted uses
Allowed · conditional · prohibited
Top alternative use upside
Restaurant
$21.9M
+199.0%
Auto repair, garage
$9.5M
+30.4%
Office building
$9.5M
+30.1%
Cap rate
Implied · in-place · derived from last sale + estimated NOI
Implied Cap rate
#1
Implied · in-place · NOI ÷ last sale
In-place · derived from last sale + estimated NOI
Cap rate, NOI & submarket benchmark
Implied cap rate vs Fenton submarket · NOI estimate · Typical band, median & reading
Implied cap rate, NOI & submarket benchmark
Cap vs Fenton submarket · NOI estimate · typical band, median & reading
Refine your cap rate
8-question underwriting flow
1.
Property current status — Going-In vs Stabilized
2.
Price for denominator — asking / offer / market
3.
Leasing status & lease structure (NNN / Gross)
4.
Tenant risk profile & vacancy assumption
5.
Upload T12 / rent roll / OM (optional)
Refine in 60 seconds, get exact suggested price
T12 upload · Submarket benchmarks · Sensitivity grid
Suggested price · 3 cap rate anchors
Income approach @ 5% / 7% / 9% — aggressive / typical / conservative
Suggested price at 5% / 7% / 9% cap
Aggressive / typical / conservative · Implied $/SF per anchor · Sensitivity grid
Suggested price at 5% / 7% / 9% cap
Aggressive / typical / conservative · implied $/SF · sensitivity
Value
AI, CAP & Alternative Use estimations · Realmo proprietary blendValue Estimations
Based on Realmo’s proprietary methodology
AI Approach
Method
Estimation
Statistic approach
by Request
ML approach
$11,560,000
CAP Approach
CAP Return
Estimation
6%
$15,050,000
6.5%
$13,890,000
7%
$12,900,000
Alternative Use
Use
Estimation
RESTAURANT
$21,880,000
Change: +199% · Conversion: Easy
AUTO REPAIR, GARAGE
$9,540,000
Change: +30% · Conversion: Difficult
OFFICE BUILDING
$9,515,000
Change: +30% · Conversion: Easy
Blend value · Realmo final
$13.99M
Range $12.59M – $15.38M · ±10% · vs last sale $15.25M (Jan 27 2020)
Last sale anchor
$15.25M
Jan 27 2020
Realmo estimate · informational only.
These numbers are calculated by our models from public records and may not reflect actual market value.
Not an appraisal.
Verify with a licensed appraiser before transacting. Realmo accepts no liability for divergence from real-world outcomes.
View the full estimation — every method, every assumption
Confidence drivers & risk notes · Custom comparable set · Free for first 3 / day
Full estimation methodology
Every method · every assumption · confidence drivers
Price per SF
Sale + rent benchmarks
Subject property
$208 / SF
Submarket sale & rent benchmarks
Median sale $/SF · Asking & closed rent · Submarket vacancy
Submarket sale & rent benchmarks
Median sale $/SF · asking & closed rent · submarket vacancy
Property tax & assessments
Tax year 2023Property tax & assessments
Tax year 2023
Tax billed
$130,053
Tax year 2023
Assessed value
$1,401,600
Assessed 2023
Previous assessed
$918,850
+52.5% YoY
Effective rate
9.28%
On assessed value
Assessed land
$272,100
Assessed improvement
$1,129,500
Land market value
$850,300
Improvement market value
$3,529,700
Total market value
$4,380,000
Applied tax rate
110.0000
Comparables
6 recent transactions · within 1.5 miComparable in this city
6 recent transactions
Comparable in this City


Similar Nearby for Sale


Similar Nearby for Lease


Recent comparable sales
Sale price & price/SF · Sale date & distance · Adjustments & confidence
Recent comparable sales
Sale price & $/SF · sale date & distance · adjustments
Property description
Physical attributes from public recordsBuilding & lot
Public records
Property type
Retail space
Use group
RETAIL STORES (PERSONAL SERVICES)
Status
Off-Market
Year built
2000
Heating
CENTRAL
Cooling
CENTRAL
Stories
2
Rooms
11
Total area
67,126 SF
Lot
4.88 ac (212,573 SF)
Zoning code
21BP-3
APN
26O-1-1-005-3
UPID
US48-0737112
Jurisdiction
ST LOUIS
Zoning & alternative use
21BP-3 · Fenton, MO
Zoning 21BP-3 · permitted uses
21BP-3 · Fenton, MO
Permitted & conditional uses
Allowed uses · Special-permit conditions · Prohibited uses
Permitted & conditional uses
Allowed · special-permit conditions · prohibited
Fenton. Always verify with local authorities before improvements.
Alternative use value scenarios
Repositioning upside vs current use
RESTAURANT
Est. value
$21.9M
AUTO REPAIR, GARAGE
Est. value
$9.5M
OFFICE BUILDING
Est. value
$9.5M
RESTAURANT
AUTO REPAIR, GARAGE
OFFICE BUILDING
Alternative use deep dive — conversion cost, permits, timeline
Conversion cost estimate · Permit path & risks · Stabilized NOI per option
Alternative use deep dive
Conversion cost · permit path · stabilized NOI per option
Building & site characteristics
From public records
Year built
2000
Heating
CENTRAL
Cooling
Yes
Stories
2
Rooms
11
Lot
4.88 ac
Current owner
From public records · entity-resolved
St Louis Indl Portfolio LLC
Entity
Mailing address
9015 MTN RDG DR STE #350, AUSTIN, TX 78759-8487
Ownership since
2020
Owner contacts — direct phone, email, and related entities
Decision-maker phone · Verified email · Related entities & filings
Owner contacts
Email · phone · related entities
Sales History
3 recorded events · public records
Date
Price
Buyer
Seller
Deed Type
Mortgage
Jan 27, 2020
$15,245,000
St Louis Indl Portfolio LLC
Altus Industrial LLC
Grant Deed
$12,873,750 · Dbr Invs Co Ltd
Dec 12, 2014
$2,712,274
Altus Industrial LLC
Bakewell Investment Co
Grant Deed
—
—
—
Altus Industrial LLC
—
Loan Modification
related
$22,500,000 · Miscellaneous Ins Co
Coming soon
Costs & Benchmarks
Operating expenses, capex projections, utility benchmarks, and submarket comparables — all in one view.
Coming soon
Risks
Flood, climate, environmental, title, and tenant-concentration risk — surfaced with mitigations and source citations.
Try Rey
Ask anything about this address in plain English.
“Is 15.6% cap rate sustainable?” · “Best tenant mix for BU1?” · “What’s the redev upside?”
You own 909 Horan Dr?
List it free. Reach 20,000 daily buyers.
We’ve already pulled the facts. Confirm photos + price and you’re live in 2 minutes.
List this address →
Full reports are paid
Unlock the full Property Analytics report
Start free for 7 days — no card required. Full owner contacts, all 4 valuations with methodology, refine flow, comparable adjustments, foot-traffic deep dive, export to PDF / CSV.


