
New search
Property profile & analytics
OFF-MARKET
Estimated value
$4,215,000
Strip malls
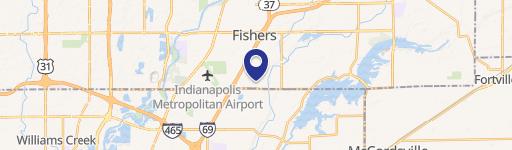
8958 96th St, Fishers, IN 46037-9648
Entity Owned
3-yr Hold
Absentee Owner
~
Est. High Equity
Property ID
US31-1290009
Property profile
Verified
Property type
Strip malls
Use group
SHOPPING CENTER, STRIP CENTER
Year built
1999
Construction
TYPE NOT SPECIFIED
Total area
15,730 SF
Lot
1.63 ac (71,003 SF)
APN
29-15-07-000-016.015-006
UPID
US31-1290009
Cap rate & NOI
Priority signal for investors
Implied cap rate, NOI & suggested price
Cap rate vs submarket · NOI estimate · 3 price anchors
Implied cap rate, NOI & suggested price
Cap vs submarket · NOI estimate · 3 price anchors
Current use
Occupant on record · Public records
-
CrossFit Fishers Gym & Fitness Center
-
garagedoorsrepairfishersin HVAC Service General Contractor
Value estimations
Realmo proprietary · 4 methods
AI Approach
AI
$4.29M
CAP Approach
CAP
$4.10M
Comparable Approach
Comparable
$4.34M
Blend (final)
Blend
$4.22M
Owner & transaction history
Noc Pine Creek LLC · 3 yrs held
Noc Pine Creek LLC
since 2022
Last sale
$3.3M
7 recorded transactions
Zoning & alternative use
Permitted uses
Permitted uses
Allowed · conditional · prohibited
Cap rate
Implied · in-place · derived from last sale + estimated NOI
Implied Cap rate
#1
Implied · in-place · NOI ÷ last sale
In-place · derived from last sale + estimated NOI
Cap rate, NOI & submarket benchmark
Implied cap rate vs Fishers submarket · NOI estimate · Typical band, median & reading
Implied cap rate, NOI & submarket benchmark
Cap vs Fishers submarket · NOI estimate · typical band, median & reading
Refine your cap rate
8-question underwriting flow
1.
Property current status — Going-In vs Stabilized
2.
Price for denominator — asking / offer / market
3.
Leasing status & lease structure (NNN / Gross)
4.
Tenant risk profile & vacancy assumption
5.
Upload T12 / rent roll / OM (optional)
Refine in 60 seconds, get exact suggested price
T12 upload · Submarket benchmarks · Sensitivity grid
Suggested price · 3 cap rate anchors
Income approach @ 5% / 7% / 9% — aggressive / typical / conservative
Suggested price at 5% / 7% / 9% cap
Aggressive / typical / conservative · Implied $/SF per anchor · Sensitivity grid
Suggested price at 5% / 7% / 9% cap
Aggressive / typical / conservative · implied $/SF · sensitivity
Value
AI, CAP & Alternative Use estimations · Realmo proprietary blendValue Estimations
Based on Realmo’s proprietary methodology
AI Approach
Method
Estimation
Statistic approach
$4,150,000
ML approach
$4,285,000
CAP Approach
CAP Return
Estimation
6%
$4,435,000
6.5%
$4,095,000
7%
$3,800,000
Blend value · Realmo final
$4.22M
Range $3.79M – $4.64M · ±10% · vs last sale $3.28M (Dec 16 2022)
Last sale anchor
$3.28M
Dec 16 2022
Realmo estimate · informational only.
These numbers are calculated by our models from public records and may not reflect actual market value.
Not an appraisal.
Verify with a licensed appraiser before transacting. Realmo accepts no liability for divergence from real-world outcomes.
View the full estimation — every method, every assumption
Confidence drivers & risk notes · Custom comparable set · Free for first 3 / day
Full estimation methodology
Every method · every assumption · confidence drivers
Price per SF
Sale + rent benchmarks
Subject property
$268 / SF
Submarket sale & rent benchmarks
Median sale $/SF · Asking & closed rent · Submarket vacancy
Submarket sale & rent benchmarks
Median sale $/SF · asking & closed rent · submarket vacancy
Property tax & assessments
Tax year 2023Property tax & assessments
Tax year 2023
Tax billed
$42,395
Tax year 2023
Assessed value
$1,926,100
Assessed 2023
Previous assessed
$1,926,100
+0.0% YoY
Effective rate
2.20%
On assessed value
Assessed land
$815,000
Assessed improvement
$1,111,100
Land market value
$815,000
Improvement market value
$1,111,100
Total market value
$1,926,100
Applied tax rate
6.0000
Comparables
6 recent transactions · within 1.5 miComparable in this city
6 recent transactions
Comparable in this City


Similar Nearby for Sale


Similar Nearby for Lease


Recent comparable sales
Sale price & price/SF · Sale date & distance · Adjustments & confidence
Recent comparable sales
Sale price & $/SF · sale date & distance · adjustments
Property description
Physical attributes from public recordsBuilding & lot
Public records
Property type
Strip malls
Use group
SHOPPING CENTER, STRIP CENTER
Status
Off-Market
Year built
1999
Construction
TYPE NOT SPECIFIED
Heating
NONE
Stories
1
Units
8
Total area
15,730 SF
Lot
1.63 ac (71,003 SF)
APN
29-15-07-000-016.015-006
UPID
US31-1290009
Jurisdiction
HAMILTON
Zoning & alternative use
Zoning · permitted uses
Permitted & conditional uses
Allowed uses · Special-permit conditions · Prohibited uses
Permitted & conditional uses
Allowed · special-permit conditions · prohibited
Building & site characteristics
From public records
Year built
1999
Construction
TYPE NOT SPECIFIED
Heating
NONE
Stories
1
Units
8
Lot
1.63 ac
Current owner
From public records · entity-resolved
Noc Pine Creek LLC
Entity
Mailing address
7520 E 88TH PL, INDIANAPOLIS, IN 46256-1253
Mailing matches property
Different — outreach signal
Owner-occupied
No
Ownership since
2022
Owner contacts — direct phone, email, and related entities
Decision-maker phone · Verified email · Related entities & filings
Owner contacts
Email · phone · related entities
Sales History
7 recorded events · public records
Date
Price
Buyer
Seller
Deed Type
Mortgage
Dec 16, 2022
$3,275,000
Noc Pine Creek LLC
Vamoz Ltd
Limited Warranty Deed
—
Oct 26, 2022
—
Vamoz Ltd
—
Deed
related
$7,628,282 · Golden Bank NA
Feb 28, 2018
$2,825,000
Vamoz Ltd
Pine Creek On 96th Street LLC
Grant Deed
—
Sep 5, 2013
—
Kglg Real Estate LLC
—
Trustees Deed
related
$700,000 · First Merchants Bank NA
Aug 15, 2013
$1,470,100
Pine Creek On 96th Street LLC
Wells Fargo Series 2005-1
Warranty Deed
—
Dec 9, 2004
—
Pine Tree Indiana LLC
F C Realty Seven LLC
Grant Deed
related
—
—
—
Pine Creek On 96th Street LLC
—
Deed Of Trust
related
$1,500,000 · Miscellaneous Ins Co
Coming soon
Costs & Benchmarks
Operating expenses, capex projections, utility benchmarks, and submarket comparables — all in one view.
Coming soon
Risks
Flood, climate, environmental, title, and tenant-concentration risk — surfaced with mitigations and source citations.
Try Rey
Ask anything about this address in plain English.
“Is 15.6% cap rate sustainable?” · “Best tenant mix for BU1?” · “What’s the redev upside?”
You own 8958 96th St?
List it free. Reach 20,000 daily buyers.
We’ve already pulled the facts. Confirm photos + price and you’re live in 2 minutes.
List this address →
Full reports are paid
Unlock the full Property Analytics report
Start free for 7 days — no card required. Full owner contacts, all 4 valuations with methodology, refine flow, comparable adjustments, foot-traffic deep dive, export to PDF / CSV.


