
New search
Property profile & analytics
OFF-MARKET
Estimated value
$3,665,000
Manufacturing properties
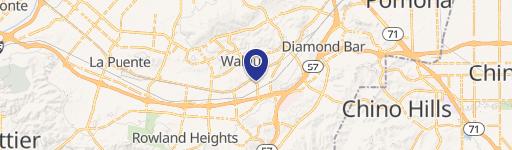
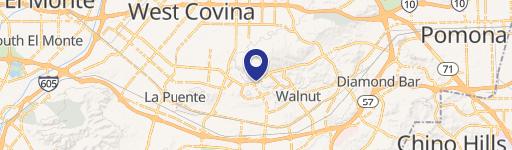
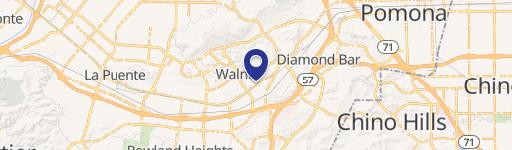
803 Tucker Ln, City Of Industry, CA 91789-2914
Entity Owned
4-yr Hold
~
Est. High Equity
Property ID
US10-0368362
Property profile
Verified
Property type
Manufacturing properties
Use group
MANUFACTURING (LIGHT)
Year built
1974
Construction
TILT-UP CONCRETE
Total area
29,240 SF
Lot
1.29 ac (56,244 SF)
Zoning code
IDM*
APN
8760-014-007
UPID
US10-0368362
Cap rate & NOI
Priority signal for investors
Implied cap rate, NOI & suggested price
Cap rate vs submarket · NOI estimate · 3 price anchors
Implied cap rate, NOI & suggested price
Cap vs submarket · NOI estimate · 3 price anchors
Value estimations
Realmo proprietary · 4 methods
AI Approach
AI
$3.39M
CAP Approach
CAP
by Request
Comparable Approach
Comparable
by Request
Blend (final)
Blend
$3.67M
Owner & transaction history
Tucker 803 LLC · 4 yrs held
Tucker 803 LLC
since 2022
Last sale
$3.9M
7 recorded transactions
Zoning & alternative use
IDM* · City Of Industry, CA
Permitted uses
Permitted uses
Allowed · conditional · prohibited
Cap rate
Implied · in-place · derived from last sale + estimated NOI
Implied Cap rate
#1
Implied · in-place · NOI ÷ last sale
In-place · derived from last sale + estimated NOI
Cap rate, NOI & submarket benchmark
Implied cap rate vs City Of Industry submarket · NOI estimate · Typical band, median & reading
Implied cap rate, NOI & submarket benchmark
Cap vs City Of Industry submarket · NOI estimate · typical band, median & reading
Refine your cap rate
8-question underwriting flow
1.
Property current status — Going-In vs Stabilized
2.
Price for denominator — asking / offer / market
3.
Leasing status & lease structure (NNN / Gross)
4.
Tenant risk profile & vacancy assumption
5.
Upload T12 / rent roll / OM (optional)
Refine in 60 seconds, get exact suggested price
T12 upload · Submarket benchmarks · Sensitivity grid
Suggested price · 3 cap rate anchors
Income approach @ 5% / 7% / 9% — aggressive / typical / conservative
Suggested price at 5% / 7% / 9% cap
Aggressive / typical / conservative · Implied $/SF per anchor · Sensitivity grid
Suggested price at 5% / 7% / 9% cap
Aggressive / typical / conservative · implied $/SF · sensitivity
Value
AI, CAP & Alternative Use estimations · Realmo proprietary blendValue Estimations
Based on Realmo’s proprietary methodology
AI Approach
Method
Estimation
Statistic approach
$3,420,000
ML approach
$3,385,000
CAP Approach
CAP Return
Estimation
6%
by Request
6.5%
by Request
7%
by Request
Blend value · Realmo final
$3.67M
Range $3.30M – $4.03M · ±10% · vs last sale $3.93M (Feb 9 2022)
Last sale anchor
$3.93M
Feb 9 2022
Realmo estimate · informational only.
These numbers are calculated by our models from public records and may not reflect actual market value.
Not an appraisal.
Verify with a licensed appraiser before transacting. Realmo accepts no liability for divergence from real-world outcomes.
View the full estimation — every method, every assumption
Confidence drivers & risk notes · Custom comparable set · Free for first 3 / day
Full estimation methodology
Every method · every assumption · confidence drivers
Price per SF
Sale + rent benchmarks
Subject property
$125 / SF
Submarket sale & rent benchmarks
Median sale $/SF · Asking & closed rent · Submarket vacancy
Submarket sale & rent benchmarks
Median sale $/SF · asking & closed rent · submarket vacancy
Property tax & assessments
Tax year 2024Property tax & assessments
Tax year 2024
Tax billed
$60,485
Tax year 2024
Assessed value
$4,624,762
Assessed 2024
Previous assessed
$4,624,762
+0.0% YoY
Effective rate
1.31%
On assessed value
Assessed land
$2,592,224
Assessed improvement
$2,032,538
Applied tax rate
9.0000
Comparables
6 recent transactions · within 1.5 miComparable in this city
6 recent transactions
Comparable in this City


Similar Nearby for Sale

Similar Nearby for Lease


Recent comparable sales
Sale price & price/SF · Sale date & distance · Adjustments & confidence
Recent comparable sales
Sale price & $/SF · sale date & distance · adjustments
Property description
Physical attributes from public recordsBuilding & lot
Public records
Property type
Manufacturing properties
Use group
MANUFACTURING (LIGHT)
Status
Off-Market
Year built
1974
Construction
TILT-UP CONCRETE
Heating
NONE
Stories
1
Total area
29,240 SF
Lot
1.29 ac (56,244 SF)
Zoning code
IDM*
APN
8760-014-007
UPID
US10-0368362
Jurisdiction
LOS ANGELES
Metro division
LOS ANGELES-LONG BEACH-GLENDALE, CA METROPOLITAN DIVISION
Zoning & alternative use
IDM* · City Of Industry, CA
Zoning IDM* · permitted uses
IDM* · City Of Industry, CA
Permitted & conditional uses
Allowed uses · Special-permit conditions · Prohibited uses
Permitted & conditional uses
Allowed · special-permit conditions · prohibited
City Of Industry. Always verify with local authorities before improvements.
Building & site characteristics
From public records
Year built
1974
Construction
TILT-UP CONCRETE
Heating
NONE
Stories
1
Lot
1.29 ac
Current owner
From public records · entity-resolved
Tucker 803 LLC
Entity
Mailing address
803 TUCKER LN, CITY OF INDUSTRY, CA 91789-2914
Mailing matches property
Yes
Owner-occupied
Yes
Ownership since
2022
Owner contacts — direct phone, email, and related entities
Decision-maker phone · Verified email · Related entities & filings
Owner contacts
Email · phone · related entities
Sales History
8 recorded events · public records
Date
Price
Buyer
Seller
Deed Type
Mortgage
Feb 9, 2022
—
Tucker 803 LLC
Tucker Association LLC
Intrafamily Transfer
related
—
Jun 29, 2018
—
Tucker Association LLC
—
Deed
related
$3,000,000 · Zb NA
Feb 10, 2015
$3,925,000
Tucker Association LLC
Ann Carter
Grant Deed
$3,336,000 · First General Bank
Jan 23, 2008
—
Ann Carter
Desert Crest LLC
Grant Deed
$2,875,000 · Community Bank
Jun 20, 2006
—
Desert Crest LLC
1240 Palmetto LLC
Grant Deed
$1,022,500 · Cates Family Trust
Jul 23, 2002
—
1240 Palmetto LLC
Munco INC
Grant Deed
$2,475,000 · Foothill Independent Bank
Dec 21, 1994
—
Munco
Munzer,r J & D A
Quit Claim Deed
related
—
—
—
Munco INC
—
Deed Of Trust
related
$1,250,000 · Wells Fargo Bank
Coming soon
Costs & Benchmarks
Operating expenses, capex projections, utility benchmarks, and submarket comparables — all in one view.
Coming soon
Risks
Flood, climate, environmental, title, and tenant-concentration risk — surfaced with mitigations and source citations.
Try Rey
Ask anything about this address in plain English.
“Is 15.6% cap rate sustainable?” · “Best tenant mix for BU1?” · “What’s the redev upside?”
You own 803 Tucker Ln?
List it free. Reach 20,000 daily buyers.
We’ve already pulled the facts. Confirm photos + price and you’re live in 2 minutes.
List this address →
Full reports are paid
Unlock the full Property Analytics report
Start free for 7 days — no card required. Full owner contacts, all 4 valuations with methodology, refine flow, comparable adjustments, foot-traffic deep dive, export to PDF / CSV.


