
New search
Property profile & analytics
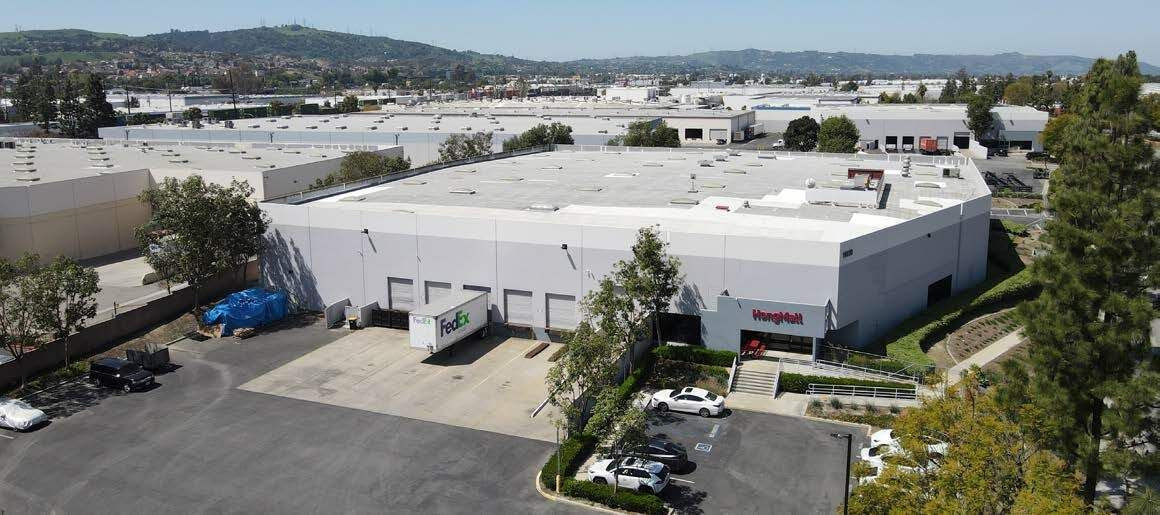
FOR LEASE
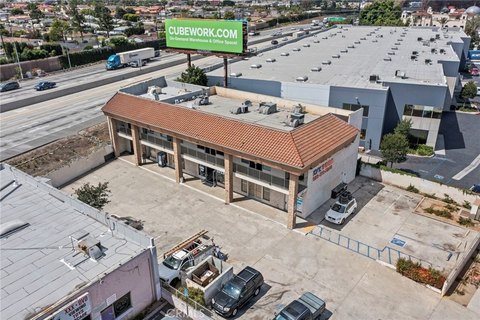
Warehouses
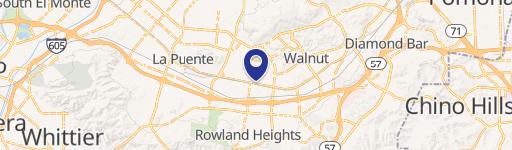
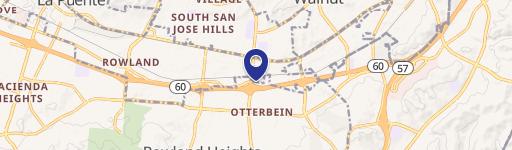
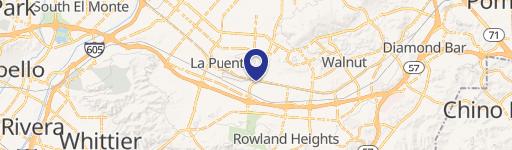
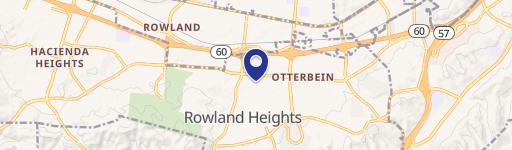
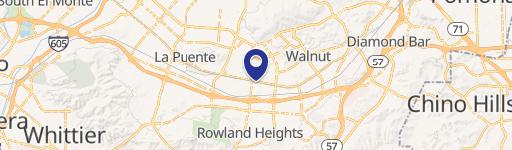
City Of, Rowland Heights, CA 91748
Entity Owned
~
Est. High Equity
Property ID
US10-0368397
 For Lease
1 / 2
For Lease
1 / 2
$1.40 SF/Yr
City Of, Rowland Heights, CA 91748
View Listing →
Property profile
Verified
Property type
Warehouses
Use group
WAREHOUSE, STORAGE
Year built
1996
Construction
TILT-UP CONCRETE
Total area
49,828 SF
Lot
2.88 ac (125,347 SF)
Zoning code
IDM*
APN
8264-020-024
UPID
US10-0368397
Cap rate & NOI
Priority signal for investors
Implied cap rate, NOI & suggested price
Cap rate vs submarket · NOI estimate · 3 price anchors
Implied cap rate, NOI & suggested price
Cap vs submarket · NOI estimate · 3 price anchors
Value estimations
Realmo proprietary · 4 methods
AI Approach
AI
by Request
CAP Approach
CAP
$9.98M
Comparable Approach
Comparable
$19.46M
Blend (final)
Blend
$15.24M
Owner & transaction history
Life Guard Group LLC
Life Guard Group LLC
since 2025
Last sale
$15.8M
7 recorded transactions
Zoning & alternative use
IDM* · City Of Industry, CA
Permitted uses
Permitted uses
Allowed · conditional · prohibited
Top alternative use upside
Restaurant
$24.6M
+76.1%
Medical building
$22.7M
+62.3%
Auto repair, garage
$19.5M
+39.4%
Cap rate
Implied · in-place · derived from last sale + estimated NOI
Implied Cap rate
#1
Implied · in-place · NOI ÷ last sale
In-place · derived from last sale + estimated NOI
Cap rate, NOI & submarket benchmark
Implied cap rate vs Rowland Heights submarket · NOI estimate · Typical band, median & reading
Implied cap rate, NOI & submarket benchmark
Cap vs Rowland Heights submarket · NOI estimate · typical band, median & reading
Refine your cap rate
8-question underwriting flow
1.
Property current status — Going-In vs Stabilized
2.
Price for denominator — asking / offer / market
3.
Leasing status & lease structure (NNN / Gross)
4.
Tenant risk profile & vacancy assumption
5.
Upload T12 / rent roll / OM (optional)
Refine in 60 seconds, get exact suggested price
T12 upload · Submarket benchmarks · Sensitivity grid
Suggested price · 3 cap rate anchors
Income approach @ 5% / 7% / 9% — aggressive / typical / conservative
Suggested price at 5% / 7% / 9% cap
Aggressive / typical / conservative · Implied $/SF per anchor · Sensitivity grid
Suggested price at 5% / 7% / 9% cap
Aggressive / typical / conservative · implied $/SF · sensitivity
Value
AI, CAP & Alternative Use estimations · Realmo proprietary blendValue Estimations
Based on Realmo’s proprietary methodology
AI Approach
Method
Estimation
Statistic approach
by Request
ML approach
by Request
CAP Approach
CAP Return
Estimation
6%
$10,805,000
6.5%
$9,975,000
7%
$9,260,000
Alternative Use
Use
Estimation
WAREHOUSE, STORAGE
$13,955,000
Current use
RESTAURANT
$24,580,000
Change: +76% · Conversion: Difficult
MEDICAL BUILDING
$22,650,000
Change: +62% · Conversion: Difficult
AUTO REPAIR, GARAGE
$19,450,000
Change: +39% · Conversion: Easy
NEIGHBORHOOD: SHOPPING CENTER
$18,055,000
Change: +29% · Conversion: Moderate
OFFICE BUILDING
$15,320,000
Change: +10% · Conversion: Difficult
RETAIL STORES
$14,590,000
Change: +5% · Conversion: Moderate
INDUSTRIAL (GENERAL)
$12,615,000
Change: -10% · Conversion: Easy
Blend value · Realmo final
$15.24M
Range $13.71M – $16.76M · ±10% · vs last sale $15.75M (Jun 19 2025)
Last sale anchor
$15.75M
Jun 19 2025
Realmo estimate · informational only.
These numbers are calculated by our models from public records and may not reflect actual market value.
Not an appraisal.
Verify with a licensed appraiser before transacting. Realmo accepts no liability for divergence from real-world outcomes.
View the full estimation — every method, every assumption
Confidence drivers & risk notes · Custom comparable set · Free for first 3 / day
Full estimation methodology
Every method · every assumption · confidence drivers
Price per SF
Sale + rent benchmarks
Subject property
$306 / SF
Submarket sale & rent benchmarks
Median sale $/SF · Asking & closed rent · Submarket vacancy
Submarket sale & rent benchmarks
Median sale $/SF · asking & closed rent · submarket vacancy
Property tax & assessments
Tax year 2024Property tax & assessments
Tax year 2024
Tax billed
$117,122
Tax year 2024
Assessed value
$8,924,150
Assessed 2024
Previous assessed
$8,924,150
+0.0% YoY
Effective rate
1.31%
On assessed value
Assessed land
$5,923,405
Assessed improvement
$3,000,745
Applied tax rate
16.0000
Comparables
6 recent transactions · within 1.5 miComparable in this city
6 recent transactions
Comparable in this City
Similar Nearby for Sale


Similar Nearby for Lease


Recent comparable sales
Sale price & price/SF · Sale date & distance · Adjustments & confidence
Recent comparable sales
Sale price & $/SF · sale date & distance · adjustments
Property description
Physical attributes from public recordsBuilding & lot
Public records
Property type
Warehouses
Use group
WAREHOUSE, STORAGE
Status
For Lease
Year built
1996
Construction
TILT-UP CONCRETE
Heating
NONE
Stories
1
Units
1
Bathrooms
1
Total area
49,828 SF
Lot
2.88 ac (125,347 SF)
Zoning code
IDM*
APN
8264-020-024
UPID
US10-0368397
Jurisdiction
LOS ANGELES
Metro division
LOS ANGELES-LONG BEACH-GLENDALE, CA METROPOLITAN DIVISION
Zoning & alternative use
IDM* · City Of Industry, CA
Zoning IDM* · permitted uses
IDM* · City Of Industry, CA
Permitted & conditional uses
Allowed uses · Special-permit conditions · Prohibited uses
Permitted & conditional uses
Allowed · special-permit conditions · prohibited
City Of Industry. Always verify with local authorities before improvements.
Alternative use value scenarios
Repositioning upside vs current use
WAREHOUSE, STORAGE Current
Est. value
$14.0M
RESTAURANT
Est. value
$24.6M
MEDICAL BUILDING
Est. value
$22.7M
AUTO REPAIR, GARAGE
Est. value
$19.5M
NEIGHBORHOOD: SHOPPING CENTER
Est. value
$18.1M
OFFICE BUILDING
Est. value
$15.3M
RETAIL STORES
Est. value
$14.6M
INDUSTRIAL (GENERAL)
Est. value
$12.6M
WAREHOUSE, STORAGE Current
RESTAURANT
MEDICAL BUILDING
AUTO REPAIR, GARAGE
NEIGHBORHOOD: SHOPPING CENTER
OFFICE BUILDING
RETAIL STORES
INDUSTRIAL (GENERAL)
Alternative use deep dive — conversion cost, permits, timeline
Conversion cost estimate · Permit path & risks · Stabilized NOI per option
Alternative use deep dive
Conversion cost · permit path · stabilized NOI per option
Building & site characteristics
From public records
Year built
1996
Construction
TILT-UP CONCRETE
Heating
NONE
Stories
1
Units
1
Bathrooms
1
Lot
2.88 ac
Current owner
From public records · entity-resolved
Life Guard Group LLC
Entity
Mailing address
PO BOX A3879, CHICAGO, IL 60690-3879
Ownership since
2025
Owner contacts — direct phone, email, and related entities
Decision-maker phone · Verified email · Related entities & filings
Owner contacts
Email · phone · related entities
Sales History
14 recorded events · public records
Date
Price
Buyer
Seller
Deed Type
Mortgage
Sep 19, 2025
$15,750,000
Life Guard Group LLC
Shiraz Fullerton 89 LP
Grant Deed
$10,000,000 · City National Bank
Mar 2, 2022
—
Bpp Shiraz Park A LP
—
Deed
related
$187,000,000 · Tiaa Fsb Holdings INC
Nov 16, 2020
—
Bpp Shiraz Park A LP
—
Deed
related
$177,000,000 · Miscellaneous Ins Co
Feb 12, 2019
—
Bpp Shiraz Park A LP
—
Grant Deed
related
$177,000,000 · Miscellaneous Ins Co
Oct 6, 2017
$11,135,000
Bpp Shiraz Fullerton 89 LP
Fullerton I-c LLC
Grant Deed
related
$3,300,000 · Miscellaneous Ins Co
Sep 18, 2017
$4,172,000
Fullerton Sub C Exchange LLC
Majestic-fullerton Road LLC
Grant Deed
—
Sep 18, 2017
—
Fullerton I-c LLC
—
Deed
related
$3,300,000 · Miscellaneous Ins Co
Nov 13, 2009
—
Majestic-fullerton Road LLC
—
Deed Of Trust
related
$3,300,000 · Prudential Insurance Co
Dec 1, 2005
—
Fullerton I-c LLC
Principal R/e Holding Co LLC
Grant Deed
—
Nov 30, 2005
—
Principal Life Insurance Co
Pfg Fullerton
Grant Deed
—
Oct 28, 2002
—
Majestic-fullerton Road LLC
—
Deed Of Trust
related
$3,350,000 · Prudential Insurance Co
—
—
Majestic Realty Co
—
Deed Of Trust
related
$1,362,000 · Principal Mutual Life Ins
—
—
Fullerton I-c LLC
—
Loan Modification
related
$3,300,000 · Miscellaneous Ins Co
—
—
Bpp Shiraz Park A LP
—
Loan Modification
related
$177,000,000 · Miscellaneous Ins Co
Coming soon
Costs & Benchmarks
Operating expenses, capex projections, utility benchmarks, and submarket comparables — all in one view.
Coming soon
Risks
Flood, climate, environmental, title, and tenant-concentration risk — surfaced with mitigations and source citations.
Try Rey
Ask anything about this address in plain English.
“Is 15.6% cap rate sustainable?” · “Best tenant mix for BU1?” · “What’s the redev upside?”
Full reports are paid
Unlock the full Property Analytics report
Start free for 7 days — no card required. Full owner contacts, all 4 valuations with methodology, refine flow, comparable adjustments, foot-traffic deep dive, export to PDF / CSV.


