
New search
Property profile & analytics
OFF-MARKET
Estimated value
$2,965,000
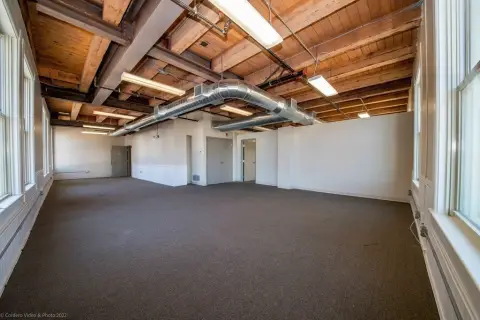
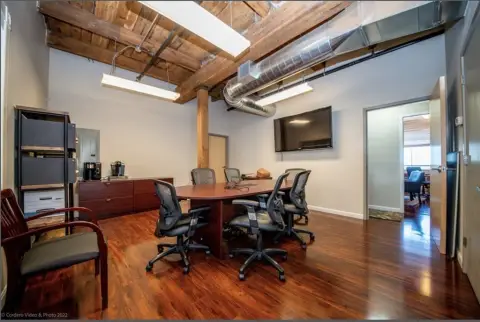
Assisted living facilities
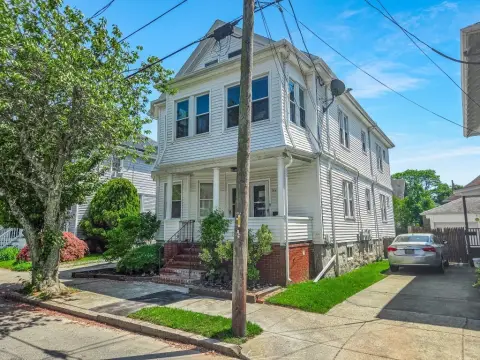
1123 Rockdale Ave, New Bedford, MA 02740-2947
Entity Owned
3-yr Hold
Free & Clear
Property ID
US38-0674277
Property profile
Verified
Property type
Assisted living facilities
Use group
HOMES (RETIRED, NURSING)
Year built
1975
Construction
FRAME
Total area
27,576 SF
Lot
1.21 ac (52,538 SF)
Zoning code
RA
APN
NEWB M:0068 L:0093
UPID
US38-0674277
Cap rate & NOI
Priority signal for investors
Implied cap rate, NOI & suggested price
Cap rate vs submarket · NOI estimate · 3 price anchors
Implied cap rate, NOI & suggested price
Cap vs submarket · NOI estimate · 3 price anchors
Current use
Occupant on record · Public records
-
Amber Seybert Physician
Value estimations
Realmo proprietary · 4 methods
AI Approach
AI
by Request
CAP Approach
CAP
by Request
Comparable Approach
Comparable
$2.48M
Blend (final)
Blend
$2.97M
Owner & transaction history
Tx&ok Funding LLC · 3 yrs held
Tx&ok Funding LLC
since 2022
Last sale
$3.2M
2 recorded transactions
Zoning & alternative use
RA · New Bedford, MA
Permitted uses
Permitted uses
Allowed · conditional · prohibited
Top alternative use upside
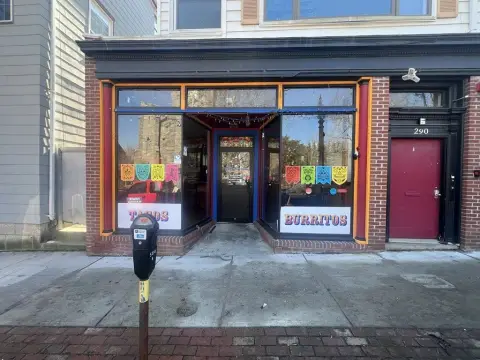
Restaurant
$4.7M
+101.4%
Auto repair, garage
$4.3M
+85.7%
Medical building
$4.1M
+75.8%
Cap rate
Implied · in-place · derived from last sale + estimated NOI
Implied Cap rate
#1
Implied · in-place · NOI ÷ last sale
In-place · derived from last sale + estimated NOI
Cap rate, NOI & submarket benchmark
Implied cap rate vs New Bedford submarket · NOI estimate · Typical band, median & reading
Implied cap rate, NOI & submarket benchmark
Cap vs New Bedford submarket · NOI estimate · typical band, median & reading
Refine your cap rate
8-question underwriting flow
1.
Property current status — Going-In vs Stabilized
2.
Price for denominator — asking / offer / market
3.
Leasing status & lease structure (NNN / Gross)
4.
Tenant risk profile & vacancy assumption
5.
Upload T12 / rent roll / OM (optional)
Refine in 60 seconds, get exact suggested price
T12 upload · Submarket benchmarks · Sensitivity grid
Suggested price · 3 cap rate anchors
Income approach @ 5% / 7% / 9% — aggressive / typical / conservative
Suggested price at 5% / 7% / 9% cap
Aggressive / typical / conservative · Implied $/SF per anchor · Sensitivity grid
Suggested price at 5% / 7% / 9% cap
Aggressive / typical / conservative · implied $/SF · sensitivity
Value
AI, CAP & Alternative Use estimations · Realmo proprietary blendValue Estimations
Based on Realmo’s proprietary methodology
AI Approach
Method
Estimation
Statistic approach
by Request
ML approach
by Request
CAP Approach
CAP Return
Estimation
6%
by Request
6.5%
by Request
7%
by Request
Alternative Use
Use
Estimation
HOMES (RETIRED, HANDICAP, REST, CONVALESCENT, NURSING)
$2,330,000
Current use
RESTAURANT
$4,690,000
Change: +101% · Conversion: Difficult
AUTO REPAIR, GARAGE
$4,325,000
Change: +86% · Conversion: Difficult
MEDICAL BUILDING
$4,095,000
Change: +76% · Conversion: Difficult
RETAIL STORES
$3,835,000
Change: +65% · Conversion: Difficult
COMMERCIAL (GENERAL)
$3,045,000
Change: +31% · Conversion: Difficult
APARTMENT HOUSE (5+ UNITS)
$3,005,000
Change: +29% · Conversion: Difficult
OFFICE BUILDING
$2,840,000
Change: +22% · Conversion: Difficult
Blend value · Realmo final
$2.97M
Range $2.67M – $3.26M · ±10% · vs last sale $3.21M (Dec 28 2022)
Last sale anchor
$3.21M
Dec 28 2022
Realmo estimate · informational only.
These numbers are calculated by our models from public records and may not reflect actual market value.
Not an appraisal.
Verify with a licensed appraiser before transacting. Realmo accepts no liability for divergence from real-world outcomes.
View the full estimation — every method, every assumption
Confidence drivers & risk notes · Custom comparable set · Free for first 3 / day
Full estimation methodology
Every method · every assumption · confidence drivers
Price per SF
Sale + rent benchmarks
Subject property
$108 / SF
Submarket sale & rent benchmarks
Median sale $/SF · Asking & closed rent · Submarket vacancy
Submarket sale & rent benchmarks
Median sale $/SF · asking & closed rent · submarket vacancy
Property tax & assessments
Tax year 2024Property tax & assessments
Tax year 2024
Tax billed
$77,848
Tax year 2024
Assessed value
$3,118,900
Assessed 2024
Previous assessed
$3,118,900
+0.0% YoY
Effective rate
2.50%
On assessed value
Assessed land
$374,300
Assessed improvement
$2,744,600
Comparables
6 recent transactions · within 1.5 miComparable in this city
6 recent transactions
Comparable in this City


Similar Nearby for Sale
Similar Nearby for Lease

Recent comparable sales
Sale price & price/SF · Sale date & distance · Adjustments & confidence
Recent comparable sales
Sale price & $/SF · sale date & distance · adjustments
Property description
Physical attributes from public recordsBuilding & lot
Public records
Property type
Assisted living facilities
Use group
HOMES (RETIRED, NURSING)
Status
Off-Market
Year built
1975
Construction
FRAME
Heating
FORCED AIR
Cooling
YES
Buildings
1
Stories
2
Units
124
Rooms
12
Bathrooms
42
Total area
27,576 SF
Lot
1.21 ac (52,538 SF)
Zoning code
RA
APN
NEWB M:0068 L:0093
UPID
US38-0674277
Jurisdiction
NEW BEDFORD
Zoning & alternative use
RA · New Bedford, MA
Zoning RA · permitted uses
RA · New Bedford, MA
Permitted & conditional uses
Allowed uses · Special-permit conditions · Prohibited uses
Permitted & conditional uses
Allowed · special-permit conditions · prohibited
New Bedford. Always verify with local authorities before improvements.
Alternative use value scenarios
Repositioning upside vs current use
HOMES (RETIRED, HANDICAP, REST, CONVALESCENT, NURSING) Current
Est. value
$2.3M
RESTAURANT
Est. value
$4.7M
AUTO REPAIR, GARAGE
Est. value
$4.3M
MEDICAL BUILDING
Est. value
$4.1M
RETAIL STORES
Est. value
$3.8M
COMMERCIAL (GENERAL)
Est. value
$3.0M
APARTMENT HOUSE (5+ UNITS)
Est. value
$3.0M
OFFICE BUILDING
Est. value
$2.8M
HOMES (RETIRED, HANDICAP, REST, CONVALESCENT, NURSING) Current
RESTAURANT
AUTO REPAIR, GARAGE
MEDICAL BUILDING
RETAIL STORES
COMMERCIAL (GENERAL)
APARTMENT HOUSE (5+ UNITS)
OFFICE BUILDING
Alternative use deep dive — conversion cost, permits, timeline
Conversion cost estimate · Permit path & risks · Stabilized NOI per option
Alternative use deep dive
Conversion cost · permit path · stabilized NOI per option
Building & site characteristics
From public records
Year built
1975
Construction
FRAME
Heating
FORCED AIR
Cooling
Yes
Stories
2
Buildings
1
Units
124
Rooms
12
Bathrooms
42
Lot
1.21 ac
Current owner
From public records · entity-resolved
Tx&ok Funding LLC
Entity
Free & Clear · 3 yrs held
Mailing address
6101 NIMTZ PKWY, SOUTH BEND, IN 46628-6111
Ownership since
2022
Owner contacts — direct phone, email, and related entities
Decision-maker phone · Verified email · Related entities & filings
Owner contacts
Email · phone · related entities
Sales History
2 recorded events · public records
Date
Price
Buyer
Seller
Deed Type
Mortgage
Dec 28, 2022
$2,900,000
Tx&ok Funding LLC
Har Capital LLC
Foreclosure
related
—
Nov 5, 2015
$3,210,000
Har Capital LLC
Ventas Realty LP
Quit Claim Arm's Length For Ne States
$1,500,000 · Congressional Bank
Coming soon
Costs & Benchmarks
Operating expenses, capex projections, utility benchmarks, and submarket comparables — all in one view.
Coming soon
Risks
Flood, climate, environmental, title, and tenant-concentration risk — surfaced with mitigations and source citations.
Try Rey
Ask anything about this address in plain English.
“Is 15.6% cap rate sustainable?” · “Best tenant mix for BU1?” · “What’s the redev upside?”
You own 1123 Rockdale Ave?
List it free. Reach 20,000 daily buyers.
We’ve already pulled the facts. Confirm photos + price and you’re live in 2 minutes.
List this address →
Full reports are paid
Unlock the full Property Analytics report
Start free for 7 days — no card required. Full owner contacts, all 4 valuations with methodology, refine flow, comparable adjustments, foot-traffic deep dive, export to PDF / CSV.


