Nashville, NC Waterfront Land for Sale
Notify Me
List
Map
Roaring River, NC
Rocky Mount, NC
Spring Hope, NC
Castalia, NC
Whitakers, NC
Elm City, NC
Sharpsburg, NC
Bailey, NC
- Roaring River, NC
- Rocky Mount, NC
- Spring Hope, NC
- Castalia, NC
- Whitakers, NC
- Elm City, NC
- Sharpsburg, NC
- Bailey, NC
Realmo
Analytics
Monitor Off-market properties and contact owners who are ready to sell.
Many signals applied to make quality leads for you.
Get Leads

Opportunities in Nearby Cities


Nashville, NC Waterfront Land Market Trends and Statistics
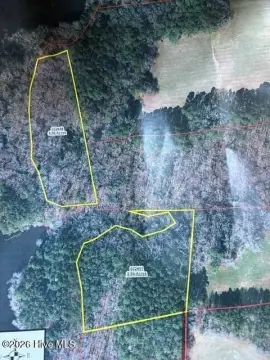
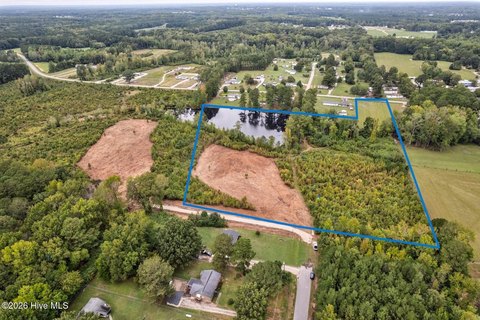
Explore 1 waterfront land for sale in Nashville, NC on our real estate platform. These investment opportunities span a total of 344,124 square feet of properties for sale, with an estimated market value of $320,000.
Sale prices for water rights properties in Nashville, NC average $320,000 — offering options for a variety of budgets and business needs. Daily updated analytics ensure you stay ahead with the latest data and market trends.
List
Map
Top Commercial Asset Segments
Commercial property segments ranked by active listings on the market
Demographics Overview
Population
17K
Population Growth (5Y)
+3.1%
Median Household Income
$66,147
College Educated
29.2%
Taxes & Financing
Tax Rate (average for all types)
0.94%
Property Tax per SF
$24.56 per SF
Tax Rate vs County Average
0.39 pp below county avg
Average Loan-to-Value
65.0%
Listings Trend
New vs delisted commercial listings in Nash County
New
Delisted
Total CRE Inventory on Market (SF)
How Realmo verifies these figures
Need Help?
Reach out if you need assistance with Realmo tools or have questions about your listings