Commercial Real Estate Market in Harriman, TN
Updated monthly: sale, lease, property records, location trend, and more… · Last update: October 31
118 active listings and 586 off-market properties in Harriman, TN. Commercial property asks $18/SF to buy and $15.00/SF/Yr to lease.
Market Trends
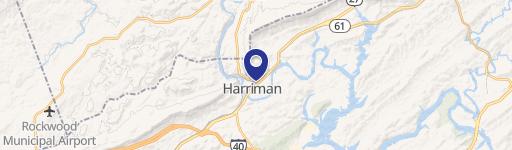
Harriman, TN spans 106.6 square miles in Roane County, Tennessee. Figures below refresh monthly; last updated 31 October 2026.
Office
Office vacancy in Harriman, TN runs 20.2% across the South region in 2025, up from 14.4% in 2019.
Vacancy Rate % in South region
Retail
Retail vacancy in Harriman, TN runs 5.4% across the South region in 2025, down from 7% in 2020.
Vacancy Rate % in South region
Industrial
Industrial vacancy in Harriman, TN runs 7.9% across the South region in 2025, up from 6% in 2019. Nearly 2.3x the 2022 low of 3.5%.
Vacancy Rate % in South region
Multifamily
Multifamily vacancy in Harriman, TN runs 11.3% across the South region in 2025, up from 8.5% in 2022.
Vacancy Rate % in South region
Zoning & Land Use
Land Use Mix share of zoned land by category
- Agricultural 49.5%
- Residential 34.2%
- Commercial 13%
- Industrial 3.2%
- Civic 0.2%
Largest Zones share of zoned land by district
Open Space Park Agriculture District
Low Density Residential
General Commercial District
Medium Density Residential
Light Industrial District
Light Industrial District (I-1)
In order to achieve the purpose and intent of the I-1 Light Industrial District, as shown on the Zoning Map of the City of Harriman, Tennessee, the following regulations apply and uses are permitted: 1. Personal, business and professional services and offices. 33 2. Wholesale trade. 3. Warehouses. 4. Trucking terminals of moderate vehicle size and activities…


Market overview
Demographics & Economy
Harriman, TN has 17,227 residents in 8,208 households. Density runs 162 people per square mile. Median household income here is $58,649 and median gross rent $760 a month.
17,227
Population
8,208
Households
2.1
Avg Household Size
45
Median Age
20%
College-Educated
87%
High-School Grad
106.6 sq mi
ZIP Area
162
Density / Sq Mi
$58,649
Median Household Income
$40,155
Median Earnings
$760
Median Rent
$173,600
Median Home Value
Tools
Nearby Markets
| Market | Average Sale Price, $/SF | Average Lease Price, $/SF/Yr |
|---|---|---|
| Kingston | — | — |
| Oliver Springs | — | — |
| Midtown | — | — |
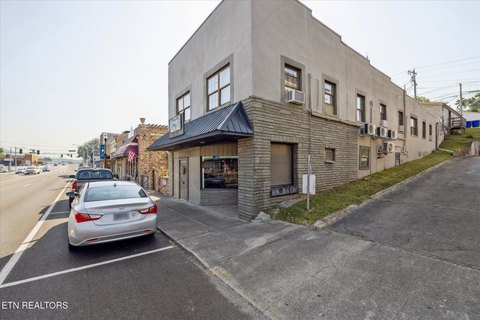
Commercial property in Harriman, TN asks $18/SF.


Frequently Asked Questions
What is the average price per square foot for commercial property in Harriman?
Commercial property in Harriman, TN asks an average of $18 per square foot. The 6 most recent recorded sales traded at a median of $100/SF.
How much does it cost to lease commercial space in Harriman?
Asking lease rates in Harriman, TN average $15.00 per square foot per year.
Where does Realmo's Harriman market data come from?
Realmo compiles Harriman, TN figures from 7 recent recorded sales, 114 active sale listings, 4 active lease listings, 586 tracked off-market properties, the current Harriman zoning release. Sale and lease figures refresh monthly; vacancy annually. Last updated 31 October 2026.
Methodology & data sources
- Asking prices and averages
- Computed from 114 active for-sale and 4 active for-lease listings in Harriman, TN. These are ASKING figures from live listings, not closed-transaction prices, and a segment carried by a handful of listings reads as indicative rather than an average.
- Vacancy rates
- Published per-sector market series, taken at the metro level where one exists and otherwise at the Census-region level — a chart reading "in <region> region" is a regional number, not this city's.
- Zoning and land use
- The current municipal zoning release: 6,743 zoned acres across 10 districts. Shares are of zoned land, so parcels the release leaves unclassified are excluded from the mix.
- Refresh
- The monthly aggregates close at the end of the previous month, so 31 October 2026 — not today — is the honest last update.
- Known limitations
- office vacancy is reported at South region level, retail vacancy is reported at South region level and industrial vacancy is reported at South region level.
- Coverage
- Metrics below the 10-observation threshold fall back one geographic level. The geography used is named on each figure.
Compiled by the Realmo Data team · reviewed 31 October 2026 · How Realmo checks market page data · Report a data issue