Commercial Real Estate Market in Calimesa, CA
Updated monthly: sale, lease, property records, location trend, and more… · Last update: October 31
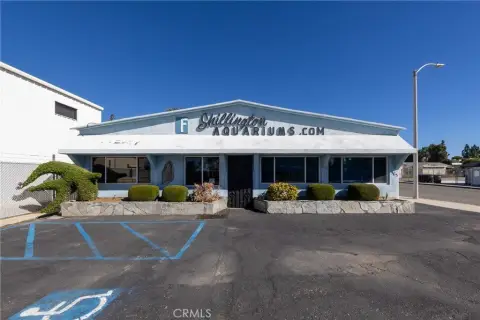
11 active listings and 283 off-market properties in Calimesa, CA.
Market Trends
Calimesa, CA spans 13.9 square miles in Riverside County, California. Figures below refresh monthly; last updated 31 October 2026.
Office
Office vacancy in Calimesa, CA runs 20.8% across the West region in 2025, up from 11% in 2019.
Retail
Retail vacancy in Calimesa, CA runs 5.8% across the West region in 2025, down from 7% in 2020.
Industrial
Industrial vacancy in Calimesa, CA runs 7.9% across the West region in 2025, up from 3.7% in 2019. Nearly 3.2x the 2022 low of 2.5%.
Multifamily
Multifamily vacancy in Calimesa, CA runs 8.6% across the West region in 2025, up from 7% in 2022.
Zoning & Land Use
Land Use Mix share of zoned land by category
- Residential 48.3%
- Commercial 3.5%
- Open space 1.5%
- Industrial 1.1%
- Mixed use 0.7%
Largest Zones share of zoned land by district
B. Residential Estate (R-E) Zone. The zone is intended to provide for the development of single -family detached homes, and buildings and structures related to agriculture, farm use, animal keeping, and equestrian uses. The minimum lot size in this zone is 5 acres. C. Rural Residential (R -R) Zone. The zone is intended to provide for the development of singl…


Market overview
Demographics & Economy
Calimesa, CA has 10,036 residents in 4,156 households. Density runs 720 people per square mile. Median household income here is $90,313 and median gross rent $1,852 a month.
Tools
Nearby Markets
| Market | Median Asking Price, $/SF | Median Asking Rent, $/SF/Yr |
|---|---|---|
| Yucaipa | $383 | $28.30 |
| Redlands | $275 | $15.30 |
Commercial property in Calimesa, CA asks $327/SF. The 2 bordering markets run from $275/SF in Redlands to $383/SF in Yucaipa, and the city sits in line with their $329/SF median.

Frequently Asked Questions
What is the median price per square foot for commercial property in Calimesa?
How does Calimesa compare to nearby markets on price?
Where does Realmo's Calimesa market data come from?
Methodology & data sources
- Asking prices and medians
- There are 8 active for-sale and 3 active for-lease listings in Calimesa, CA. The sale median is based on 4 of the for-sale listings that state a price per square foot; too few for-lease listings state a rent per square foot for a rent median. These are ASKING figures from live listings, not closed-transaction prices, and a figure resting on fewer than 10 listings says so where it is quoted.
- Vacancy rates
- Published per-sector market series, taken at the metro level where one exists and otherwise at the Census-region level — a chart reading "in <region> region" is a regional number, not this city's.
- Zoning and land use
- The current municipal zoning release: 9,361 zoned acres across 21 districts. Shares are of zoned land, so parcels the release leaves unclassified are excluded from the mix.
- Refresh
- The monthly aggregates close at the end of the previous month, so 31 October 2026 — not today — is the honest last update.
- Known limitations
- office vacancy is reported at West region level, retail vacancy is reported at West region level and industrial vacancy is reported at West region level.
- Coverage
- Metrics below the 10-observation threshold fall back one geographic level. The geography used is named on each figure.
Compiled by the Realmo Data team · reviewed 31 October 2026 · How Realmo checks market page data · Report a data issue