Renovated Live-Work
For Sale
$415,000
Wells, ME 04090, Wells, ME 04090
Wells, ME
Property Size1,100 SF
Price / SF$377.27
Days on Market59
Property Features
General Information
Property type
Commercial Sale
Property subtype
Other
Standard status
Active
Size
1,100 SF
Building Details
Year built
1965
Listing Agency:
South Portland, Maine · Better Homes and Gardens Real Estate
(207) 560-4683
Listed By:
Jon Safford
(207) 646-5131
Added: Aug 14
Changed: Sep 22
Last Checked: Oct 11 at 1:06PM
MLS# 1676327
Copyright © 2026 Better Homes and Gardens-The Masiello Group. All rights reserved. All information provided by the listing agent/broker is deemed reliable but is not guaranteed and should be independently verified.
Investment Insights
Based on property information with market context.
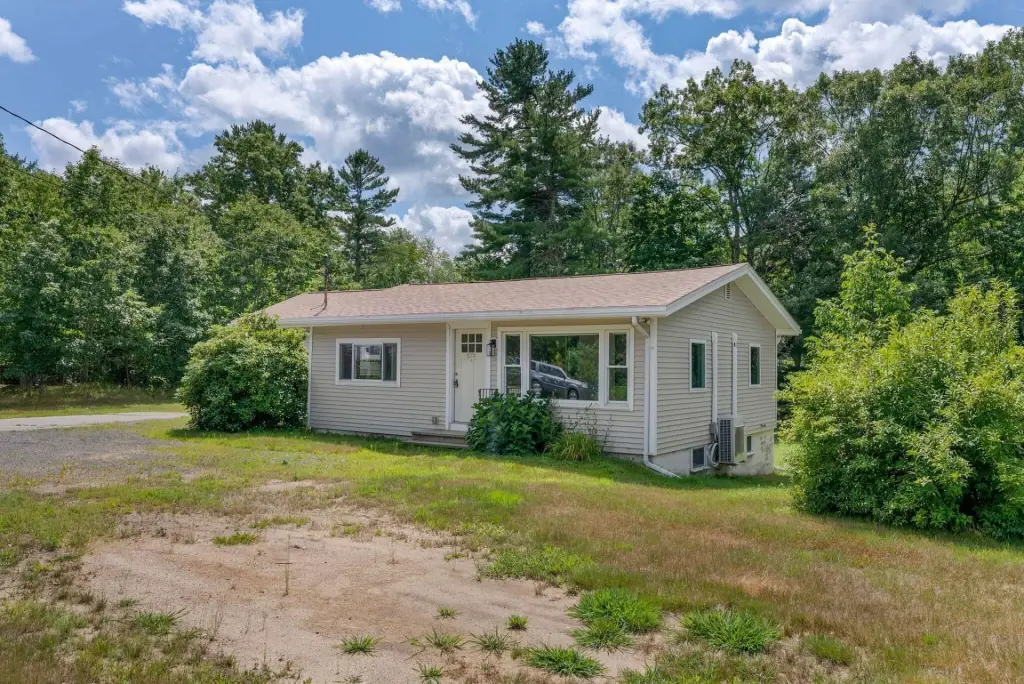
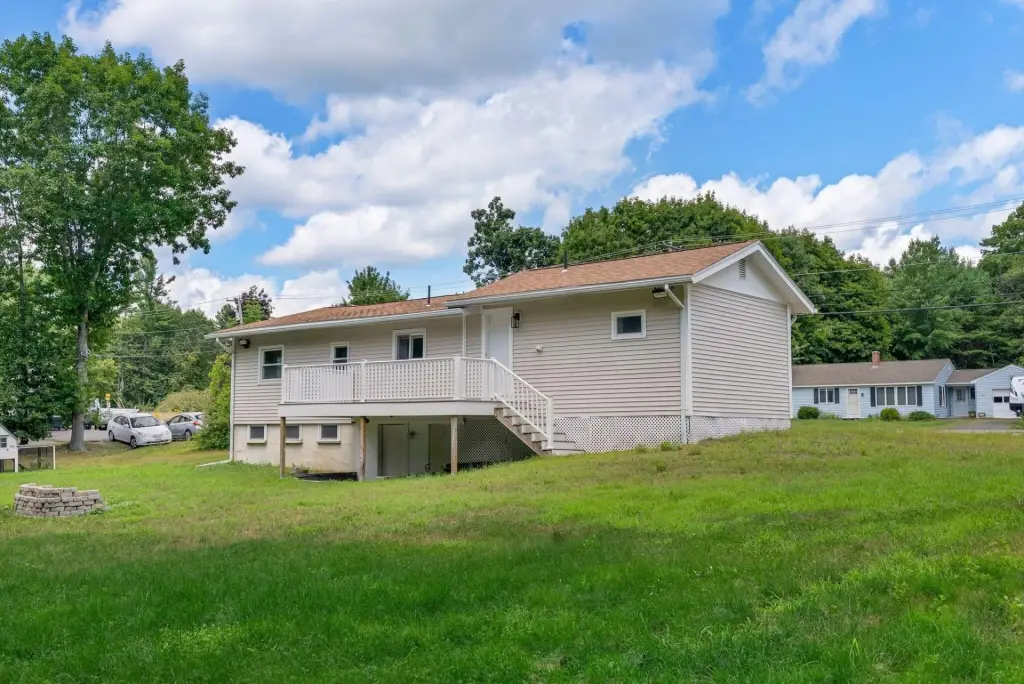
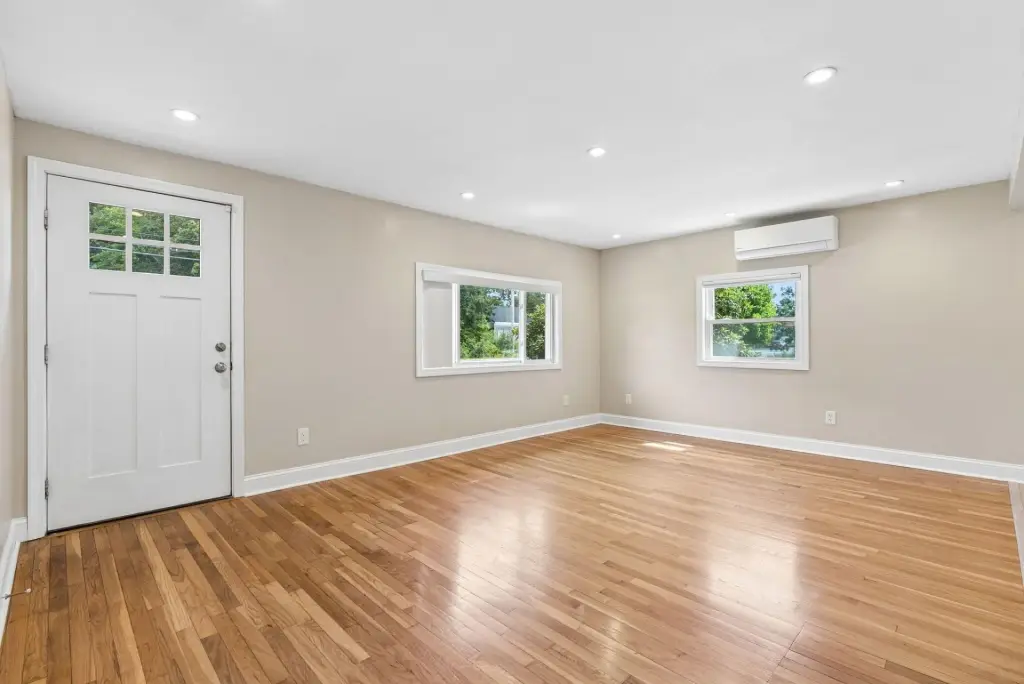
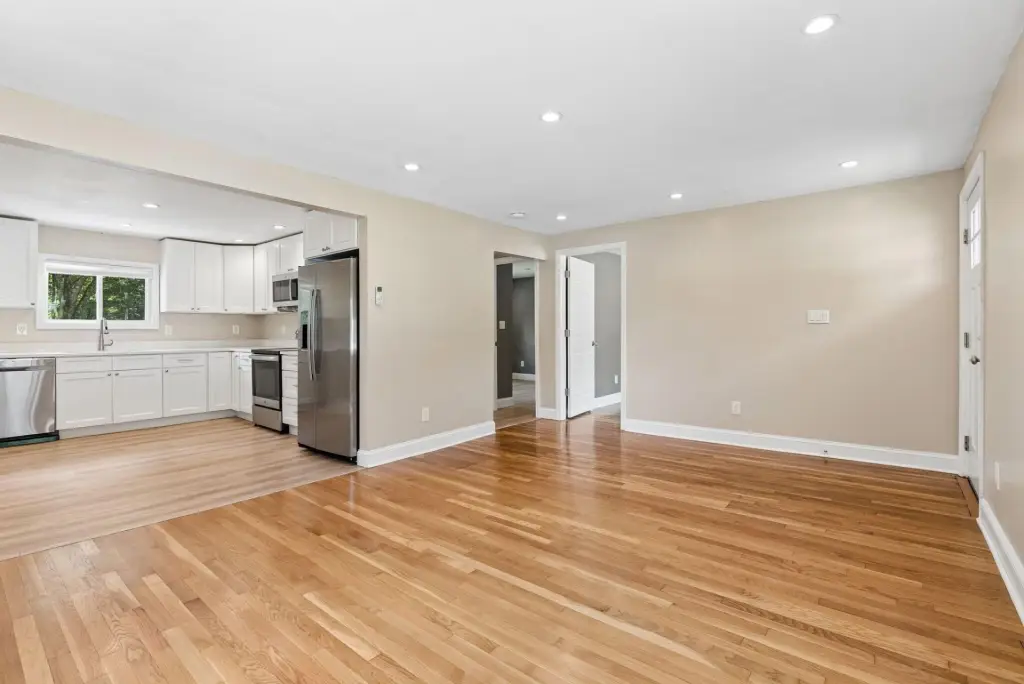
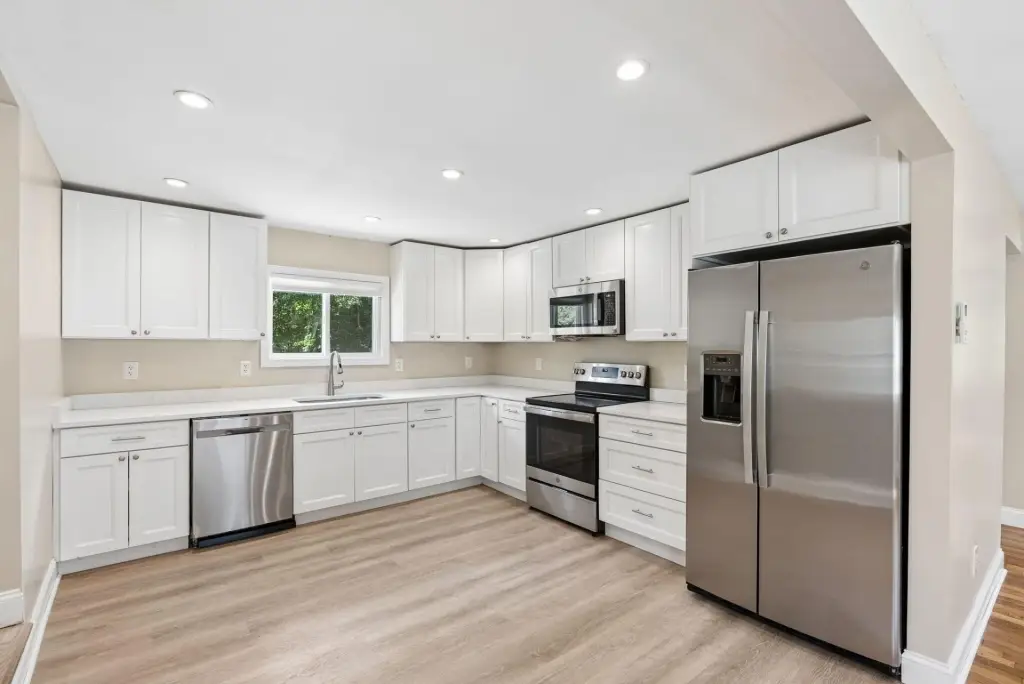
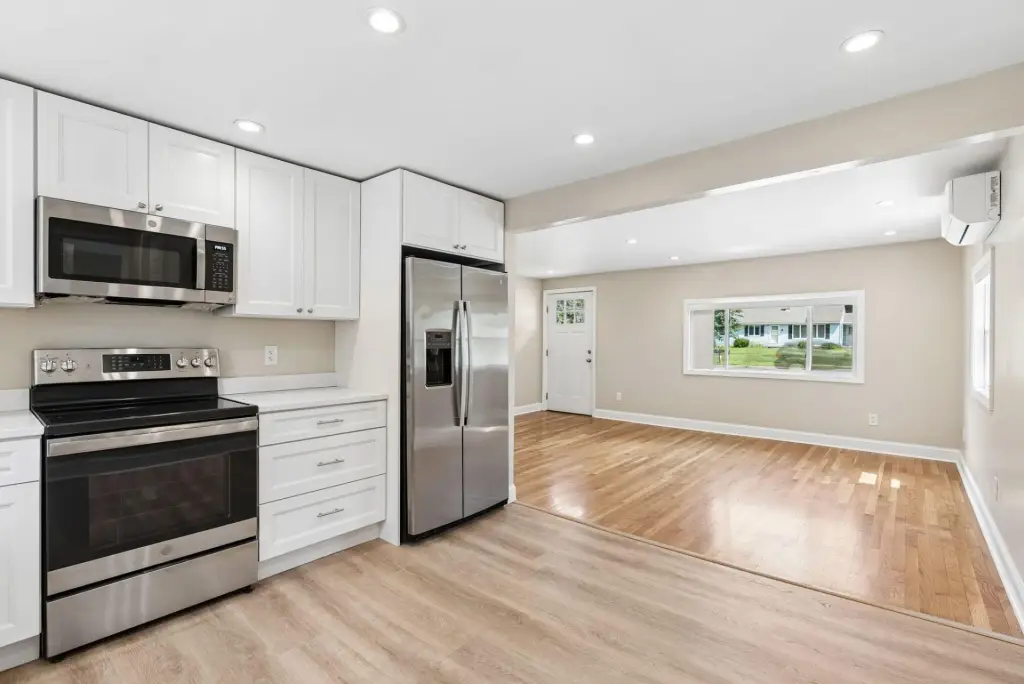
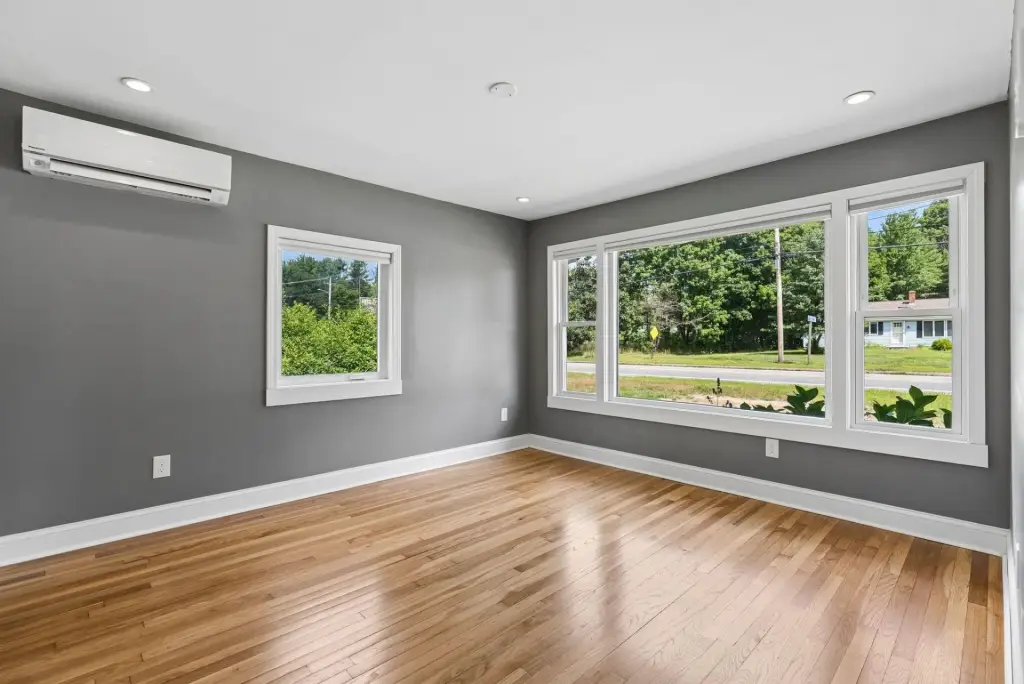
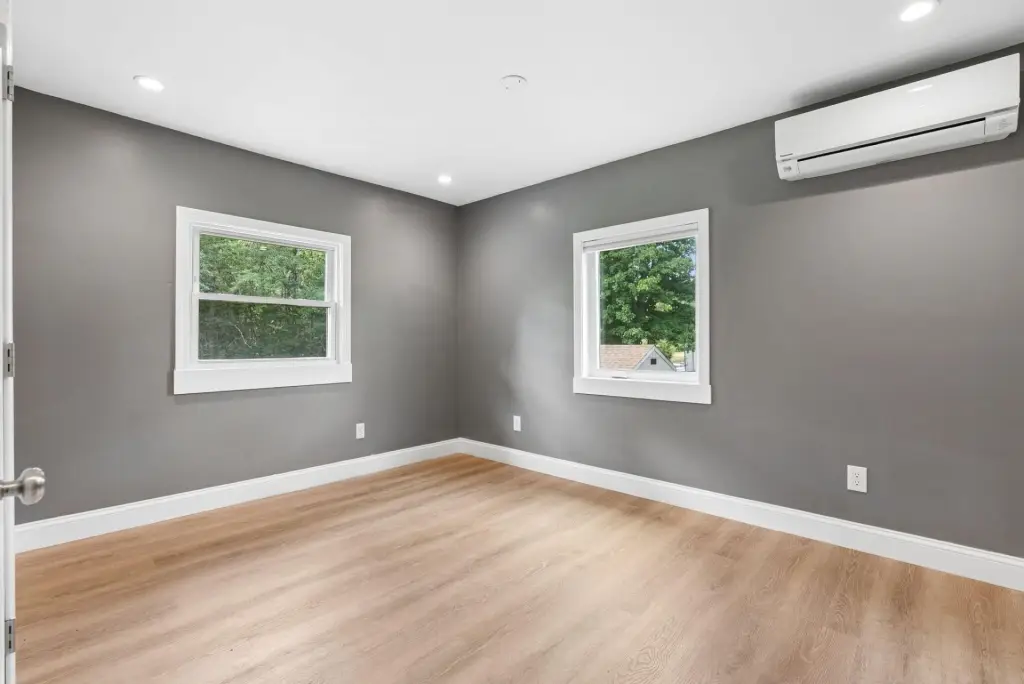
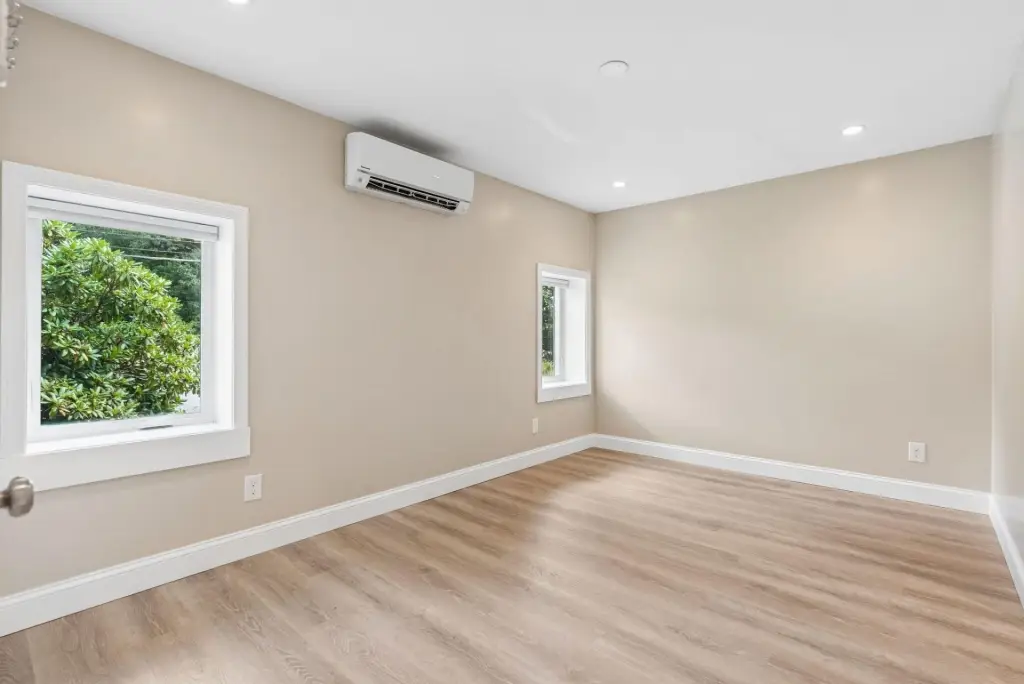
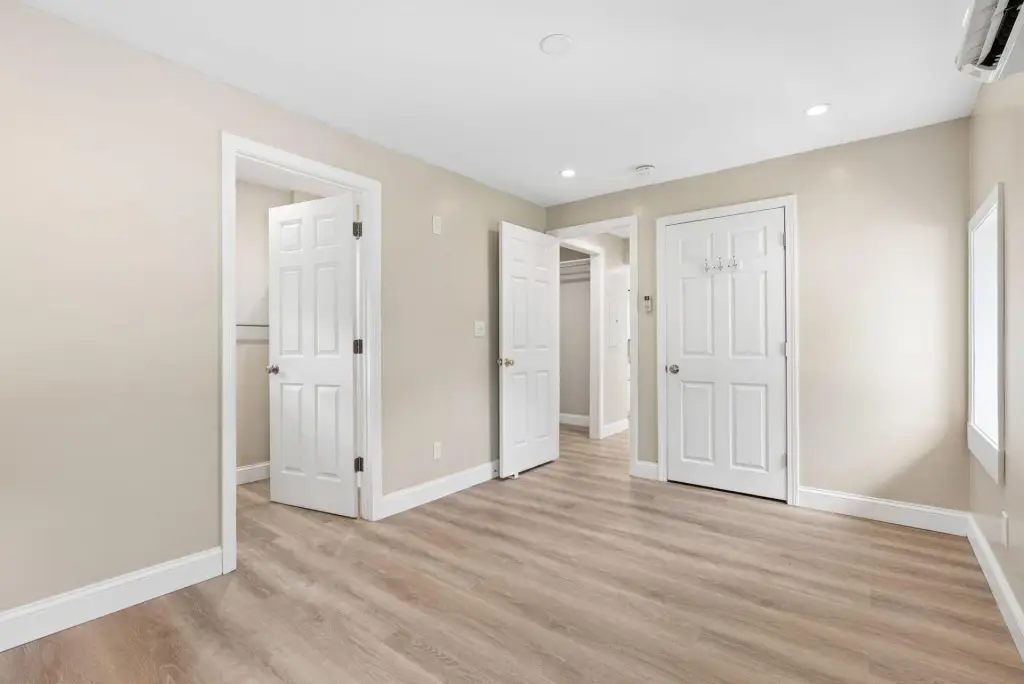
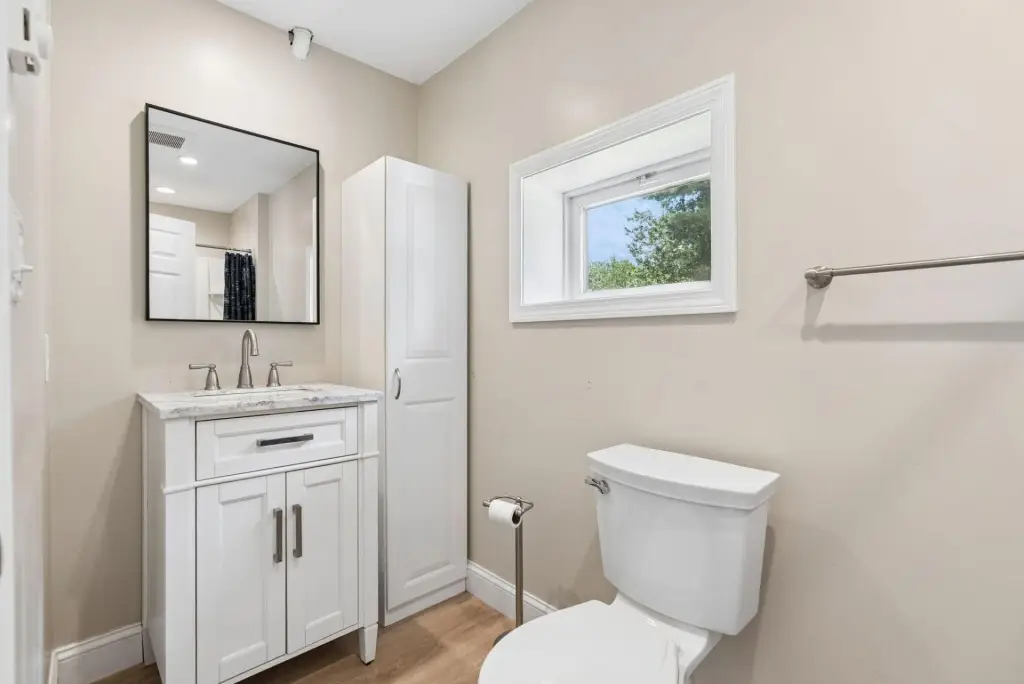
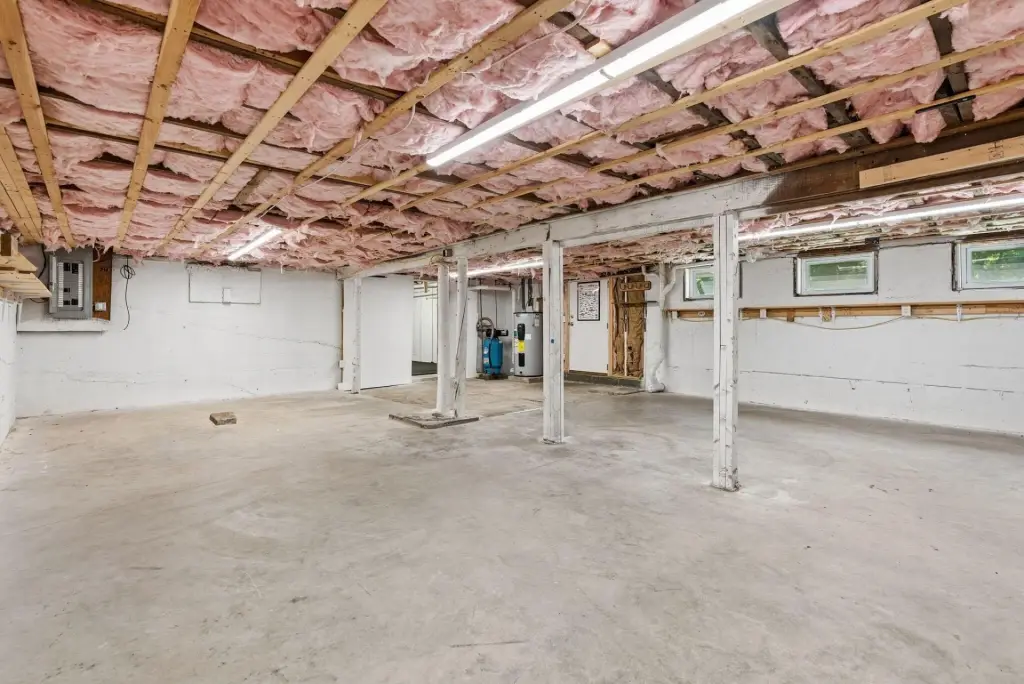
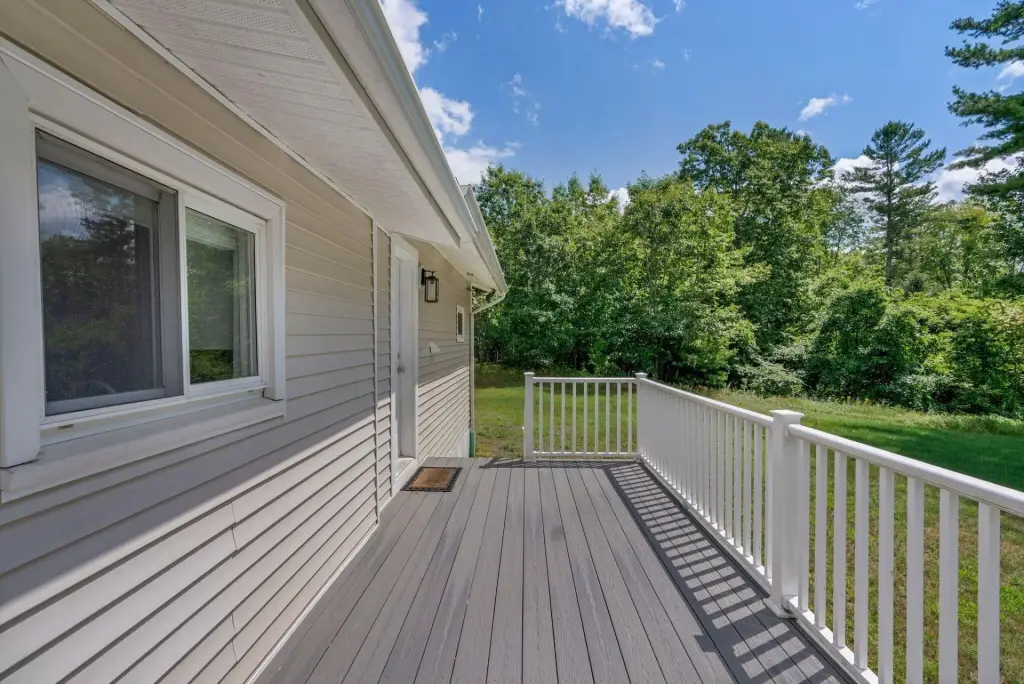
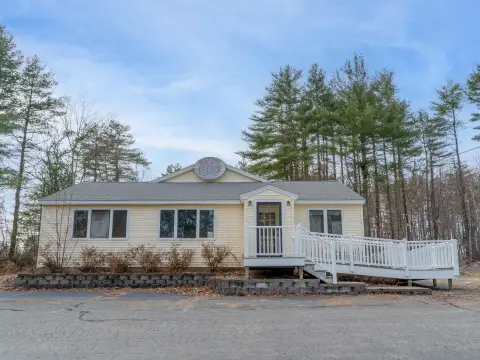
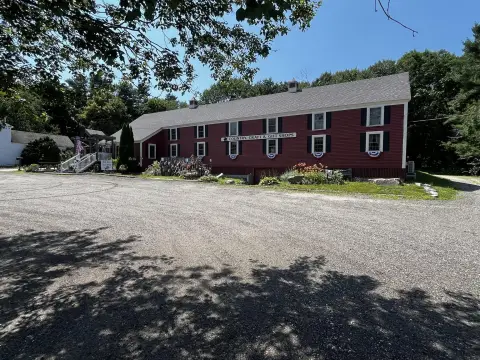
This renovated live-work property is arranged as a 3-bedroom, 2-bath ranch with approximately 1,100 square feet and an open interior layout. The 1965 building has received a new roof, siding, electrical system, septic system, six heat pumps, deck, bath fixtures, kitchen cabinetry, appliances, quartz countertops, and a foundation perimeter drain. A heated basement adds usable area, with groundwork already completed for future improvements.
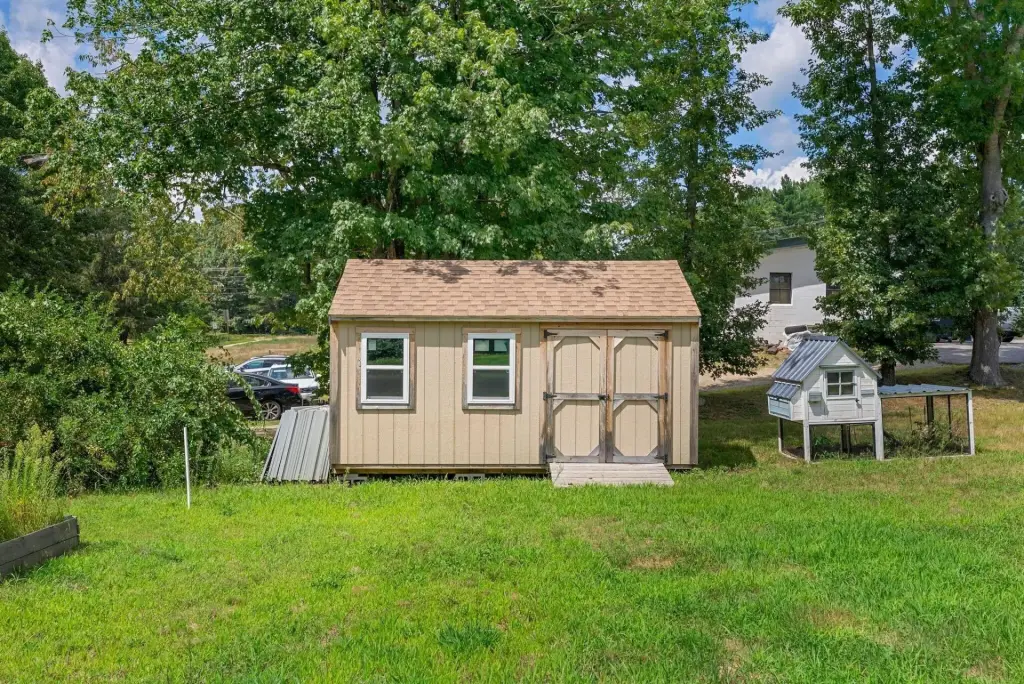
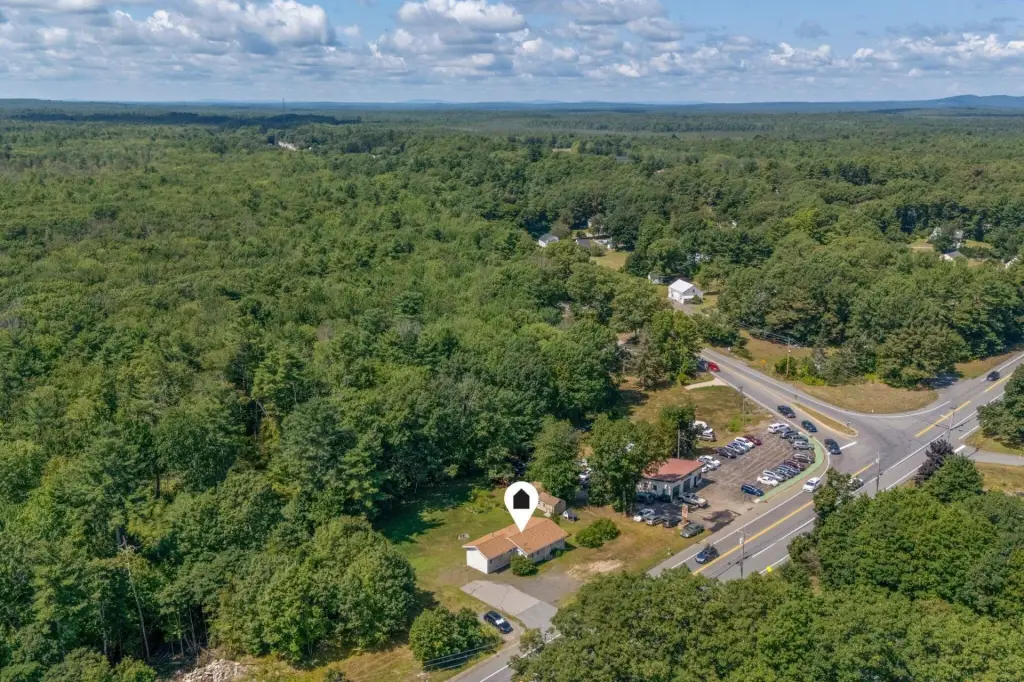
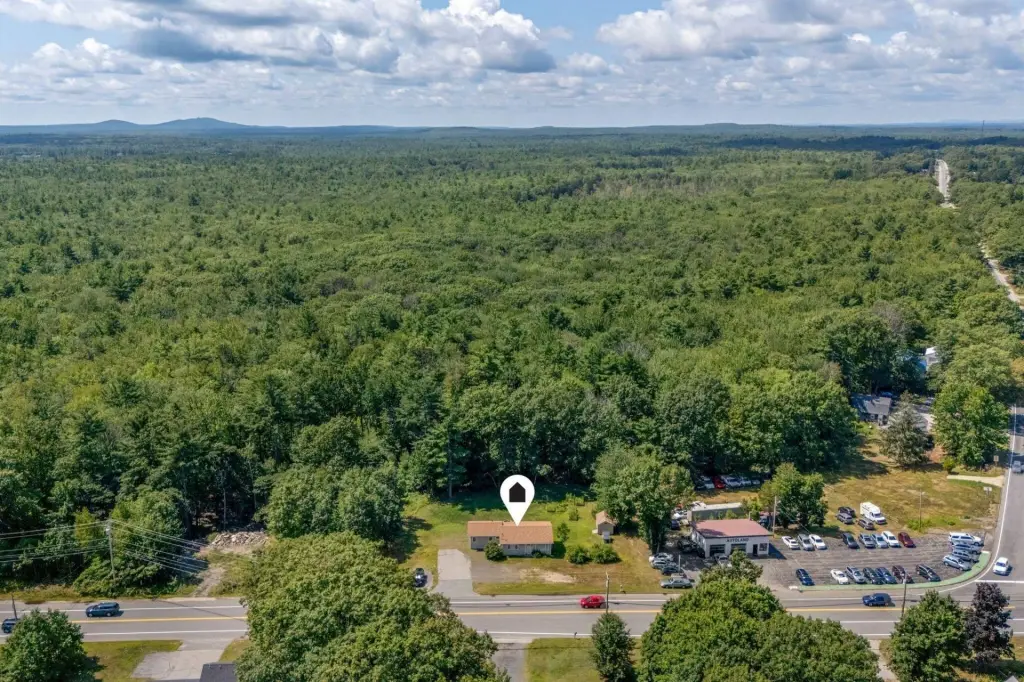
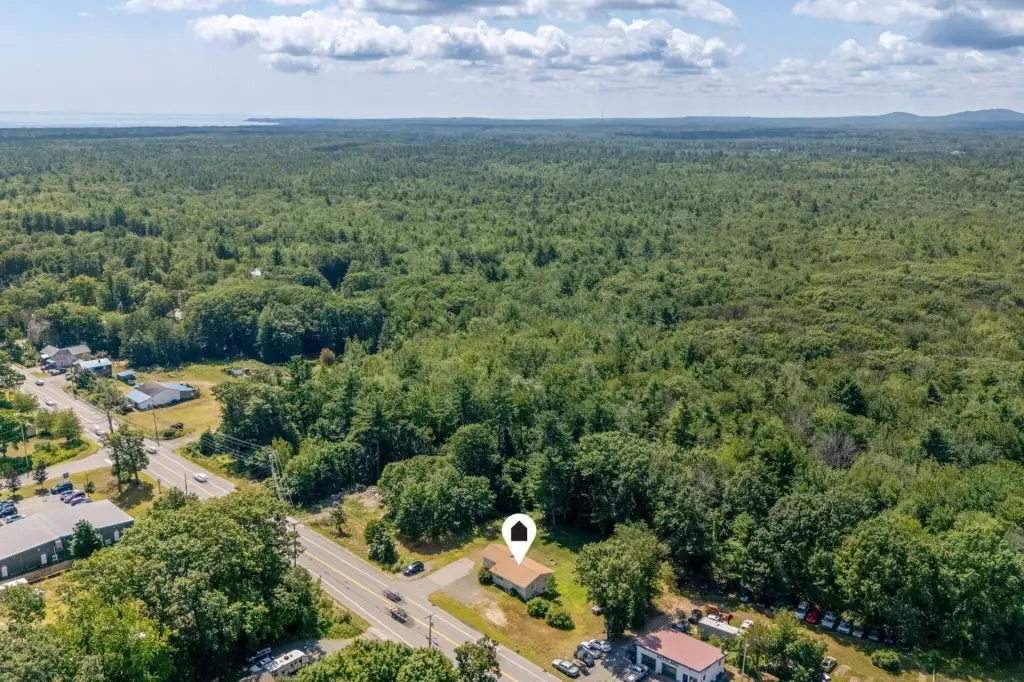
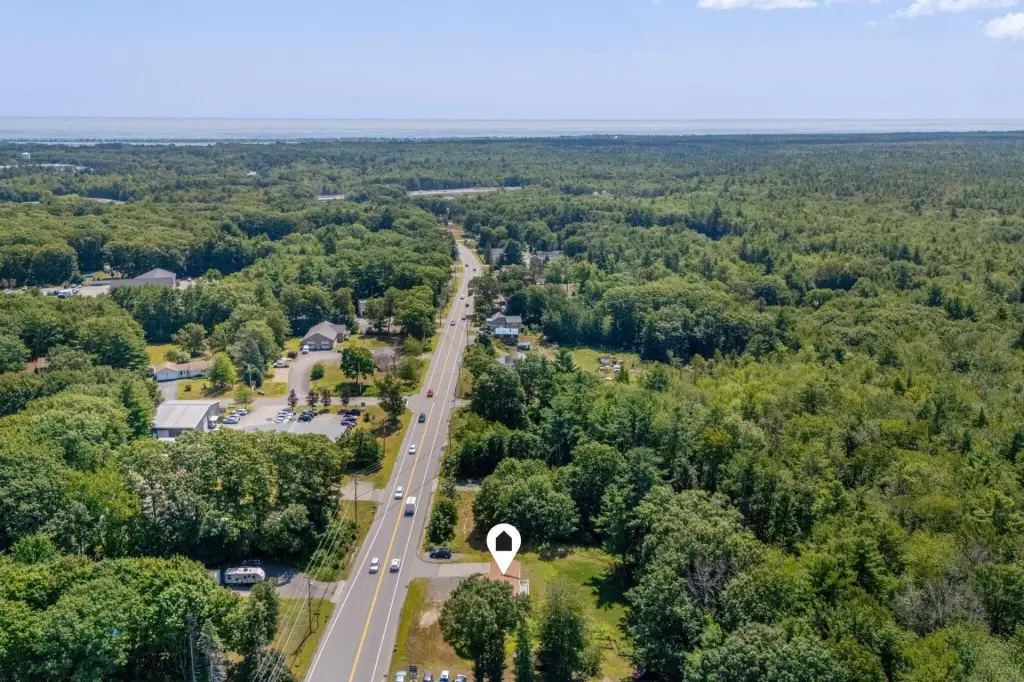
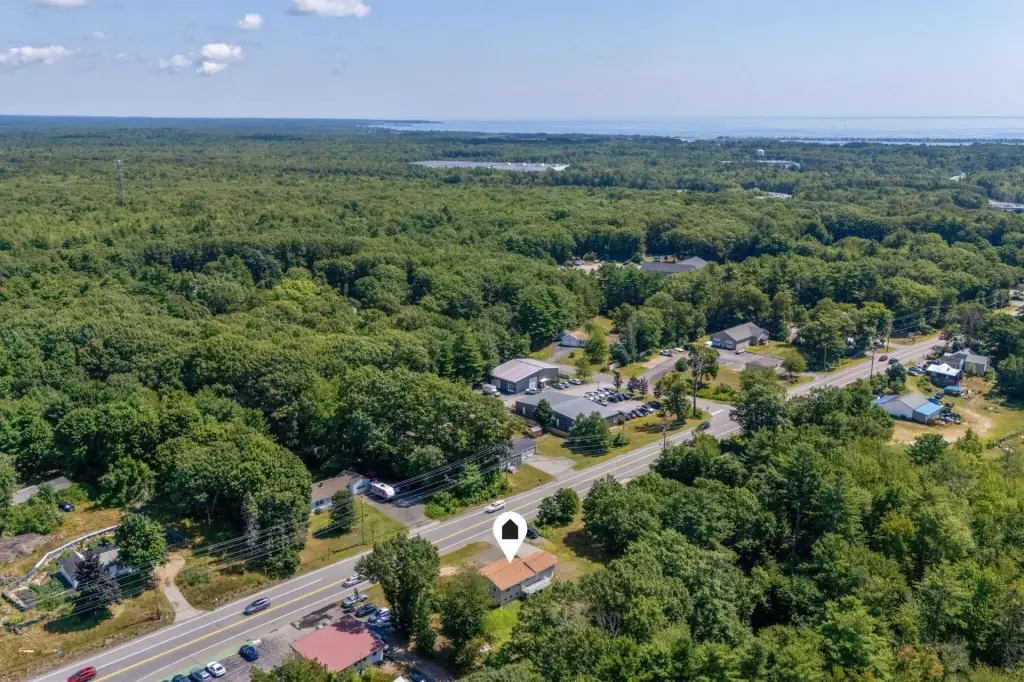
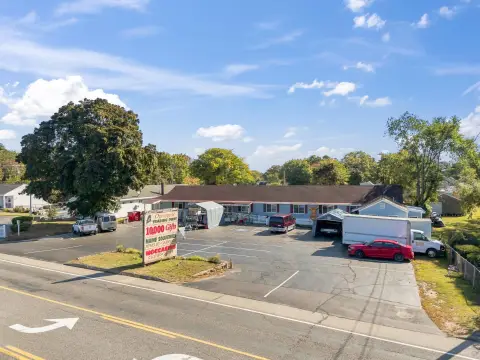
The property includes a large yard, deck, and space for parking and outdoor activities. It is situated in Wells Business District zoning, with access to the Maine Turnpike, Route 1, Wells beaches, businesses, shopping, and services. Potential office, professional, live-work, residential, or other business uses should be verified with the Town of Wells.
The property includes a large yard, deck, and space for parking and outdoor activities. It is situated in Wells Business District zoning, with access to the Maine Turnpike, Route 1, Wells beaches, businesses, shopping, and services. Potential office, professional, live-work, residential, or other business uses should be verified with the Town of Wells.
Key Highlights
- Renovated 3‑bedroom, 2‑bath ranch built in 1965
- Approximately 1,100 square feet with an open interior layout
- Extensive improvements include roof, siding, electrical, septic, and six heat pumps
Financial Insights
Estimated NOI and Cap Rate
NOI / Yr
$18,018
Cap Rate
4.34%
Suggested Prices Based on Cap Rates
Cap Rate 5%
$360,360
$360.4K
Cap Rate 7%
$257,400
$257.4K
Cap Rate 9%
$200,200
$200.2K
Market Conditions
NOI Build-Up for 1,100 SF
Gross rent
$27.5K $24.96/SF
− Vacancy
−$3.4K −$3.12/SF
EGI
$24.0K $21.84/SF
− OpEx
−$6.0K −$5.46/SF
NOI
$18.0K $16.38/SF
Area
York County, ME
Vacancy
12.50%
Lease Rate
$24.96 /SF/Yr
Expense Ratio
25.00%
Simulate Cap Rate and NOI
Suggested Prices Based on Cap Rates
Cap Rate 5%
$360,360
Cap Rate 7%
$257,400
Cap Rate 9%
$200,200
Alternative Uses
Best Use
Office B
$257.4K
$225.2K – $300.3K
NOI $18,018 @ 7.0% cap · market cap 4.34%
Second Best
Mixed Use
$195.2K
$170.8K – $227.7K
NOI $13,662 @ 7.0% cap · market cap 3.29%
Theoretical Best
Office A
$348.7K
$305.1K – $406.8K
NOI $24,409 @ 7.0% cap · market cap 5.88%
Zoning and permitted uses should be independently verified with authorities.
Property Analytics
Current Use
Lease Details
Yes
Highway access
Location Intelligence
Trade Area within ½ mile
26
Businesses Nearby
Explore this area
Business Placement
Demographics for 04090, ME
11,314
Population
9,590
Households
1.2
Avg Household Size
53
Median Age
38%
College-Educated
92%
High-School Grad
57.7 sq mi
ZIP Area
196
Density / Sq Mi
$83,900
Median Household Income
$47,928
Median Earnings
$1,313
Median Rent
$445,800
Median Home Value
Market
Vacancy Rate% for Office in Northeast region

Questions? Ask Rey
Realmo’s AI knows this listing — price, zoning, demand, history. Ask anything.





Frequently Asked Questions
What type of property is this?
Live-work space - Renovated ranch property with an open layout, heated basement, and flexibility for office, professional, residential, or combined use.
Where is this live-work space located?
The property is located at Wells, ME.
What is the asking price?
The asking price for this property is $415,000.
What are key features of this property?
This property features: Renovated 3‑bedroom, 2‑bath ranch built in 1965; Approximately 1,100 square feet with an open interior layout; Extensive improvements include roof, siding, electrical, septic, and six heat pumps


